
OEE Tracking Software: The Complete Guide for Modern Manufacturers
Manufacturing success is not just about how many products roll off the line each day. It is about how efficiently your machines, people, and processes work together to produce those products. That is exactly the gap that OEE tracking software is built to close. OEE, which stands for Overall Equipment Effectiveness, is the gold standard metric in manufacturing, and the software that tracks it in real time has become one of the most powerful tools available to factory managers, plant operators, and production engineers today. This guide tells you everything you need to know.
What OEE Actually Measures and Why It Matters
OEE is a single percentage that tells you exactly how effectively your manufacturing equipment is being used. It is calculated by combining three individual metrics: availability, performance, and quality.
Availability measures how much of the planned production time your machines were actually running. Performance measures how fast your machines ran compared to their optimal speed. Quality measures what percentage of the output met the required standard on the first pass. A perfect OEE score of 100 percent means your machines ran all the time, at full speed, with zero defects. In practice, world-class manufacturers target an OEE of 85 percent, and most factories starting their improvement journey sit significantly below that.
Without OEE tracking software, calculating this figure accurately requires manual data collection, complex spreadsheet formulas, and a significant investment of time from people who should be focused on running the factory. With the right software, it happens automatically, in real time, for every machine on the floor.
How the Software Collects Data Automatically
The foundation of any OEE tracking software is its ability to connect directly to machines and collect production data without any manual input from operators. Sensors, proximity detectors, photoelectric counters, and PLC integrations feed cycle counts, machine status signals, and quality data directly into the software platform continuously throughout every shift.
The software processes this raw signal data automatically. It tracks the exact moment each machine starts and stops, records the reason for every stoppage, counts every cycle completed, and flags every quality reject as it occurs. By the time a supervisor looks at the dashboard, every OEE component has already been calculated and displayed in real time without anyone having to count, log, or calculate anything manually.
Live Dashboards That Keep Everyone Aligned
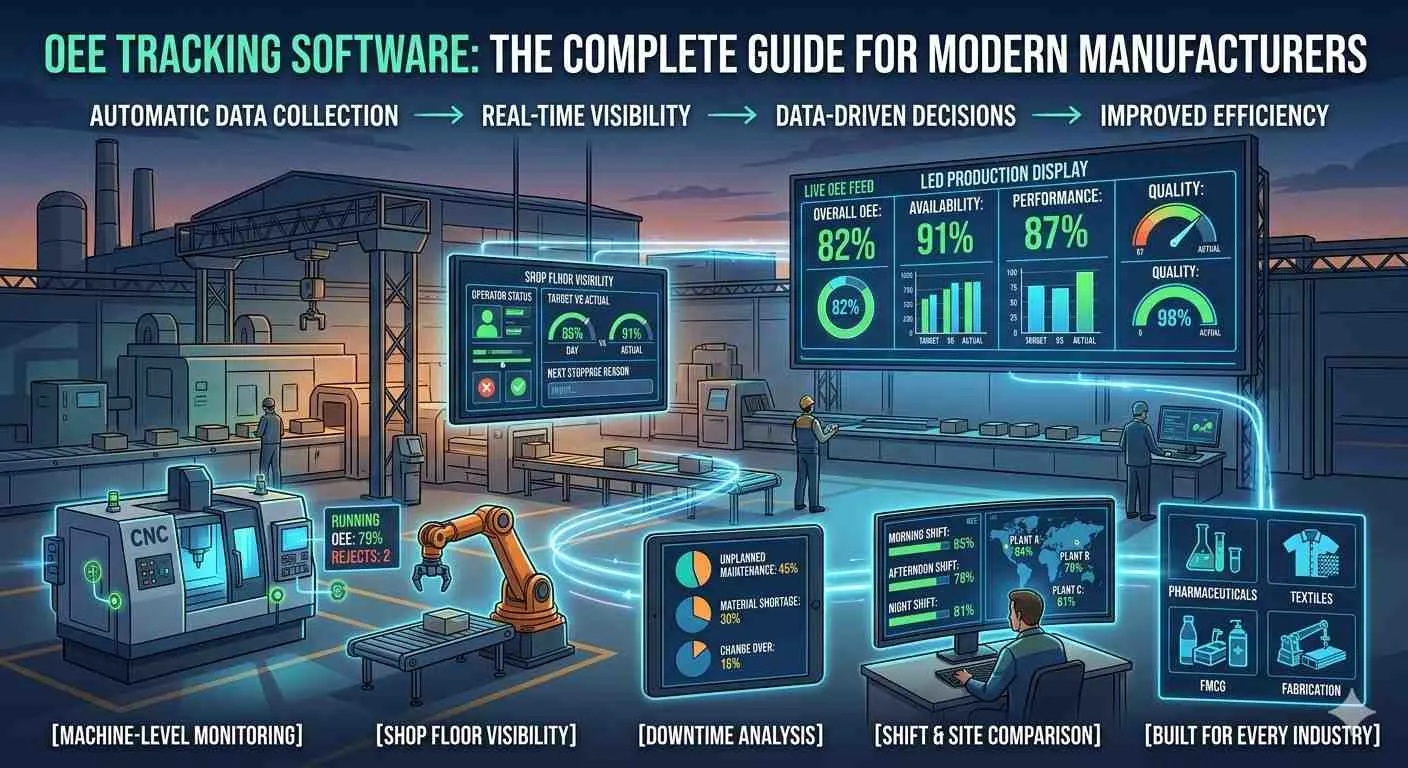
One of the most impactful features of OEE tracking software is how it makes performance data visible to everyone in the factory simultaneously. LED production display boards mounted on the shop floor show live OEE figures, target versus actual output counts, and machine status for every operator and supervisor to see at all times.
Smart TV dashboards in supervisors' offices and management meeting rooms bring the same live data to the people who make operational decisions. Mobile apps and cloud-based portals extend that visibility to plant managers and leadership teams who need to monitor performance across multiple facilities from any device, anywhere in the world. When the same accurate data is visible to everyone at the same time, accountability improves naturally and problems get addressed faster.
Downtime Analysis That Drives Real Improvement
Downtime is the single biggest destroyer of OEE, and OEE tracking software handles it with a level of precision that manual systems simply cannot match. Every downtime event is captured automatically with its start time, end time, duration, and reason code. This builds a detailed database of every stoppage across every machine, shift, and production line.
The power of this data becomes clear when it is analyzed over time. The software identifies which machines stop most frequently, which downtime reasons recur most often, which shifts experience the most disruption, and which times of day are most vulnerable to production losses. These are exactly the insights that maintenance teams and production managers need to prioritize improvement actions and prevent problems before they become patterns.
OEE Comparison Across Machines, Shifts, and Sites
A single OEE figure for a single machine on a single shift is useful. A comparison of OEE across every machine, every shift, and every production site is transformational. Modern OEE tracking software makes this comparison effortless through multi-level reporting dashboards that present machine-level, line-level, and plant-level OEE side by side.
Managers can instantly identify which machines are performing well and which are dragging down overall efficiency. They can compare day shift performance against night shift performance and investigate the reasons behind the gap. For multi-plant operations, they can benchmark one facility against another and direct improvement resources to the locations where the impact will be greatest.
Built for Every Manufacturing Environment
OEE tracking software is not a tool reserved for large automotive manufacturers or high-tech electronics producers. It delivers measurable value in any factory where machines produce output on a shift basis. Pharmaceutical manufacturers use it to track batch efficiency and maintain compliance records. Textile mills use it to monitor machine utilization across large factory floors. FMCG producers use it to sustain the throughput volumes that their supply chains depend on. Engineering and fabrication shops use it to compare job performance against target cycle times.
The software scales to fit the operation, whether that means monitoring ten machines in a single facility or hundreds of machines across multiple plants in different geographies.