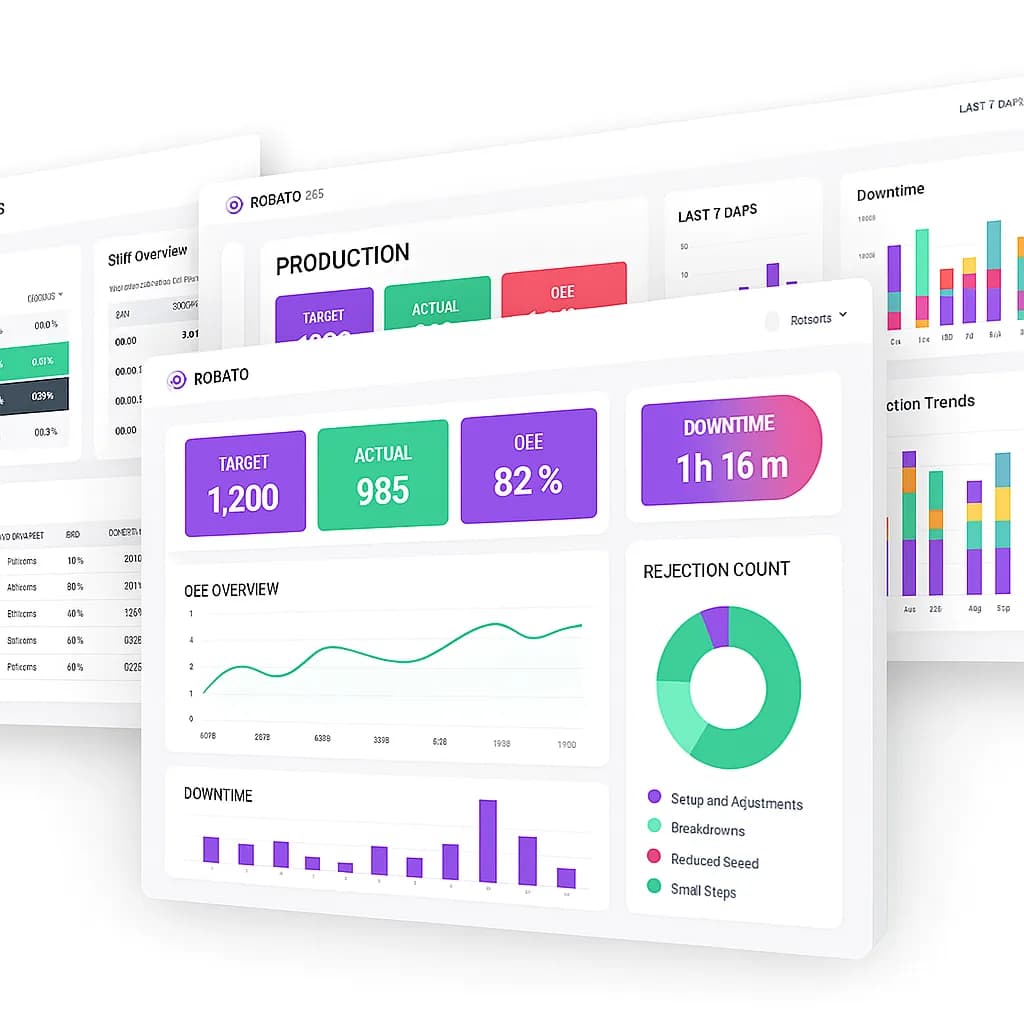
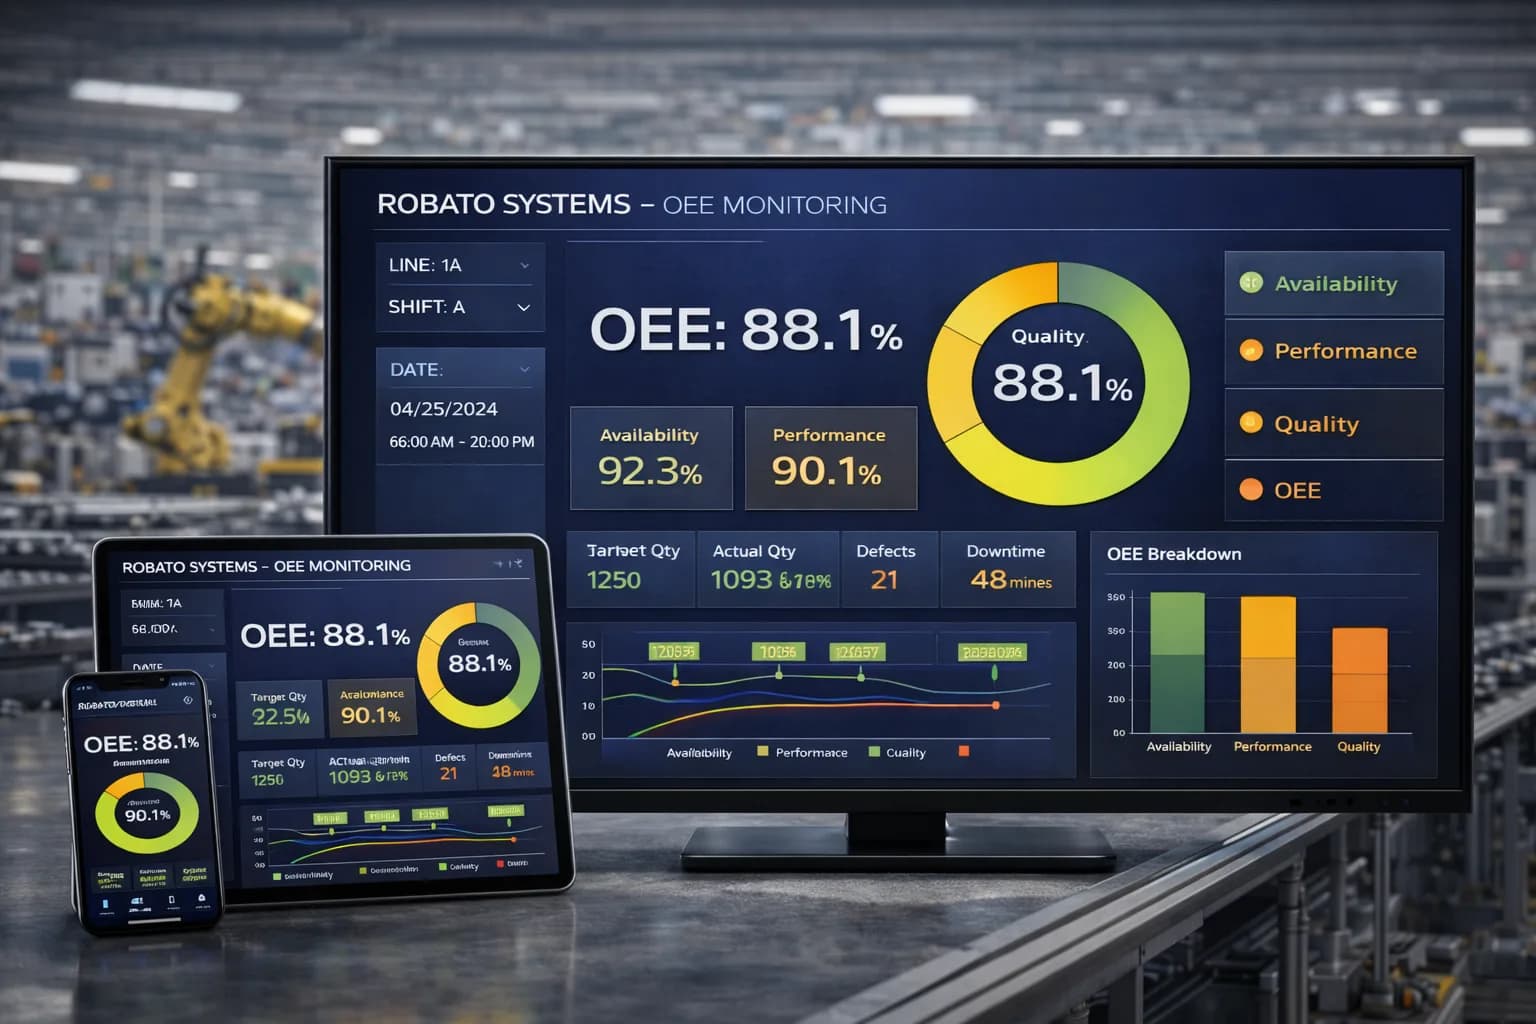
MachinoX Pro - Production Monitoring System

Robato SystemsIndustrial LED Andon boards

Andon board display system

LED boards for real-time alerts and production status.

The Robato Andon Board Display System is an industrial LED display solution designed for real-time visibility of machine status, operator calls, breakdown alerts, production counts, shift performance and downtime information. With support for WiFi, Ethernet, RF wireless, PLC inputs and cloud or on-prem monitoring software, it provides complete shop-floor transparency.
Call now
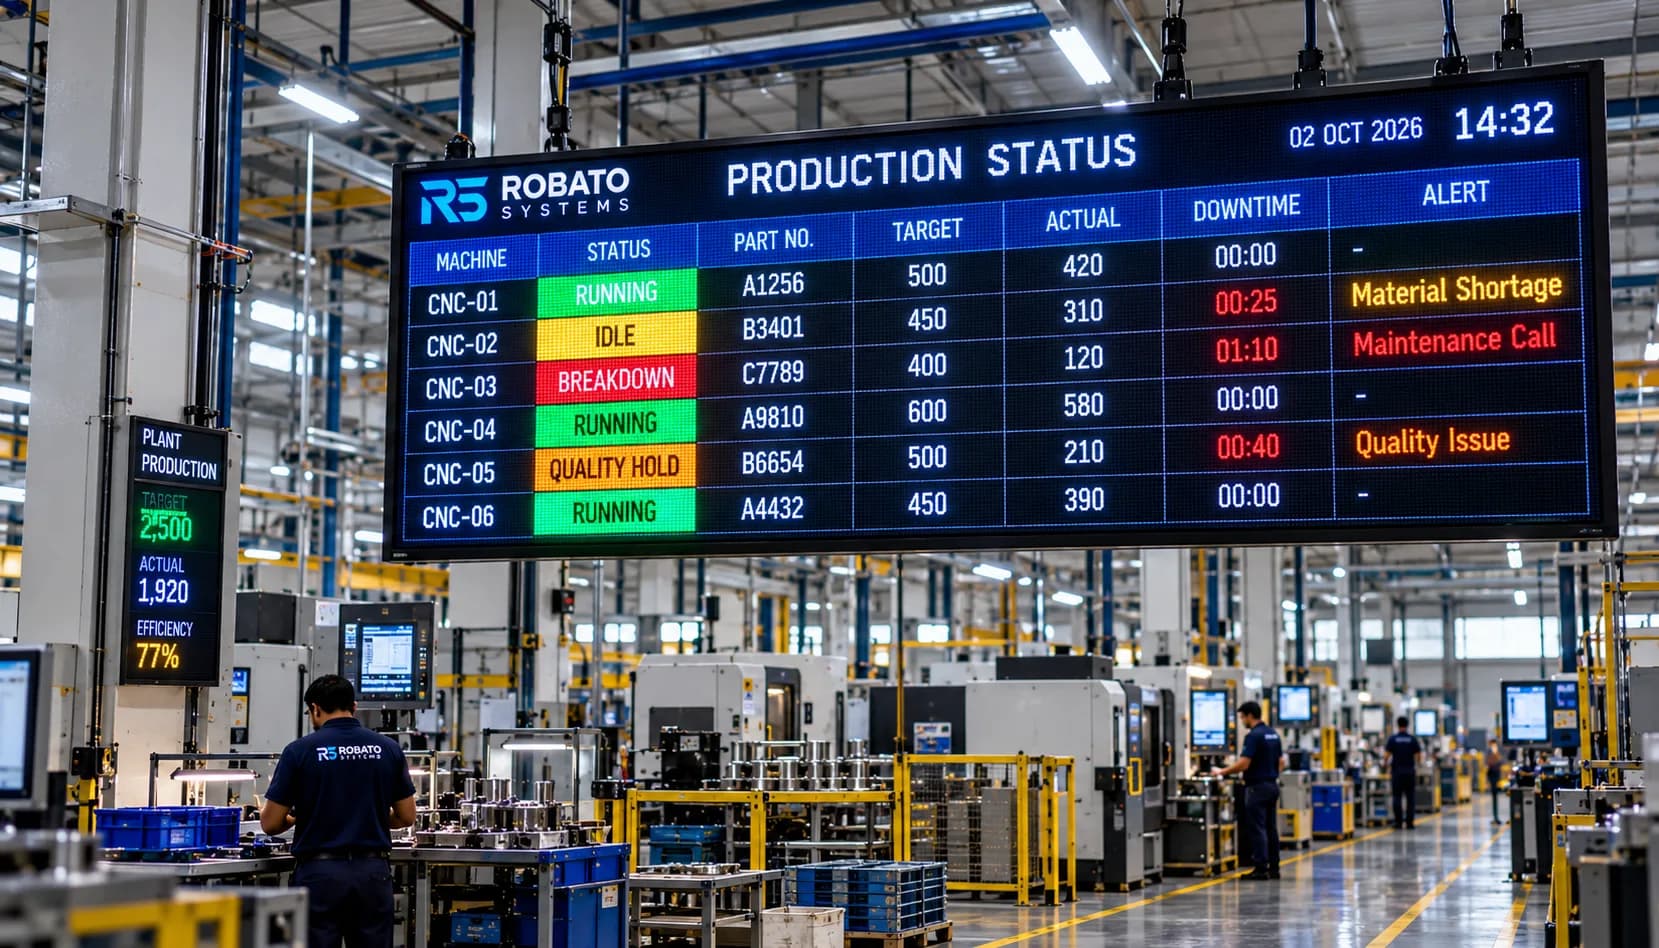
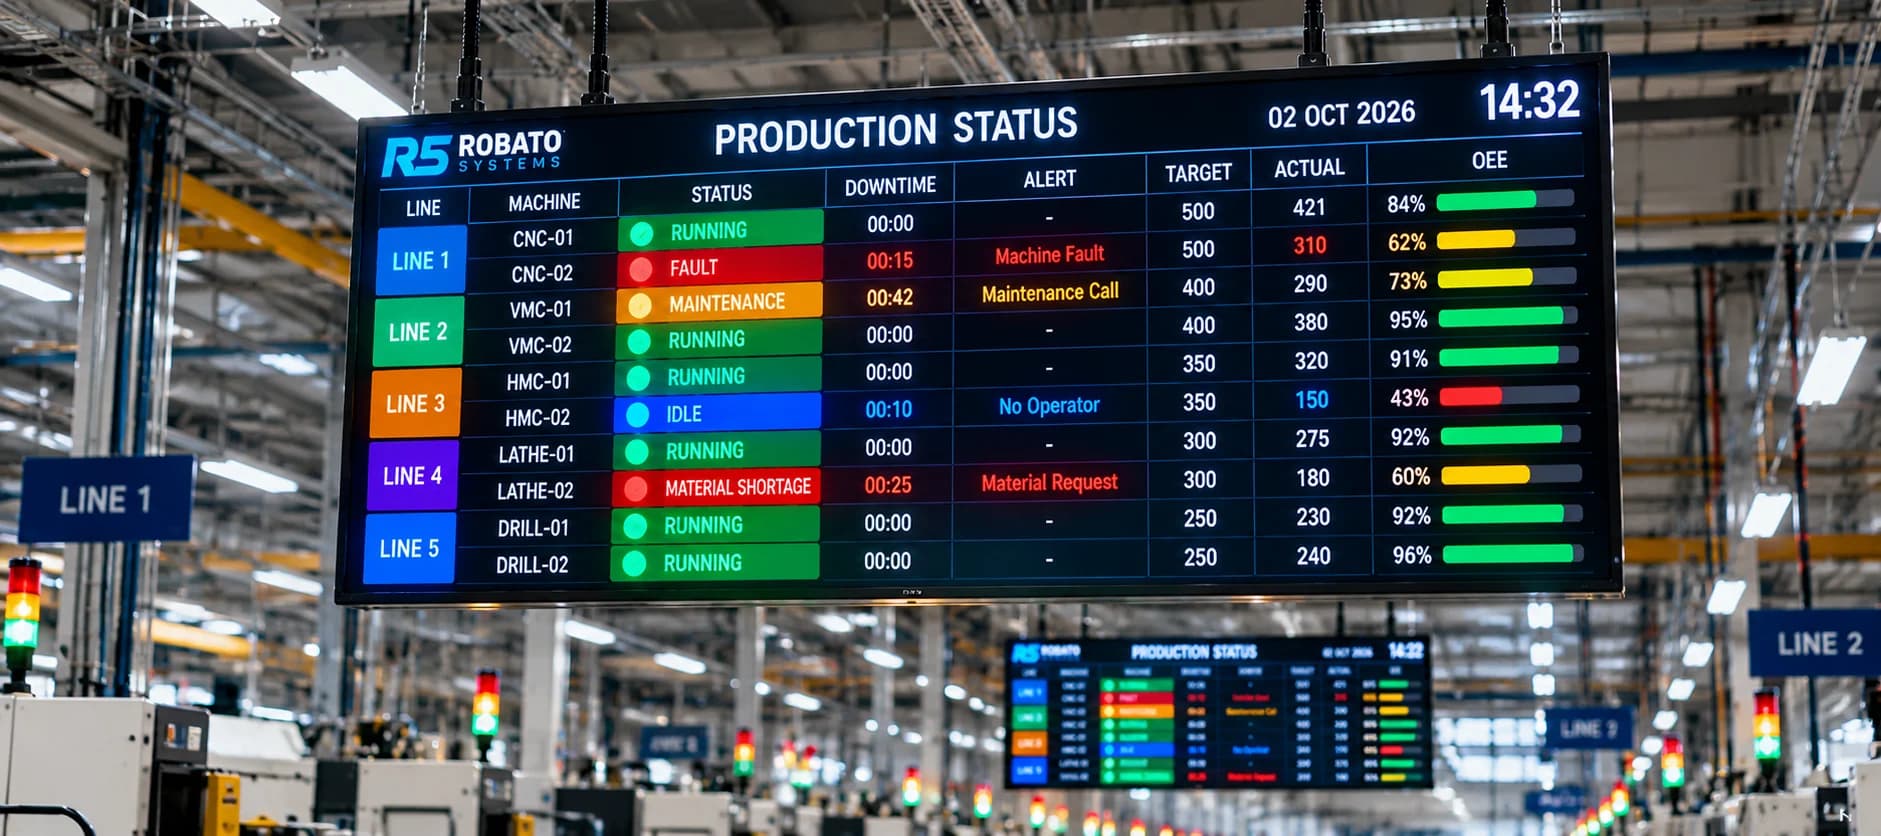
Robato production status board hanging above a factory floor, showing line, machine, status, downtime, alert, target, actual and OEE for ten machines
Fig. 01A production status board over the floor: line, machine, status, downtime, alert, target, actual and OEE for ten machines.
Connectivity
WiFi, Ethernet, RF wireless
Inputs
PLC, sensors, 24 VDC, dry contact
Board sizes
2, 4 or 6 ft, or custom
LEDs
Red, amber, green or RGB
Software
Cloud or on-prem
What it is01 / 10

What is an Andon board display system?

An Andon board is a large LED display installed in production areas to show live machine data, alerts and performance metrics.

It improves communication, reduces downtime and enables supervisors to take action quickly.

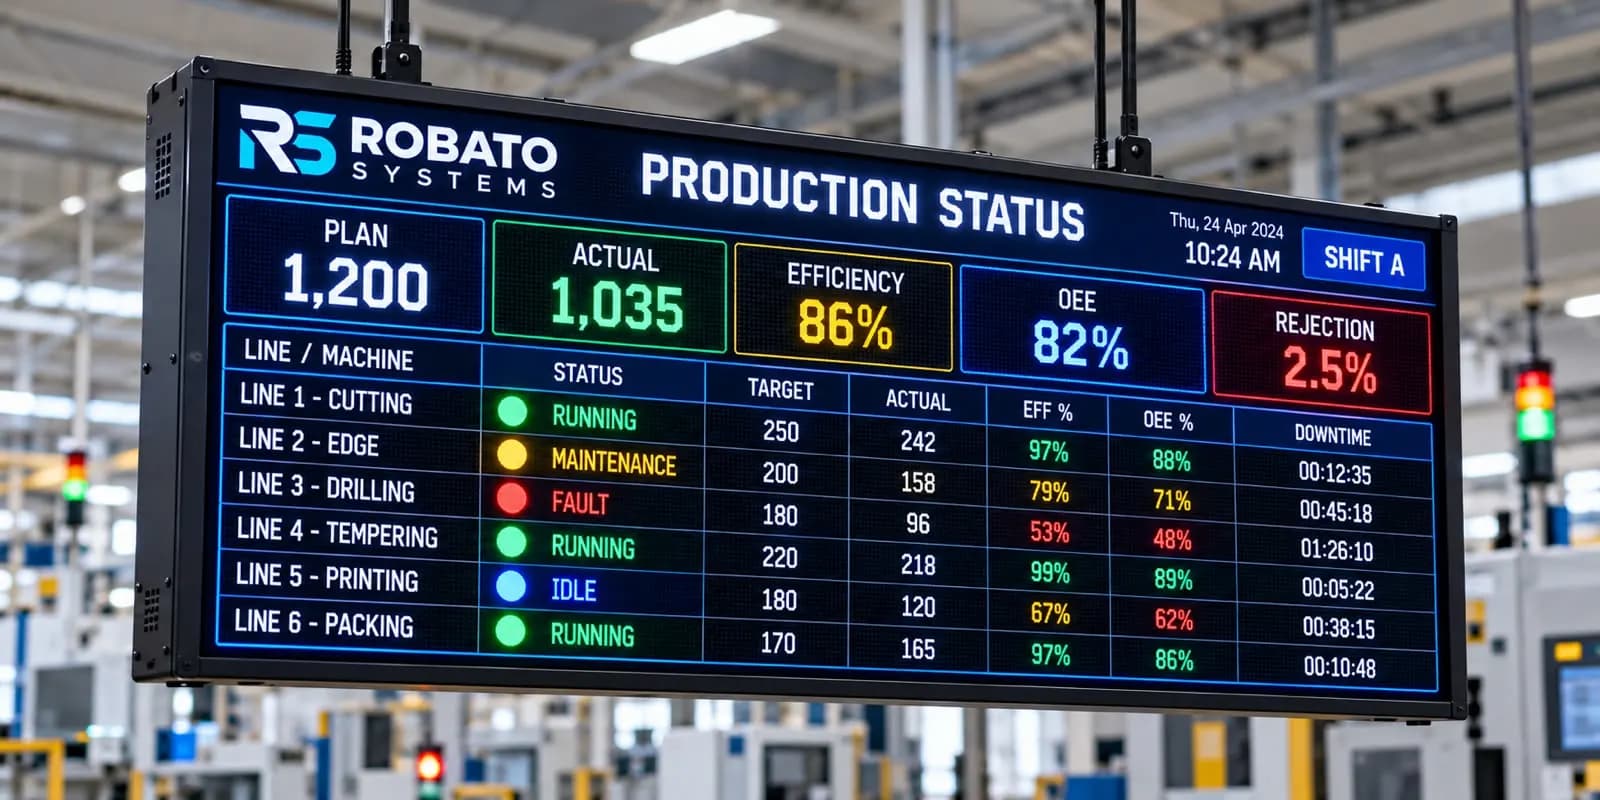
The Andon board can display

  • 01Machine running, idle and breakdown status
  • 02Operator calls for maintenance, quality and material
  • 03Downtime reason codes
  • 04Target vs actual production
  • 05Shift efficiency
  • 06OEE KPIs
  • 07Hourly production updates
  • 08Alerts from wireless Andon buttons
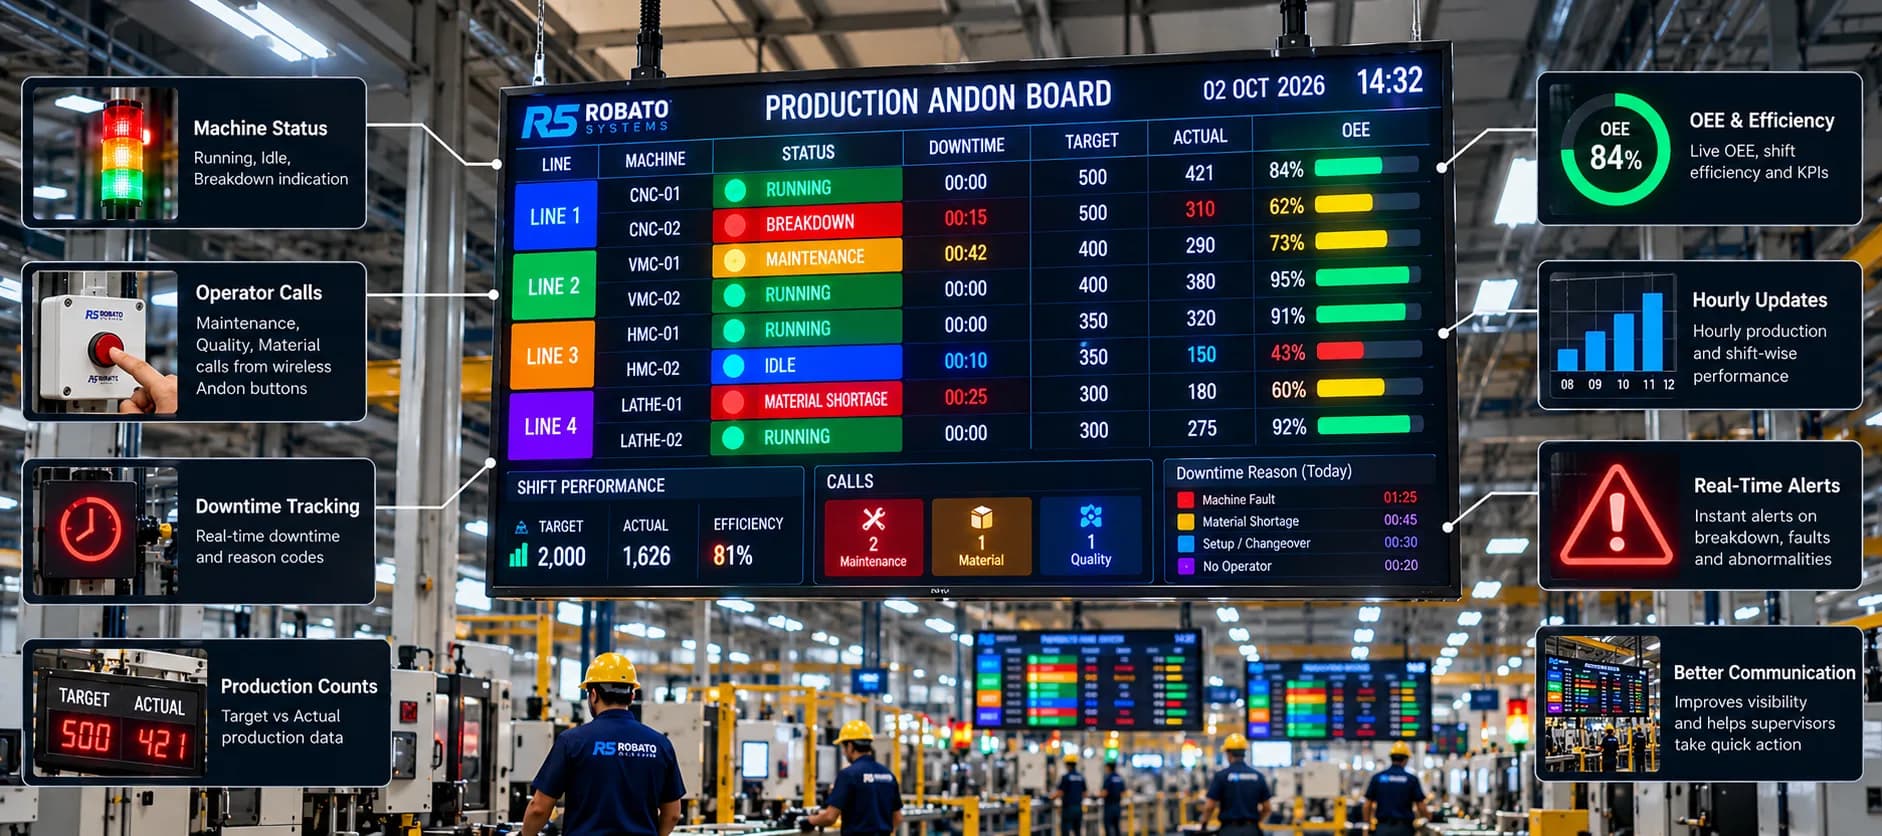
Robato production Andon board with machine status, operator calls, downtime tracking, production counts, OEE, hourly updates and real-time alerts called out around it
Fig. 02One production Andon board: machine status, operator calls, downtime, counts, OEE, hourly updates and alerts, readable from across the floor.
How it works02 / 10

How the smart Andon display system works

The Robato Systems Smart Andon Display gives production teams a large, highly visible view of machine status, production progress and downtime conditions directly on the shop floor. It can operate as a standalone display or as part of the wider MachinoX Pro production monitoring platform.

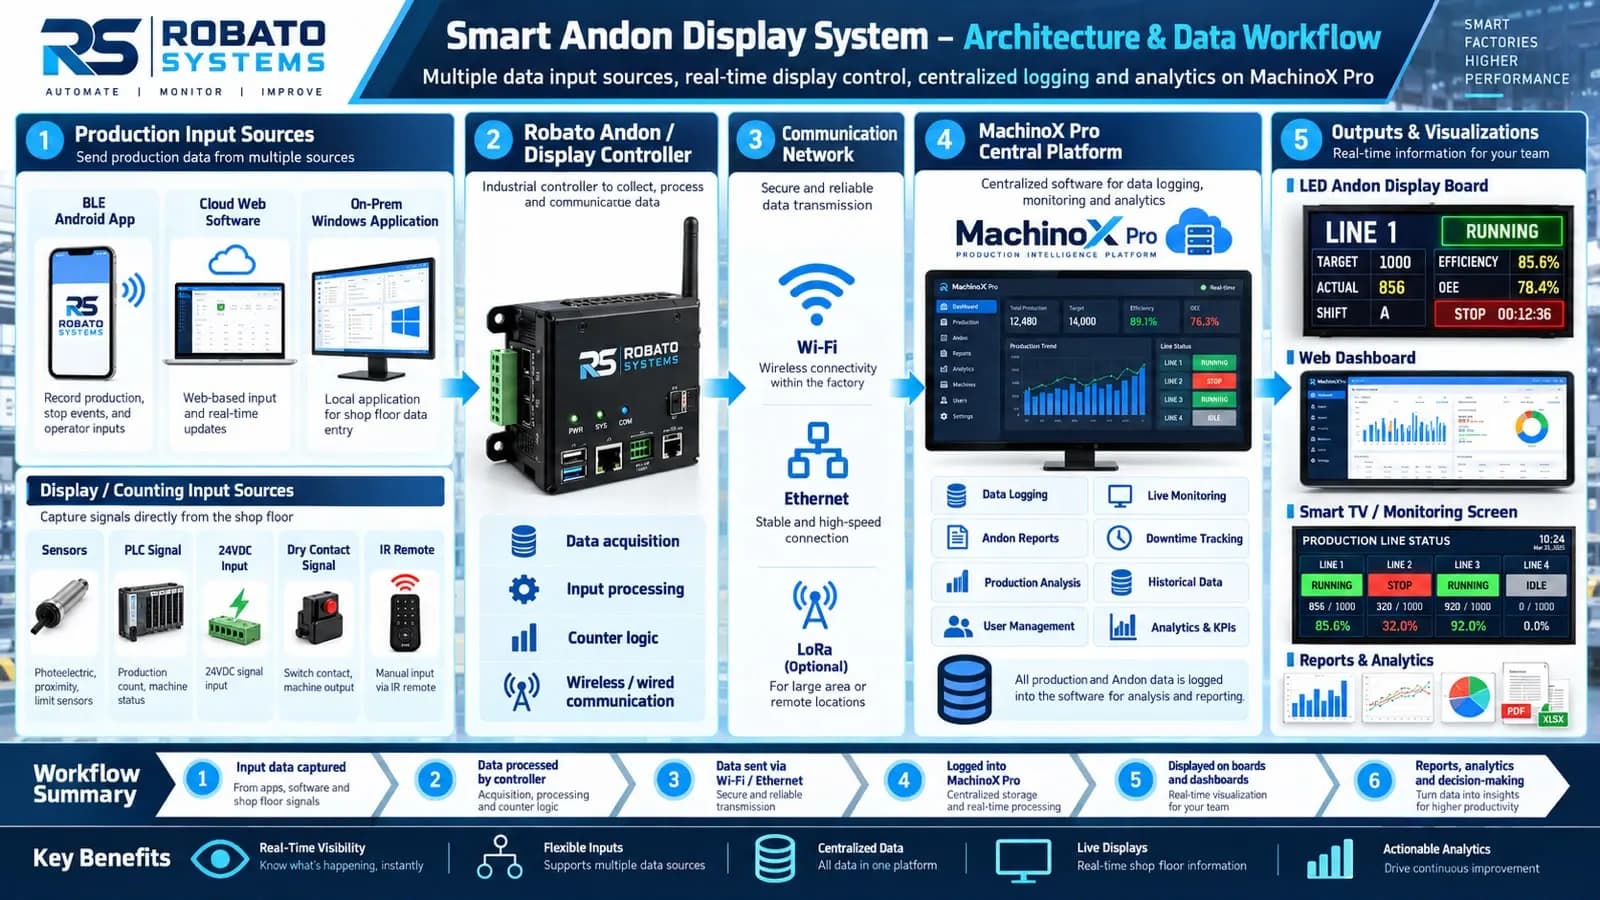
Smart Andon Display System architecture and data workflow: production input sources, the Robato display controller, Wi-Fi, Ethernet and LoRa communication, the MachinoX Pro central platform, and outputs to LED boards, web dashboards, Smart TVs and reports
Fig. 03Smart Andon Display System: input sources, the display controller, the network, MachinoX Pro and the outputs it feeds.Open full size
  1. 01

    Production plan and target are set

    Production information can be entered through the MachinoX Pro web application, BLE Android application or on-premise Windows application. Depending on the project, users can define the production line, part number, product, shift, production plan and target quantity.

    Defined per project

    • Production line
    • Part number
    • Product
    • Shift
    • Production plan
    • Target quantity
  2. 02

    Production count is captured automatically

    The display/controller can receive production counting signals from different shop-floor sources, including photoelectric/proximity sensors, PLC signals, 24 VDC digital inputs, dry-contact signals or other machine outputs. Manual count or configuration input can also be provided through an IR remote or approved operator interface where required.

    Counting sources

    • Photoelectric / proximity sensors
    • PLC signals
    • 24 VDC digital inputs
    • Dry-contact signals
    • Other machine outputs
    • IR remote
  3. 03

    Live production data is processed

    The industrial controller processes the incoming production signals in real time and continuously calculates values such as Actual Production, Balance Quantity, Target Achievement and Production Efficiency.

    Calculated live, every count

    Target
    500
    Actual
    421
    Balance
    79
    Achievement
    84%
  4. 04

    Machine and line status are updated

    Machine status can also be captured from the PLC, machine signals or Andon system. Colour-coded information makes abnormal conditions immediately visible across the production floor.

    The display can clearly show

    • Running
    • Idle
    • Maintenance
    • Fault
    • Quality
    • Material / logistics
  5. 05

    Information is shown on the industrial LED display

    The Andon display presents selected information in a format designed for long-distance shop-floor visibility. For multi-line applications, one display can show the live status of several production lines or machines simultaneously.

    Depending on display size and project, it can show

    • Shift
    • Plan
    • Target
    • Actual
    • Balance
    • Efficiency
    • OEE
    • Machine status
    • Downtime
    • Part number
    • Product
    • Rejection
    • Time
  6. 06

    Data is sent to MachinoX Pro

    Using Wi-Fi or Ethernet connectivity, production and machine-status data is transmitted to the MachinoX Pro software platform. This provides a common data source for shop-floor displays, Smart TV dashboards and management applications.

    One data source for

    • Shop-floor displays
    • Smart TV dashboards
    • Management applications
  7. 07

    Downtime and Andon events are highlighted immediately

    If a machine stops or an Andon issue is raised, the affected line can automatically change status and colour on the display. Optional audio alarms or separate Andon alert displays can also be integrated for critical events.

    For example

    • Fault in red
    • Maintenance in yellow / amber
    • Running in green
    • Idle in a configurable colour
  8. 08

    Production performance is logged automatically

    Production counts, status changes, downtime events and shift performance are stored in the central software. This eliminates dependence on manual production boards and creates a reliable historical record.

    Stored centrally

    • Production counts
    • Status changes
    • Downtime events
    • Shift performance
  9. 09

    Dashboards, reports and analytics are generated

    MachinoX Pro converts the collected data into useful production intelligence.

    Including

    • Target vs actual
    • Production efficiency
    • OEE
    • Shift performance
    • Hourly production trends
    • Downtime analysis
    • Rejection analysis
    • Production loss analysis
    • Historical reports
  10. 10

    Management gets one real-time view of production

    Operators see immediate information on the LED display, supervisors can monitor the shop floor through Smart TV dashboards, and management can access detailed reports and analytics through MachinoX Pro.

    Operators
    Immediate information on the LED display
    Supervisors
    The shop floor on Smart TV dashboards
    Management
    Detailed reports and analytics in MachinoX Pro

Simple end-to-end workflow

  1. 01Production plan / target
  2. 02Machine or sensor input
  3. 03Robato display controller
  4. 04Live LED display
  5. 05Wi-Fi / Ethernet
  6. 06MachinoX Pro
  7. 07Data logging
  8. 08Dashboards
  9. 09Reports & analytics

Typical Andon display applications

The system can be configured for:

  • 01Single-machine production counters
  • 02Target vs actual displays
  • 03Multi-line production status boards
  • 04OEE and efficiency displays
  • 05Downtime Andon boards
  • 06Hourly production boards
  • 07Shift-performance displays
  • 08Central factory production dashboards
Board types03 / 10

Robato LED Andon board types

Choose from single-line, multi-line, multi-machine and custom LED boards.

  1. 01

    Single-line Andon board

    Displays machine status or simple text messages (Running / Idle / Breakdown).

  2. 02

    Multi-line Andon board

    Displays multiple machine statuses, operator calls or downtime messages.

  3. 03

    Multi-machine Andon display

    Shows the status of 4, 8, 12 or more machines on one board.

  4. 04

    RGB LED Andon board

    Uses multi-colour LED segments to highlight critical alerts.

  5. 05

    Custom size Andon boards

    Tailored layouts, LED pixel pitch, colours, symbols and branding.
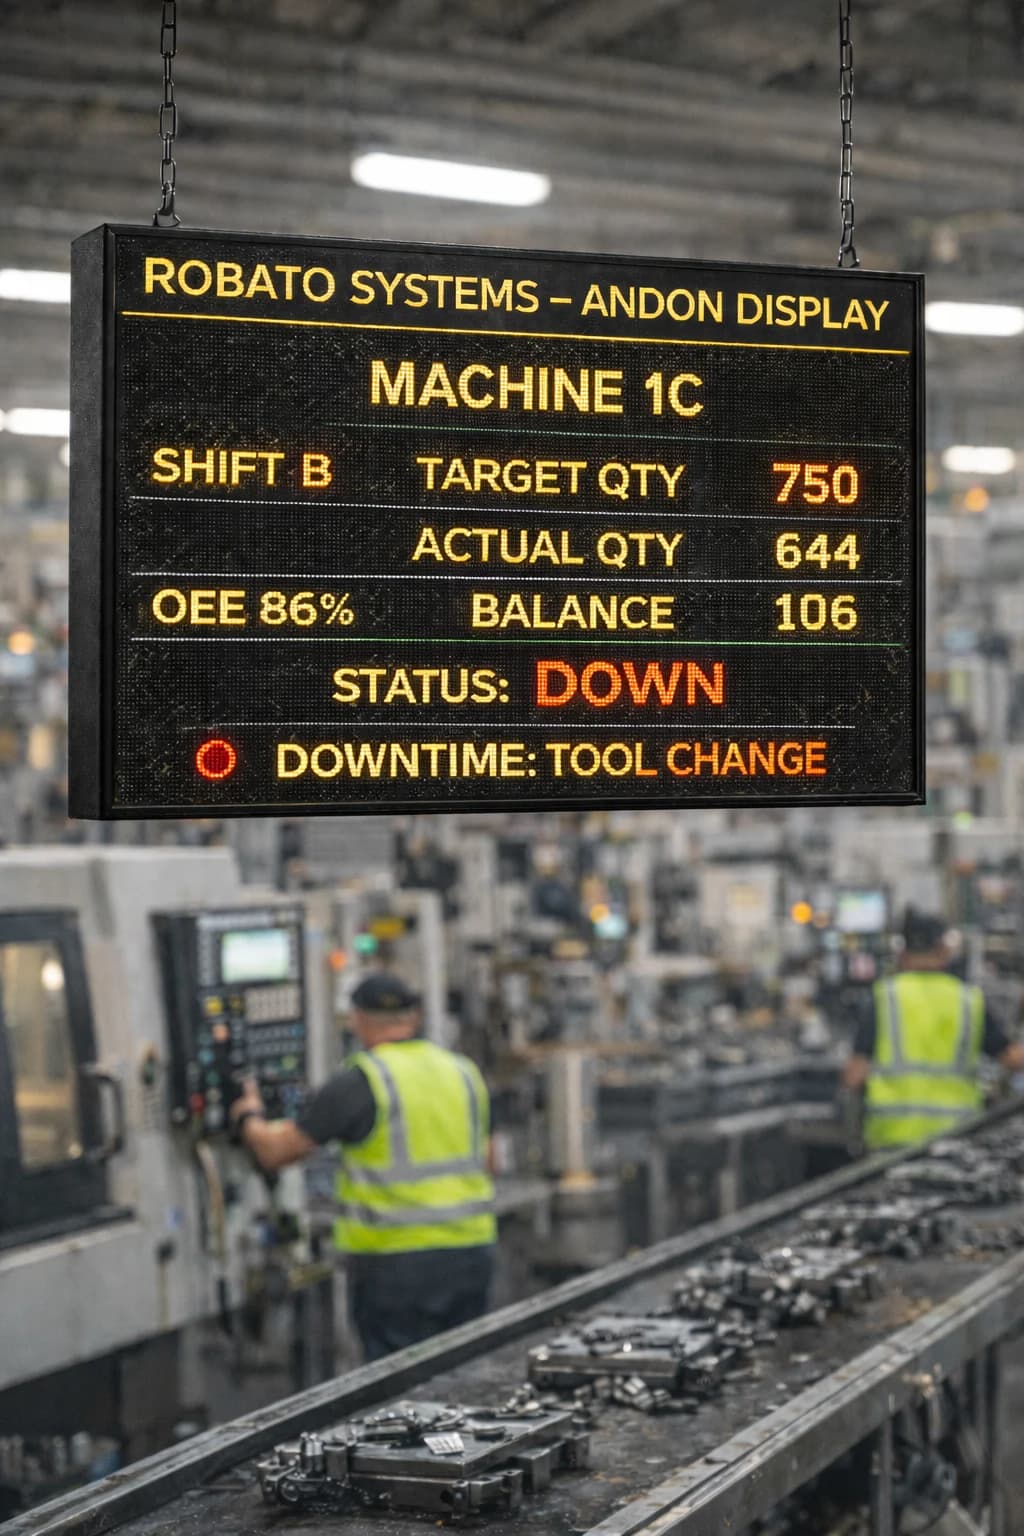
Robato Andon display hanging on chains above a machining line, showing shift, target, actual, balance, OEE and a downtime reason
Fig. 04A single board on chains over a machining line: shift, target, actual, balance, OEE and the downtime reason.
Connectivity04 / 10

Data and connectivity options

Multiple ways to connect and update your Andon board.

  • PLC integration

    Digital I/O based signals.

  • Sensor-based triggers

    IR, proximity and photoelectric sensors.

  • Wireless Andon buttons

    Over WiFi or RF.

  • Android application

    For data control and messaging.

  • Cloud or on-prem software

    For automated updates.

  • MQTT, HTTPS, WebSocket

    Communication protocols.

  • Smart TV dashboards

    Smart TV dashboard integration.

Key features05 / 10

Key features of Robato Andon display boards

Everything you need for real-time production visibility.

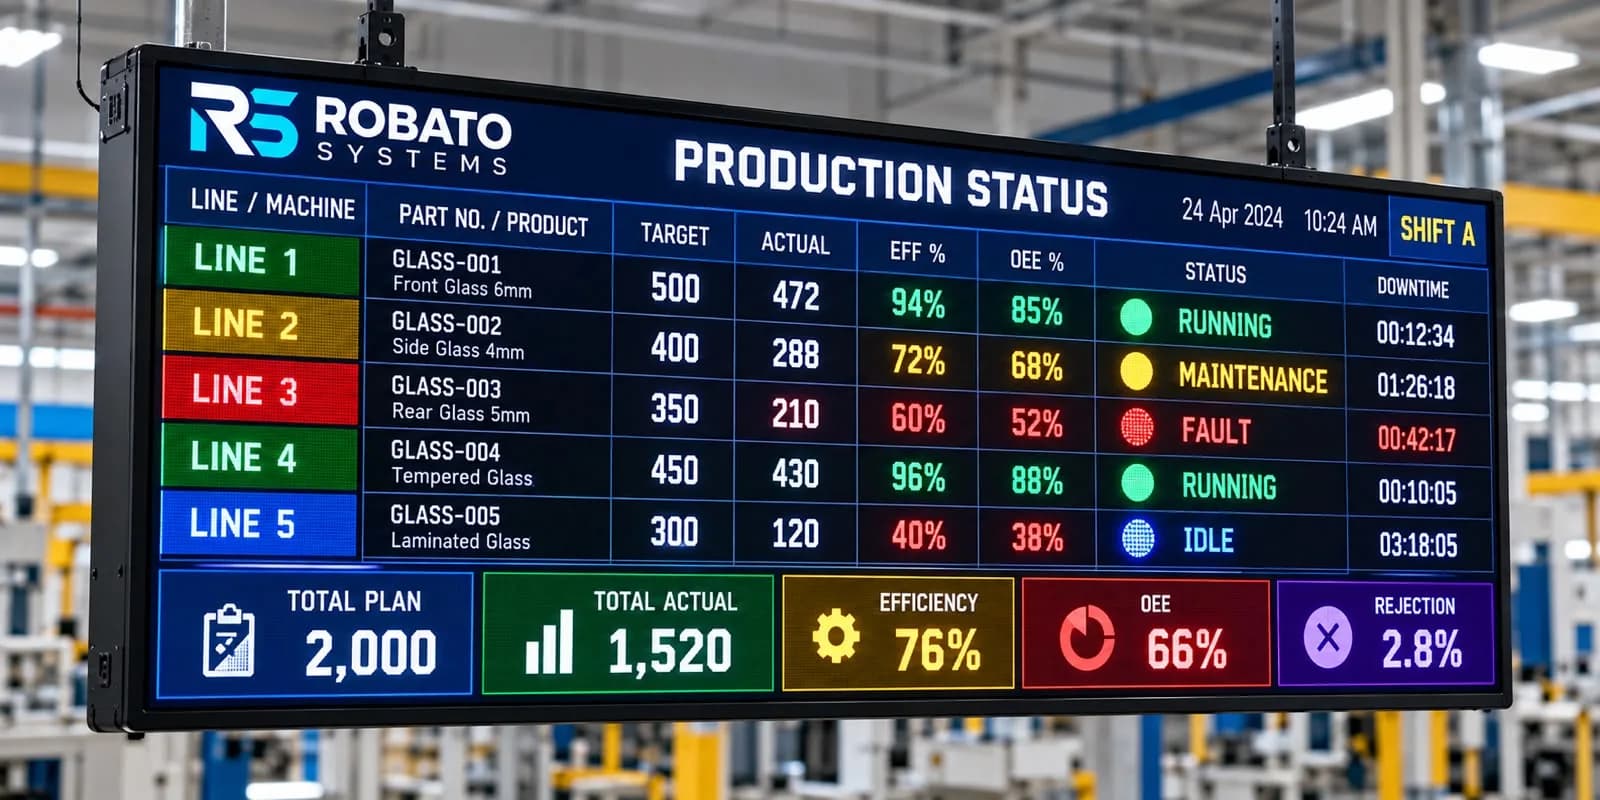
Robato production status board showing part numbers, target, actual, efficiency, OEE, status and downtime for five glass lines, with shift totals along the bottom
Fig. 05Part numbers, target, actual, efficiency, OEE, status and downtime for five lines, with the shift's totals along the foot of the board.
  • 01

    High-brightness industrial LEDs

    For long-distance visibility.

    • Industrial grade
    • Long-distance readable
    • Daylight visible
  • 02

    WiFi or Ethernet connectivity

    Flexible network options.

    • WiFi support
    • Ethernet port
    • RF wireless
  • 03

    PLC, sensor and software control

    Multiple control methods.

    • PLC integration
    • Sensor triggers
    • Software updates
  • 04

    Multi-line, multi-machine support

    Display multiple machines at once.

    • Multiple lines
    • Multi-machine view
    • Scalable layout
  • 05

    Automatic alert colour changes

    Visual status indication.

    • Colour-coded alerts
    • Status indicators
    • Priority highlighting
  • 06

    Custom messages and scrolling text

    Dynamic content display.

    • Scrolling messages
    • Custom text
    • Dynamic content
  • 07

    Downtime and OEE KPIs

    Performance metrics display.

    • OEE tracking
    • Downtime display
    • Performance KPIs
  • 08

    Smart TV alternative display

    Use TVs as Andon displays.

    • Smart TV support
    • Web dashboard
    • Multiple layouts
  • 09

    Android app configuration

    Control via mobile app.

    • Mobile control
    • Text input
    • Layout management
  • 10

    Fully customizable layout

    Tailored to your needs.

    • Custom sizes
    • Custom colours
    • Brand integration
Specifications06 / 10

Technical specifications

01LED type

Red / Amber / Green / RGB

02Connectivity

WiFi, Ethernet, RF wireless

03Board size

Custom or standard (2 ft, 4 ft, 6 ft)

Standard lengths, to scale

  • 2 ft
  • 4 ft
  • 6 ft

or custom

04Pixel pitch

P10, P8, P6, P5 depending on model

05Power

230 V AC / 12 V / 24 V DC

06Control

Android app, cloud software, PLC I/O, MQTT

07Mounting

Wall, ceiling or structure mount

Industries07 / 10

Industries using Andon display boards

  • 01

    Automotive

    Automotive OEMs and Tier-1 suppliers

  • 02

    Pharma

    Pharmaceutical and medical device manufacturers

  • 03

    Textile

    Textile, weaving, knitting and garment factories

  • 04

    Electronics

    Electronics and PCB assembly plants

  • 05

    FMCG

    FMCG, food and beverage packaging

  • 06

    Heavy engineering

    Heavy engineering, CNC and fabrication plants
FAQ09 / 10

Frequently asked questions

An LED display board that shows real-time machine status, downtime alerts, production information and operator calls.

Yes. WiFi and RF wireless updates are supported depending on the model.

Yes. Target, actual, shift performance and OEE parameters can be displayed.

Yes. PLC digital/analog signals can update the Andon board in real time.

Yes. Text, colours and board layout can be managed using Robato Android apps.

Yes. Fully custom sizes, pixel pitch and colours are available.

Yes. Downtime reason codes automatically appear when integrated with downtime monitoring.

Yes. Boards can display status of single or multiple machines.

Yes. Smart TV-based Andon dashboards are fully supported.

Yes. Outdoor high-brightness options are available.

Get started10 / 10

Make production performance visible to everyone.

Robato Systems can design the Andon display around your required viewing distance, number of production lines, data source, display parameters and connectivity requirements.

Contact us to discuss your production line and receive a customised Andon display architecture and proposal.

Call nowContact us

Digital Andon Board by Location

Explore our digital andon board solutions and local support across these locations.