Robato Systems — MachinoX Pro
Real-time alerts, issue escalation & downtime tracking
Instant visibility of shop-floor issues on every screen in the plant, for operators, supervisors and managers alike. Cloud or on-premise.
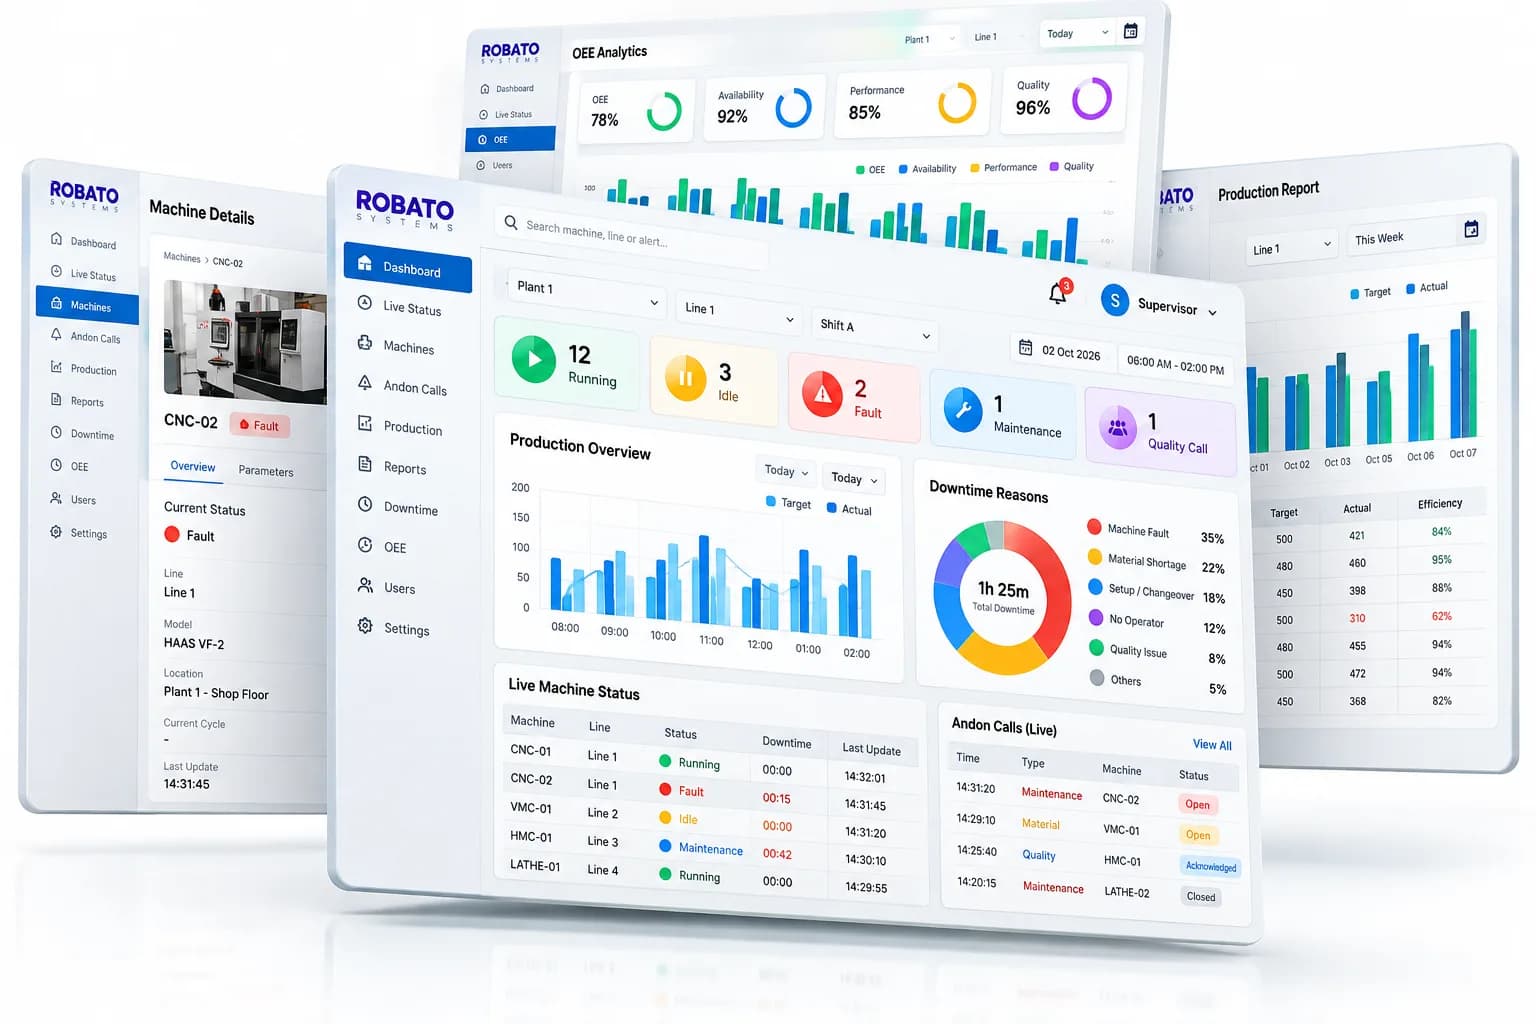
The Robato Andon Monitoring Software is a cloud and on-premise platform that provides instant visibility of shop-floor issues. It connects with Andon buttons, tower lights, LED Andon boards, production counters and PLC signals to notify supervisors the moment a problem occurs.
Connects with
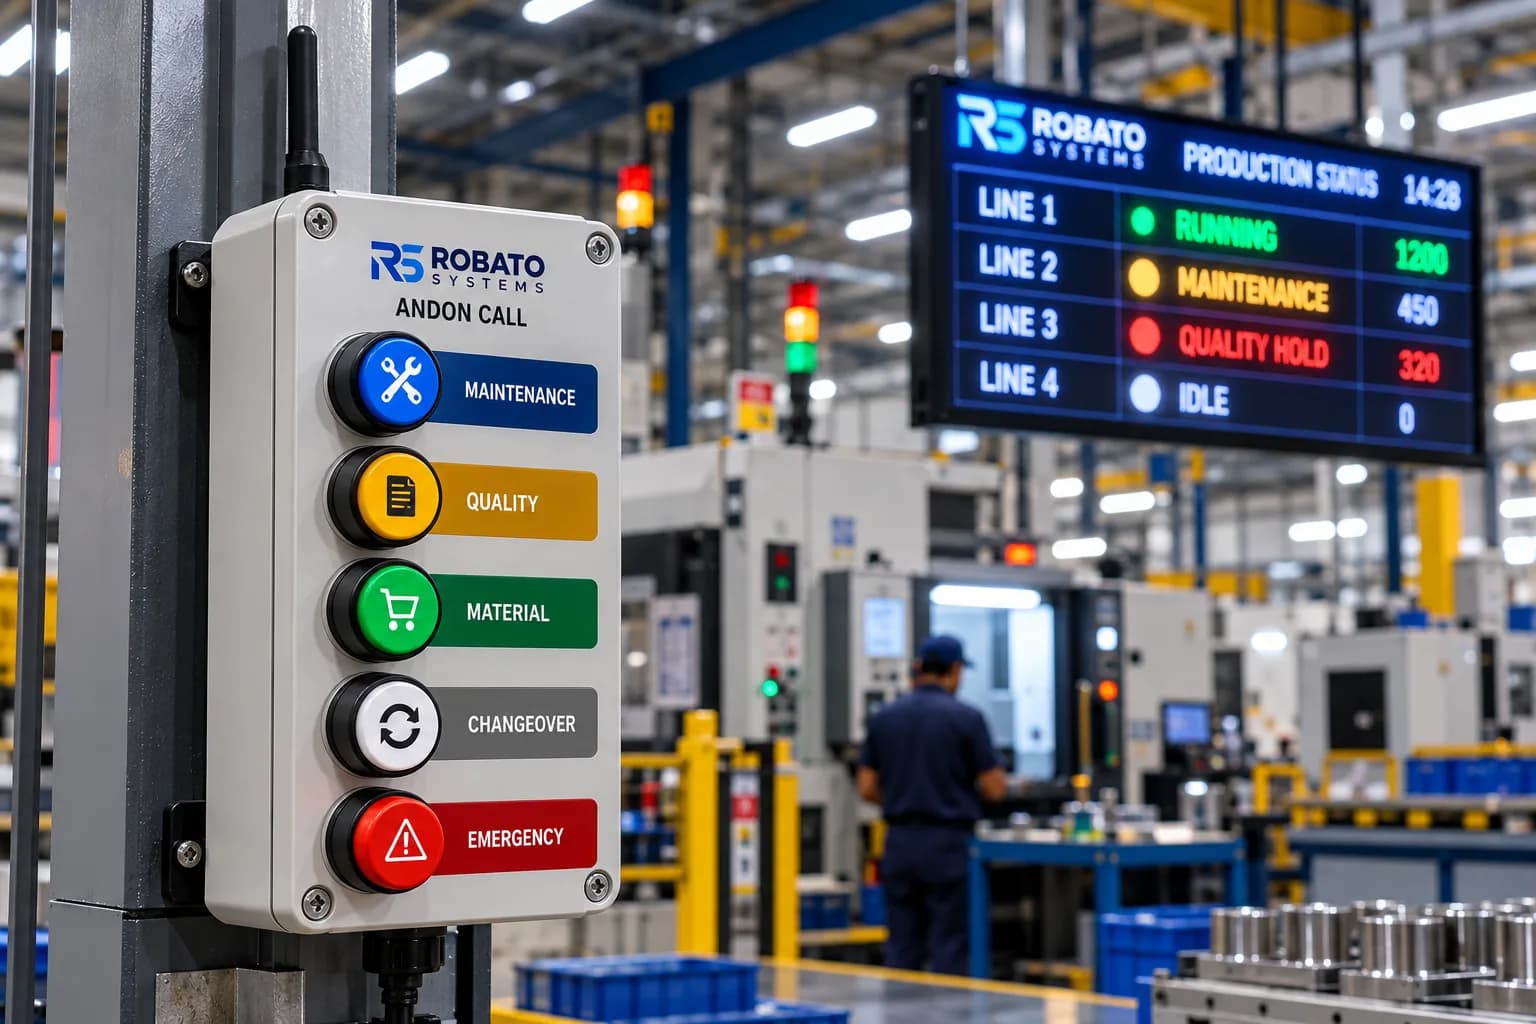
Andon buttons
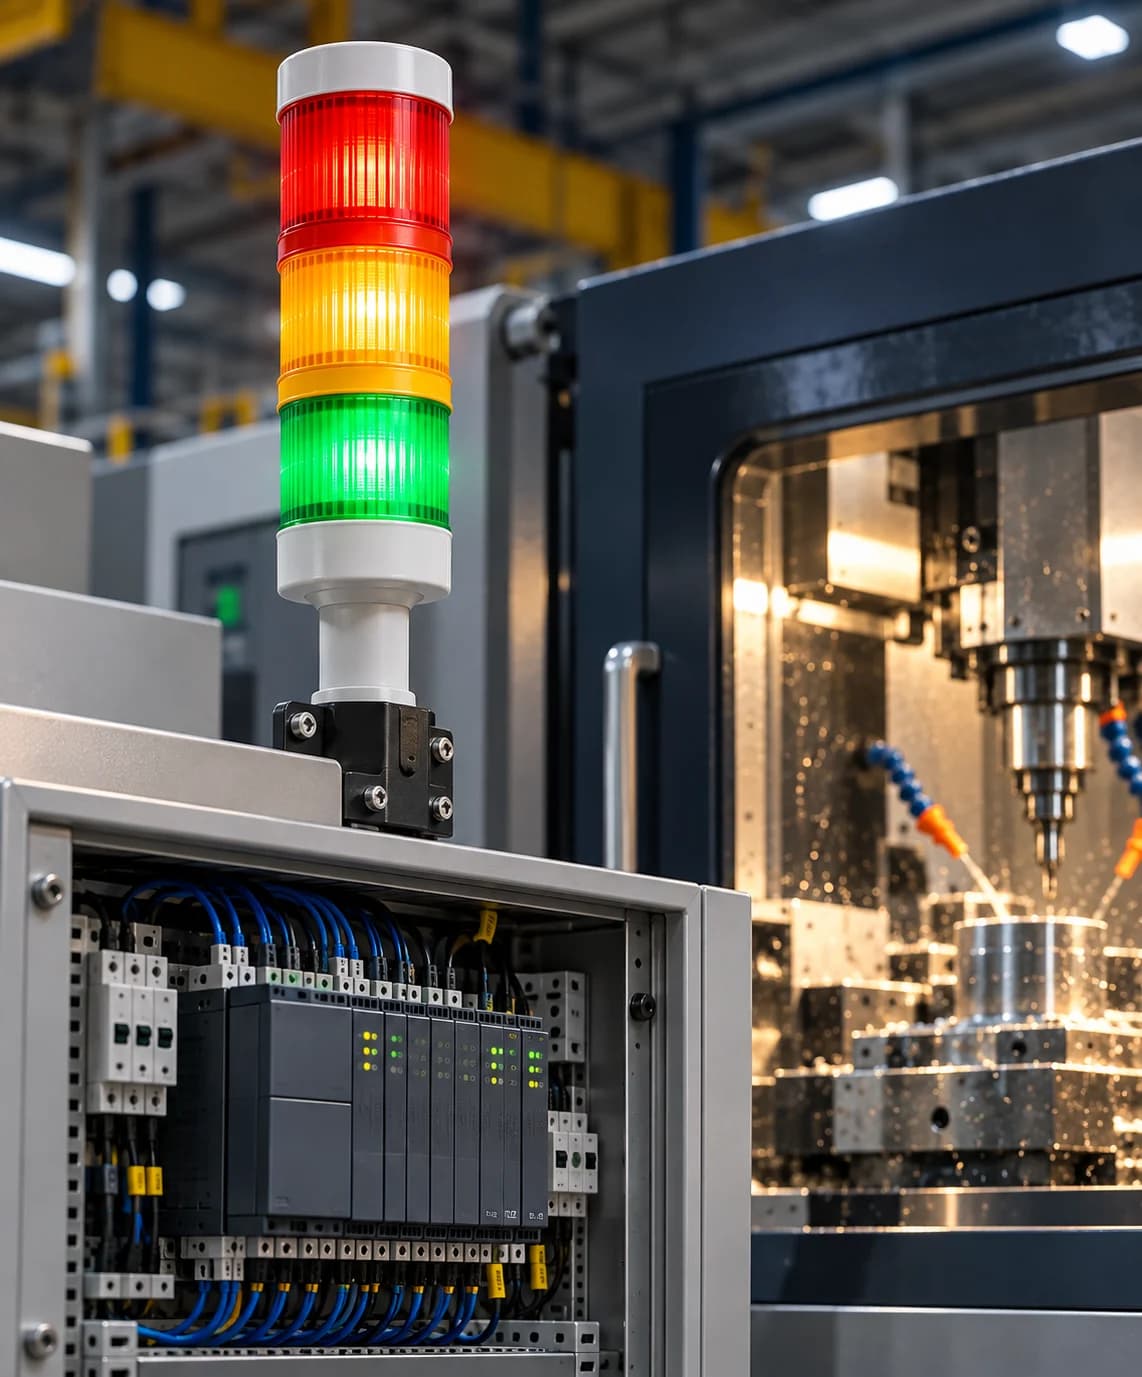
Tower lights
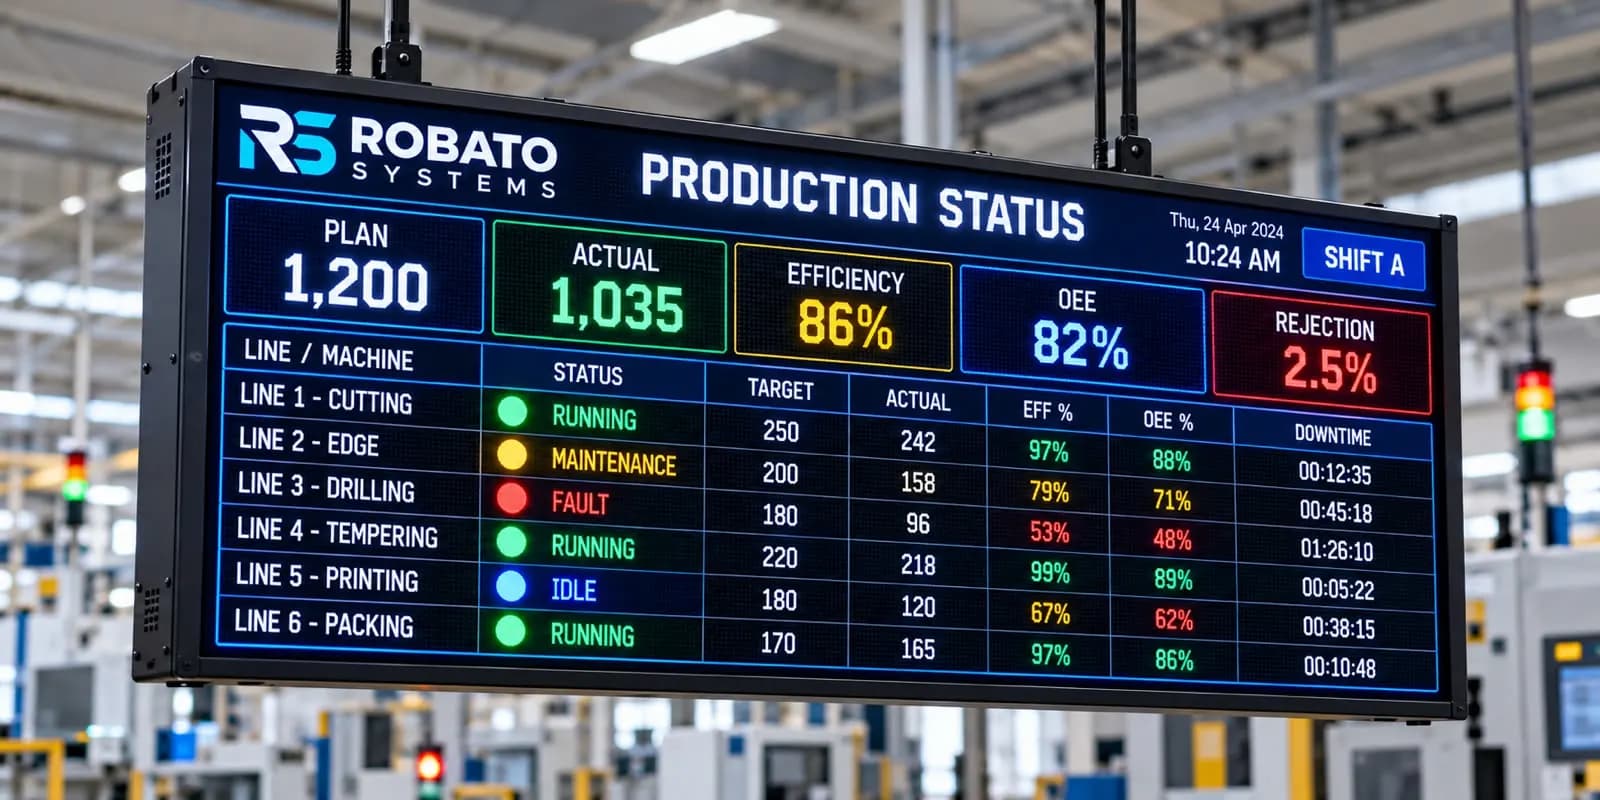
LED Andon boards
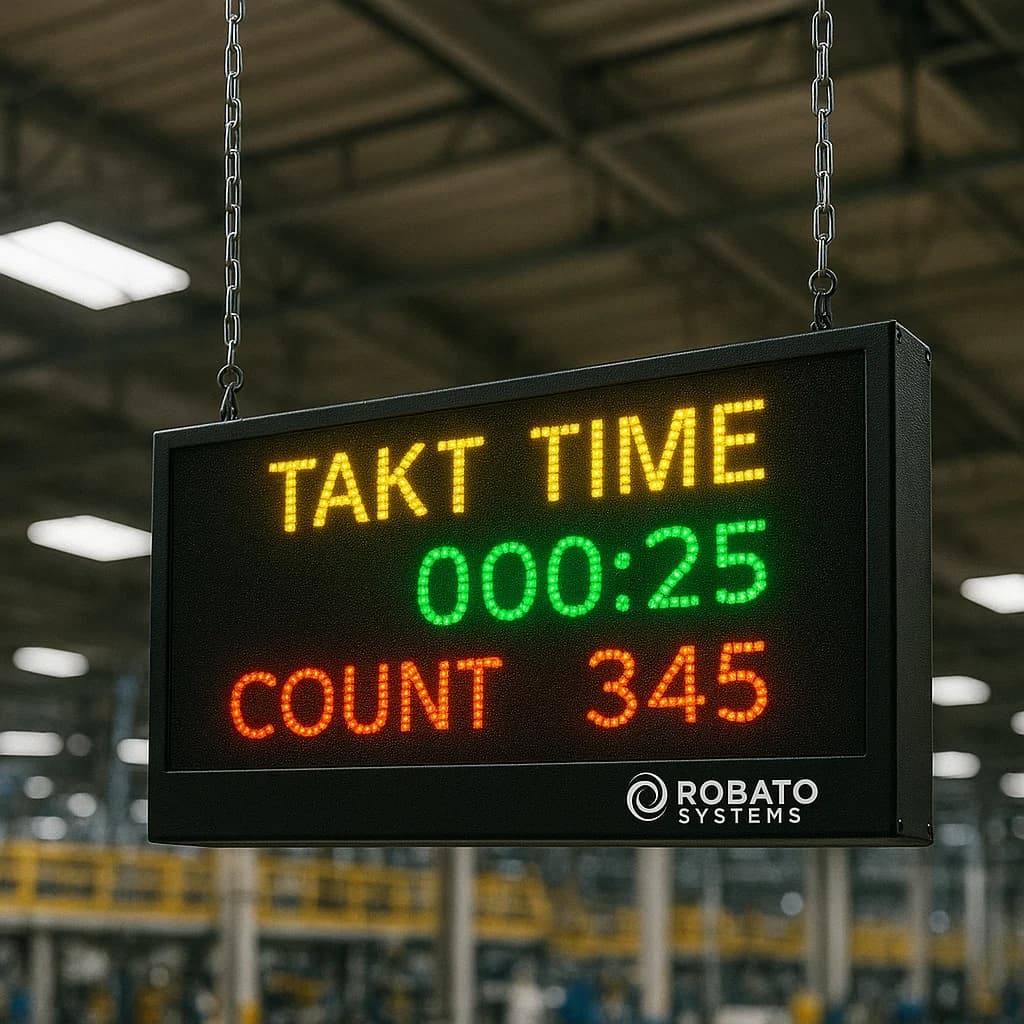
Production counters
The system is designed for factories implementing Lean Manufacturing, Jidoka and TPM. It reduces downtime, improves response time and helps supervisors act proactively.
| Time | Event | Line | Status |
|---|---|---|---|
| 10:18:04 | Machine breakdownLine 2 · VMC | Line 2 · VMC | Open |
| 10:05:31 | Changeover alertLine 5 · Paint | Line 5 · Paint | Open |
| 09:42:12 | Material shortageLine 3 · Assembly | Line 3 · Assembly | Acknowledged |
| 09:21:48 | Tool change requestLine 4 · Packing | Line 4 · Packing | Acknowledged |
| 08:56:20 | Operator help callLine 1 · CNC | Line 1 · CNC | Resolved |
| 08:31:02 | Quality issueLine 6 · Testing | Line 6 · Testing | Resolved |
System architecture, from signal trigger to KPI logging in real time. Follow one fault on Line 2 from the moment it’s raised to the moment it’s logged.
Example: Line 2 · VMC — spindle overload
Operator presses an Andon button or tower light changes state.
Signal is sent to Robato’s Andon controller or gateway.
Event reaches the Andon Monitoring Software instantly.
The system lights up Andon boards, Smart TVs, supervisor dashboards and mobile apps.
Supervisor acknowledges the problem, selects reason and resolves it.
The system logs response time, repair time and downtime KPI.
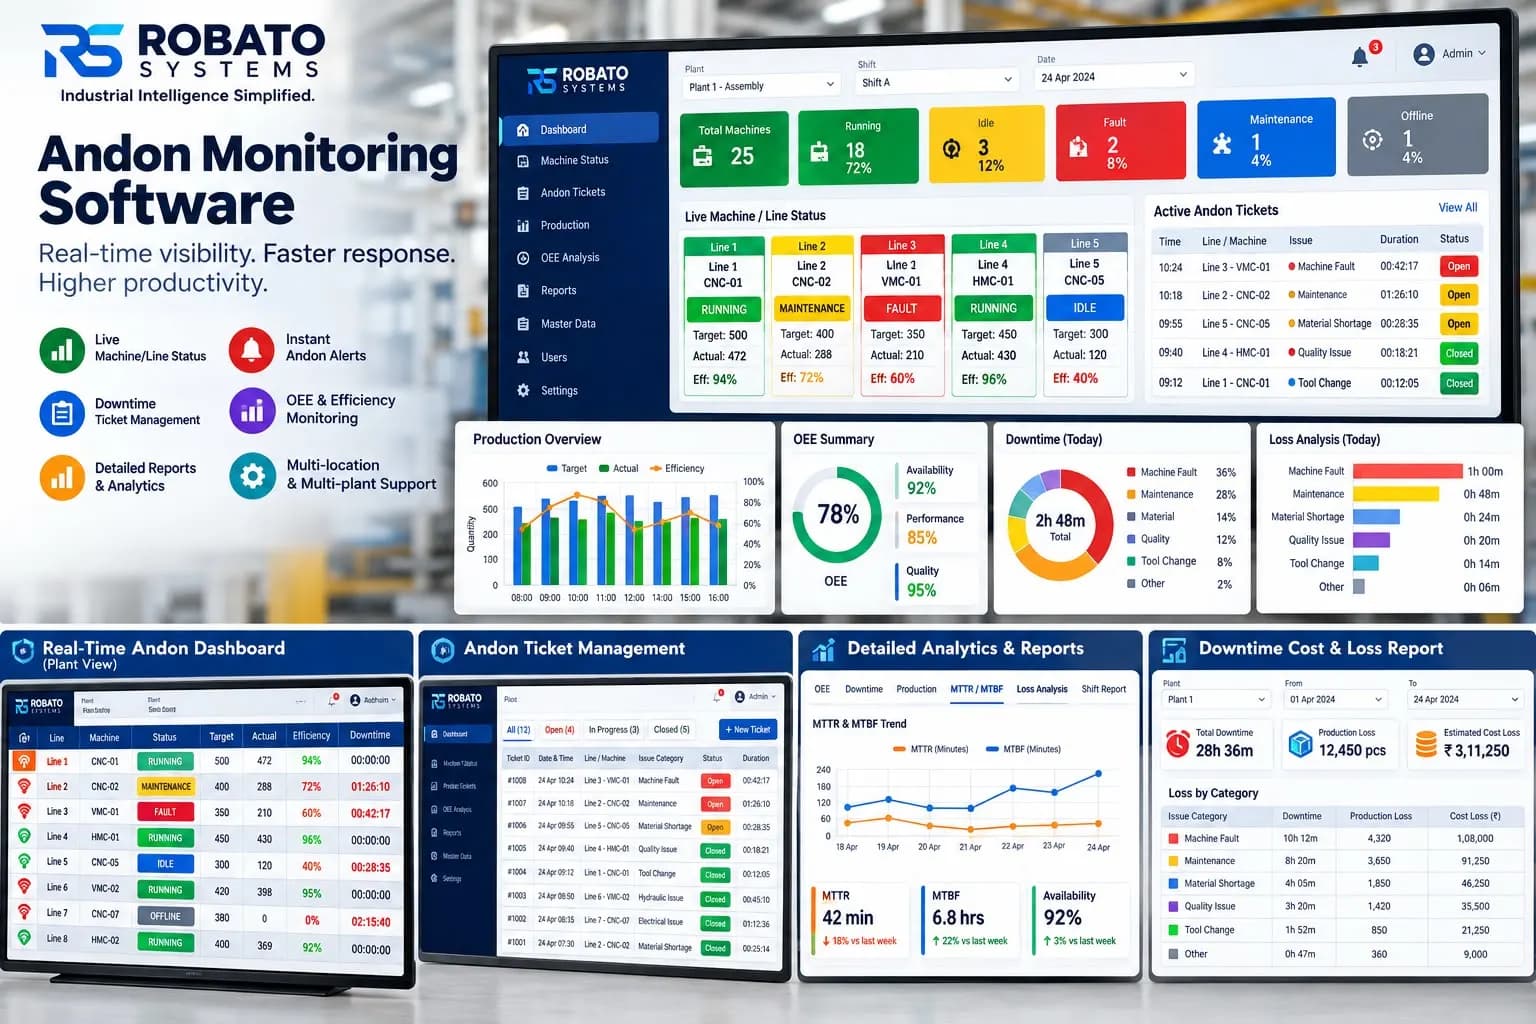
Everything you need for real-time issue tracking and escalation management.
01
Displayed across dashboards and LED boards.
02
If there’s no response from the supervisor.
03
Manually or from PLC signals.
04
To improve accountability.
05
Insights into shift-wise and operator metrics.
06
Running, idle, breakdown, waiting.
07
For assembly lines and production floors.
08
For real-time hall display.
09
Flexible deployment options for your factory.
10
For supervisors on the move.
Comprehensive real-time views for every aspect of Andon monitoring.
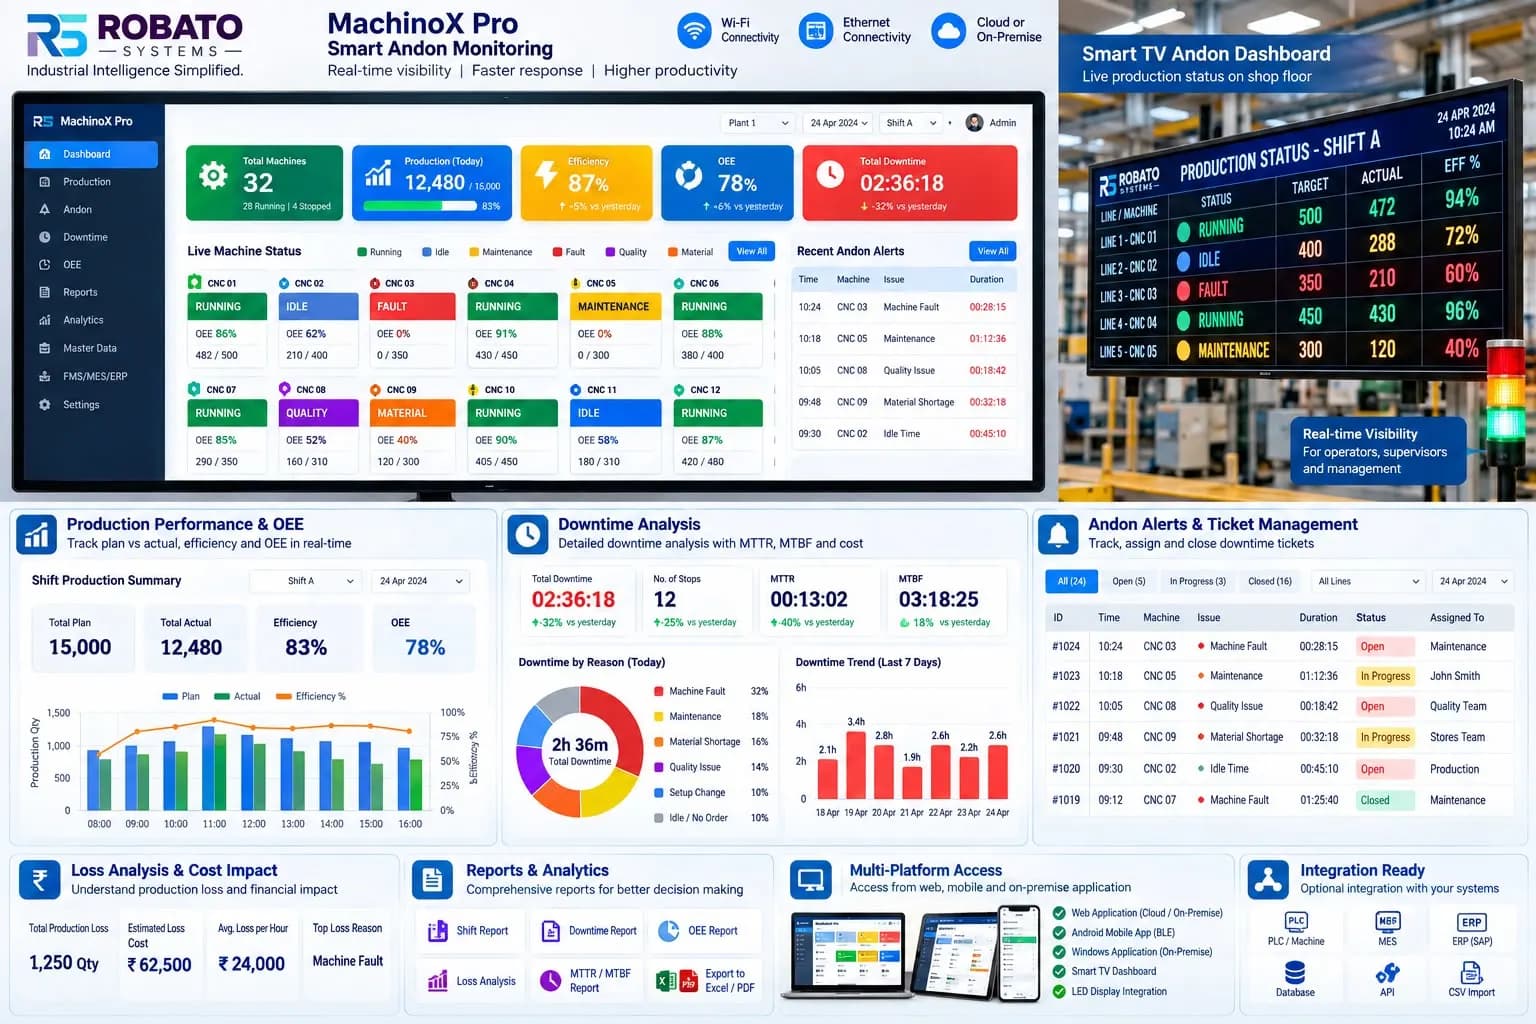
Real-time view of all active alerts across the shop floor with instant visibility.
Top downtime categories, Pareto analysis and loss tracking by machine or line.
Track response times, acknowledgement rates and supervisor performance metrics.
Compare issue frequency, resolution time and patterns across different shifts.
Monitor status of multiple machines on a single screen with colour-coded indicators.
Visual layout map showing machine locations with real-time Andon status overlay.
Full-screen dashboard optimised for large TVs in production halls and control rooms.
What the software runs on, what it listens to, and who uses it.
It provides real-time alerts for machine issues, material shortage, breakdowns and quality problems. It logs downtime, tracks response time and escalates alerts to supervisors.
Yes. It works with wired, WiFi and RF-based wireless Andon buttons and tower lights.
Yes. Live Andon dashboards can be displayed on Smart TV dashboards for full shop-floor visibility.
Both options are available. You can choose cloud SaaS or on-premise server installation.
Yes. Andon events feed into downtime analytics and OEE monitoring for complete shop-floor visibility.
The software is the part you watch. Pair it with the hardware that raises the signal and the screens that show it.
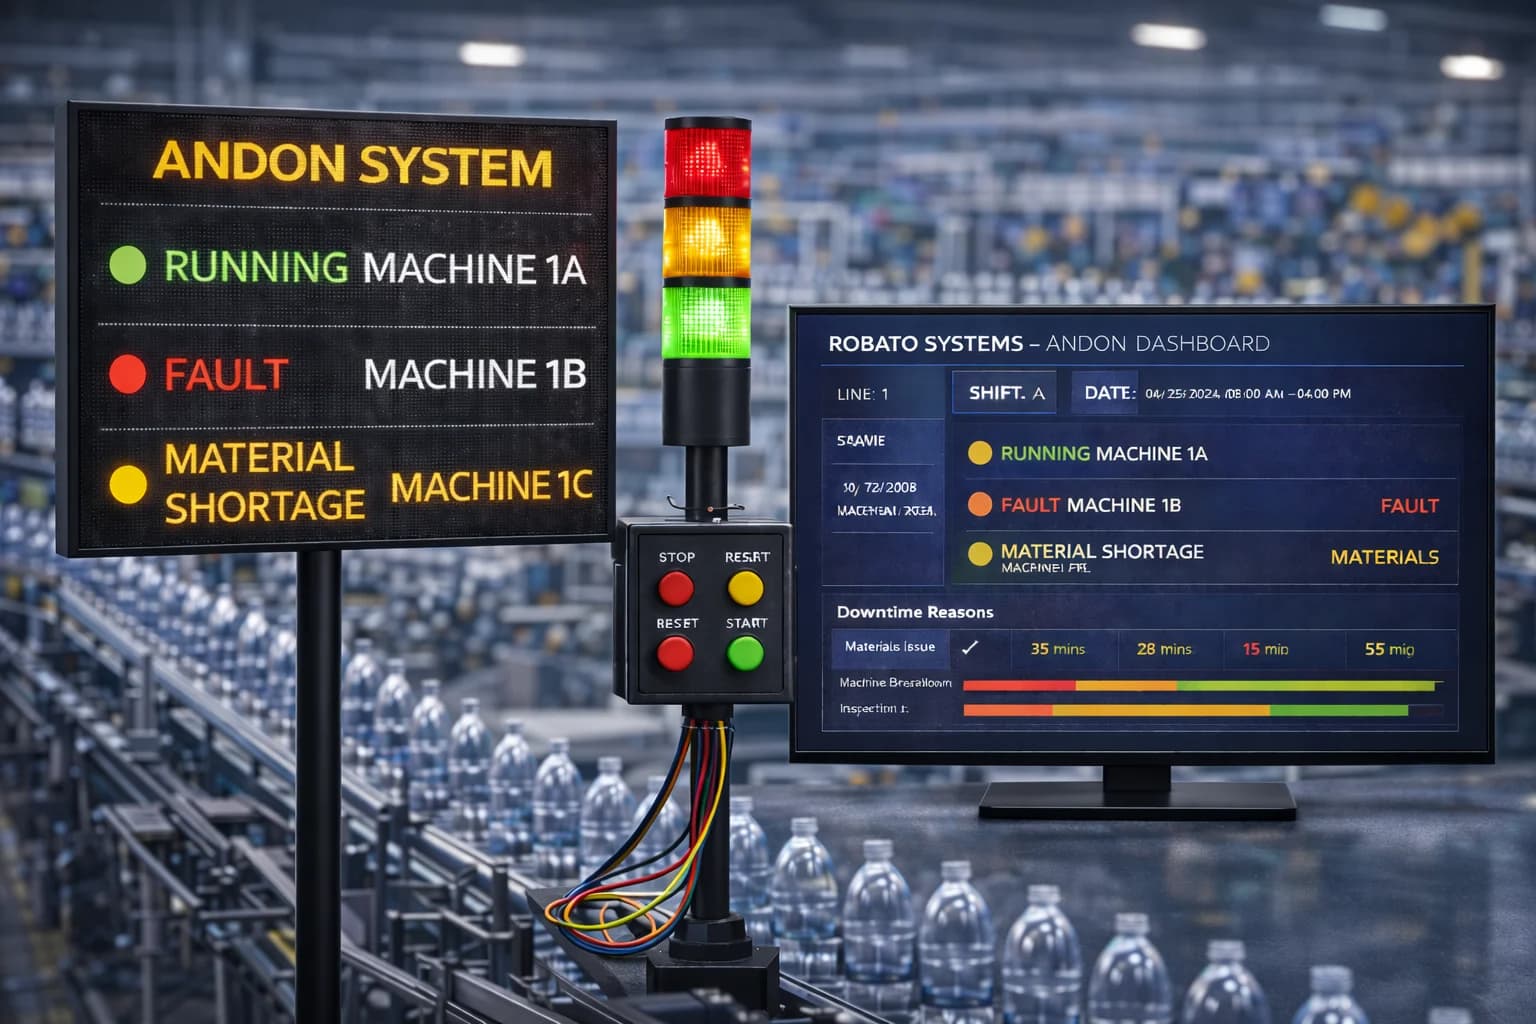 Hardware + softwareAndon SystemLED boardsAndon Board Display
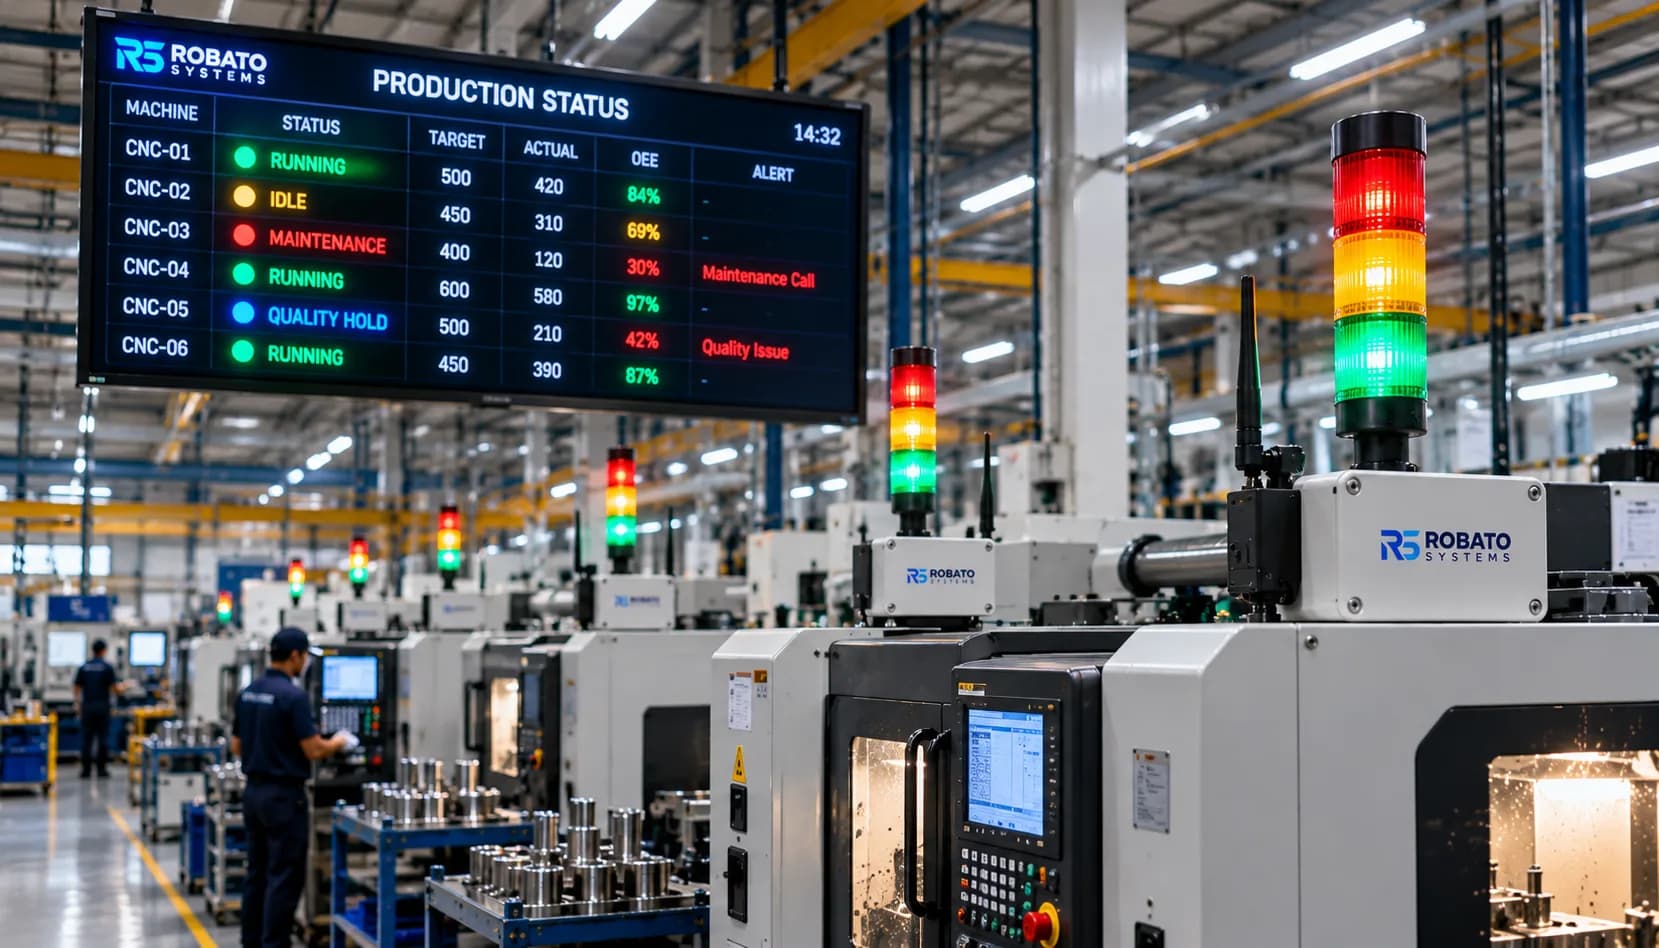 WiFi & RFWireless Andon SystemSignal towersAndon Tower Light System
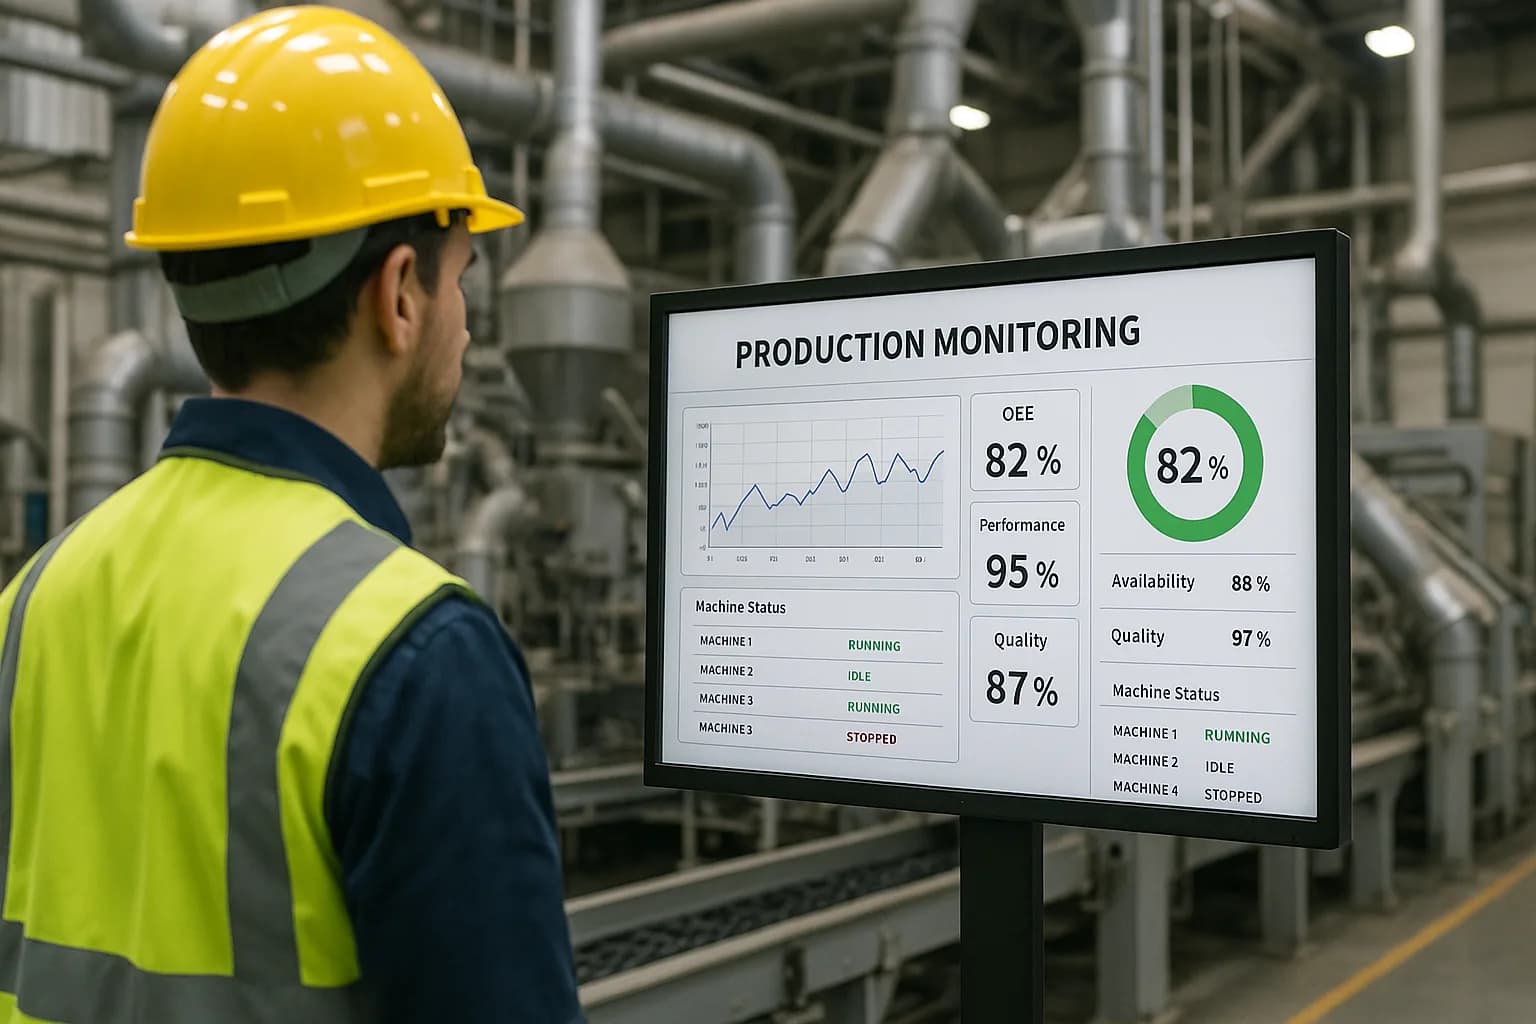 SoftwareProduction Monitoring Software
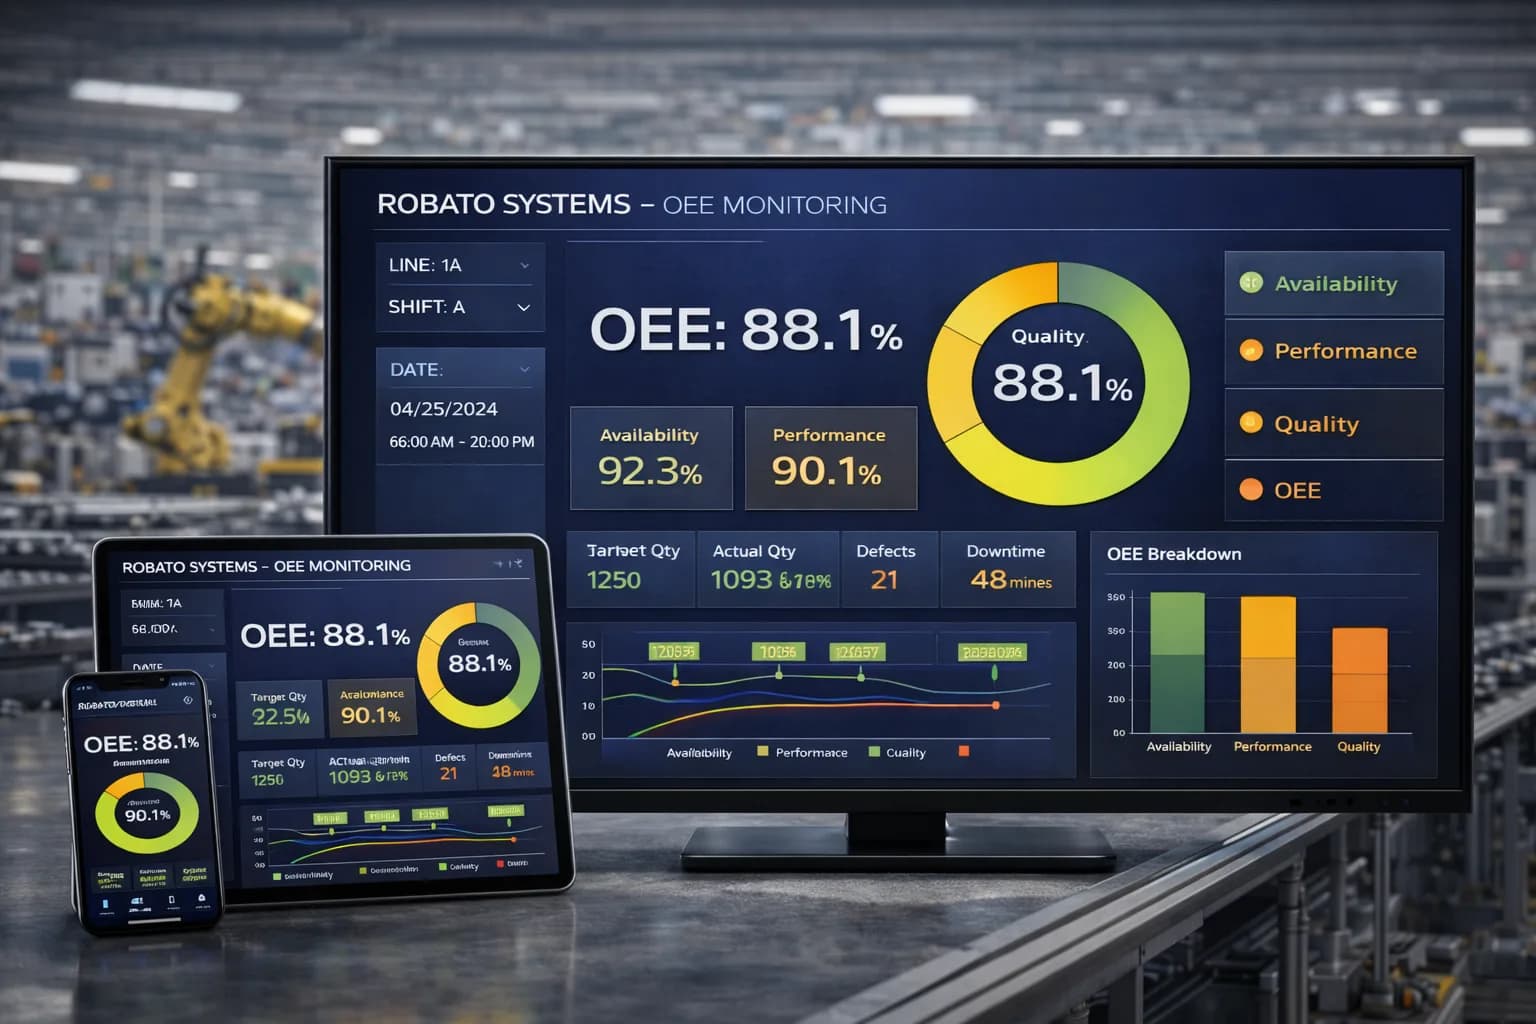 SoftwareOEE Monitoring System
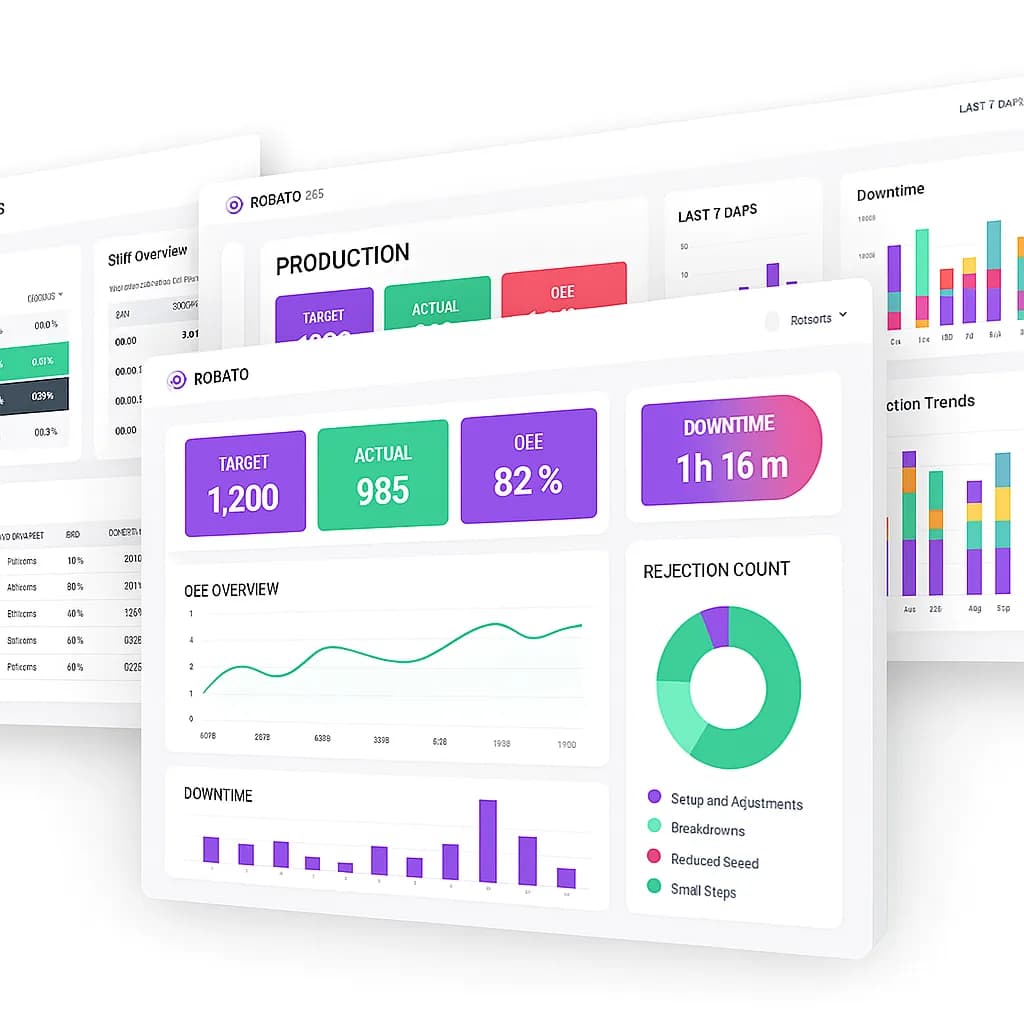 SoftwareProduction Downtime Monitoring
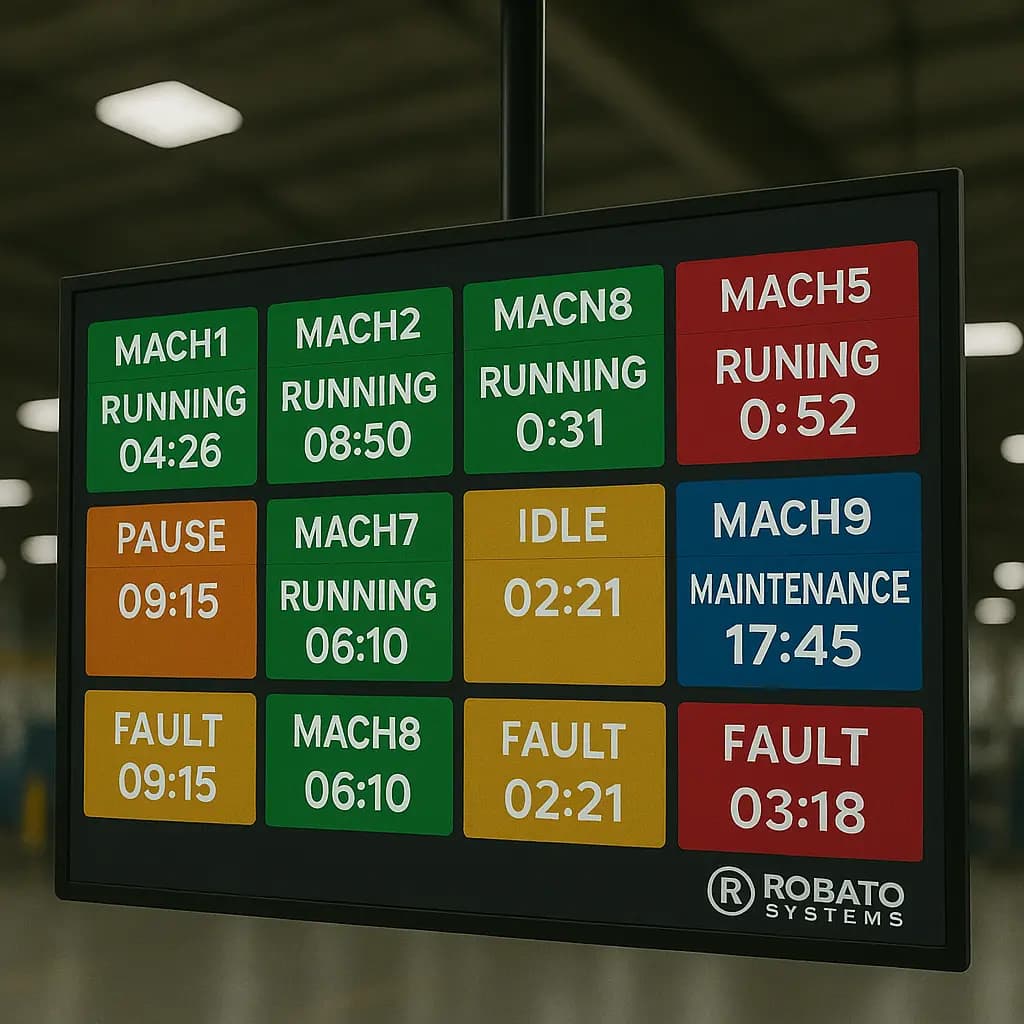 Floor dashboardsSmart TV Production Dashboard
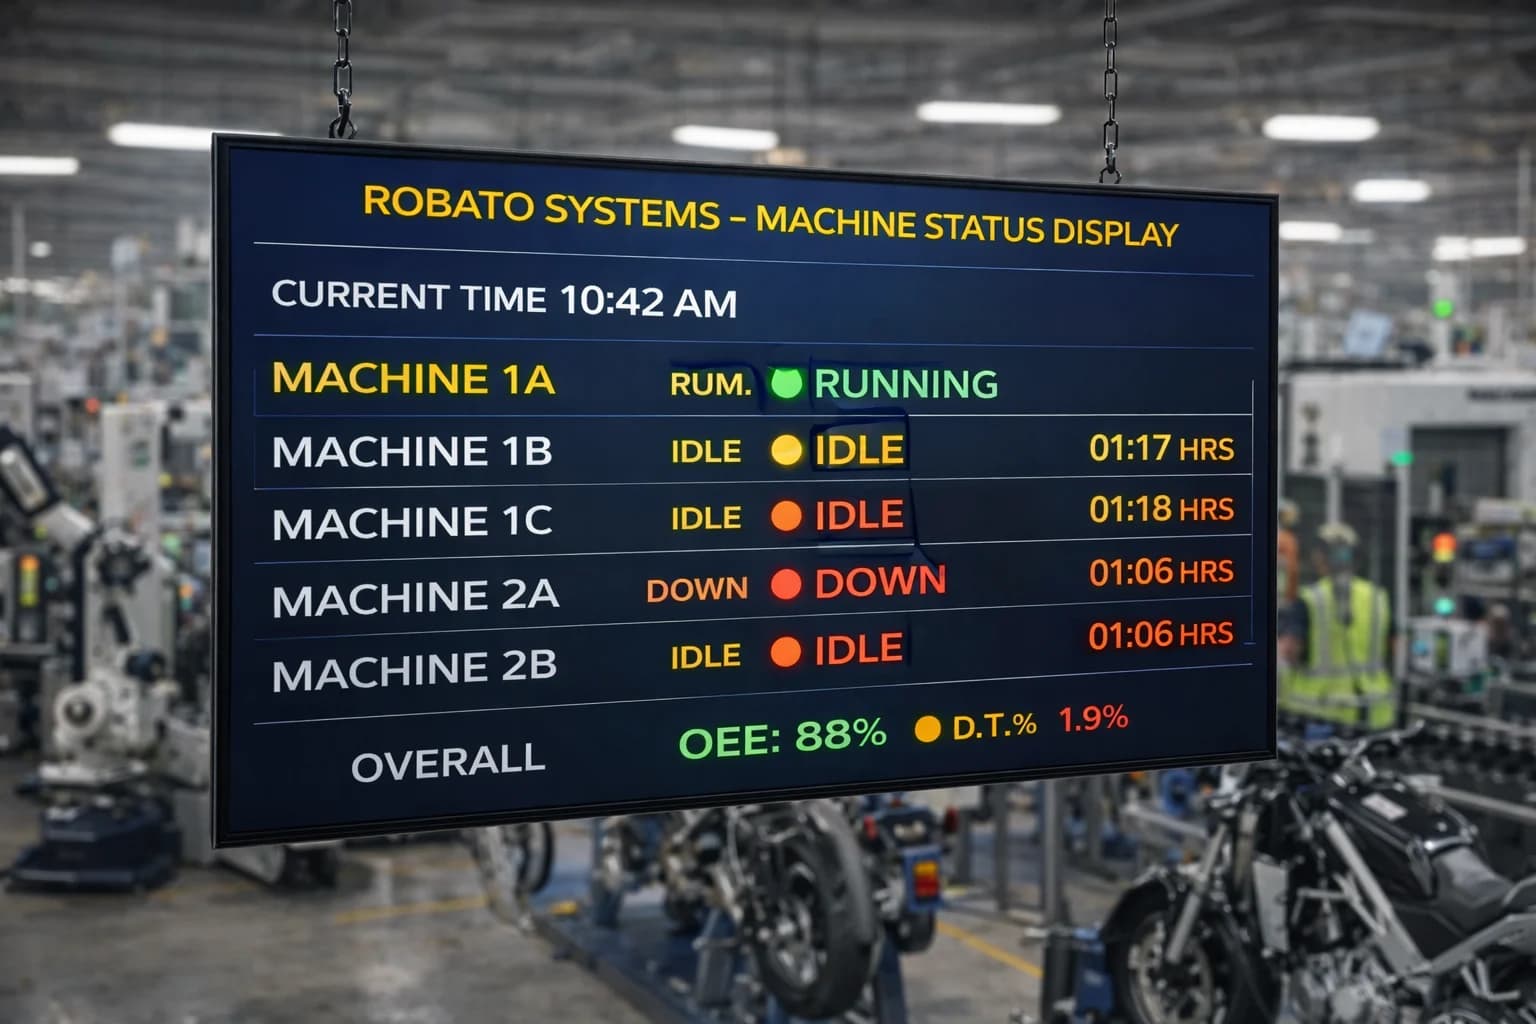 LED boardsMachine Status Display Board
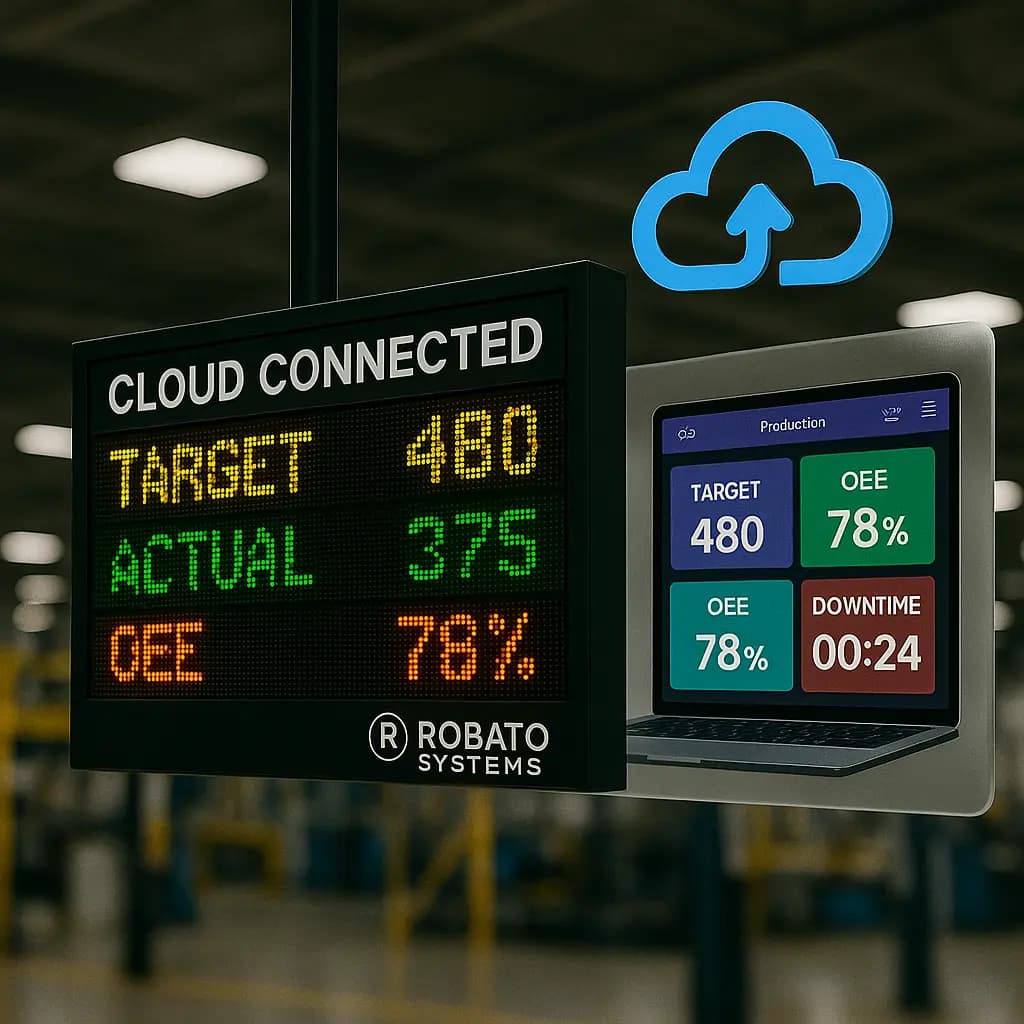 CloudProduction Monitoring Cloud
Integrate Andon hardware, OEE monitoring and cloud monitoring into one powerful shop-floor visibility platform.
Explore our smart andon system solutions and local support across these locations.
