MachinoX Pro - Production Monitoring System

Production monitoring / Downtime monitoring

Production Downtime Monitoring SystemReal-time machine downtime tracking & analysis

The Robato Production Downtime Monitoring System helps factories identify and eliminate machine stoppages, idle time, breakdowns and micro-downtime. It delivers live visibility of downtime events using LED counters, PLC signals, sensors, Andon buttons, tower lights, cloud dashboards and on-prem monitoring.
Call now
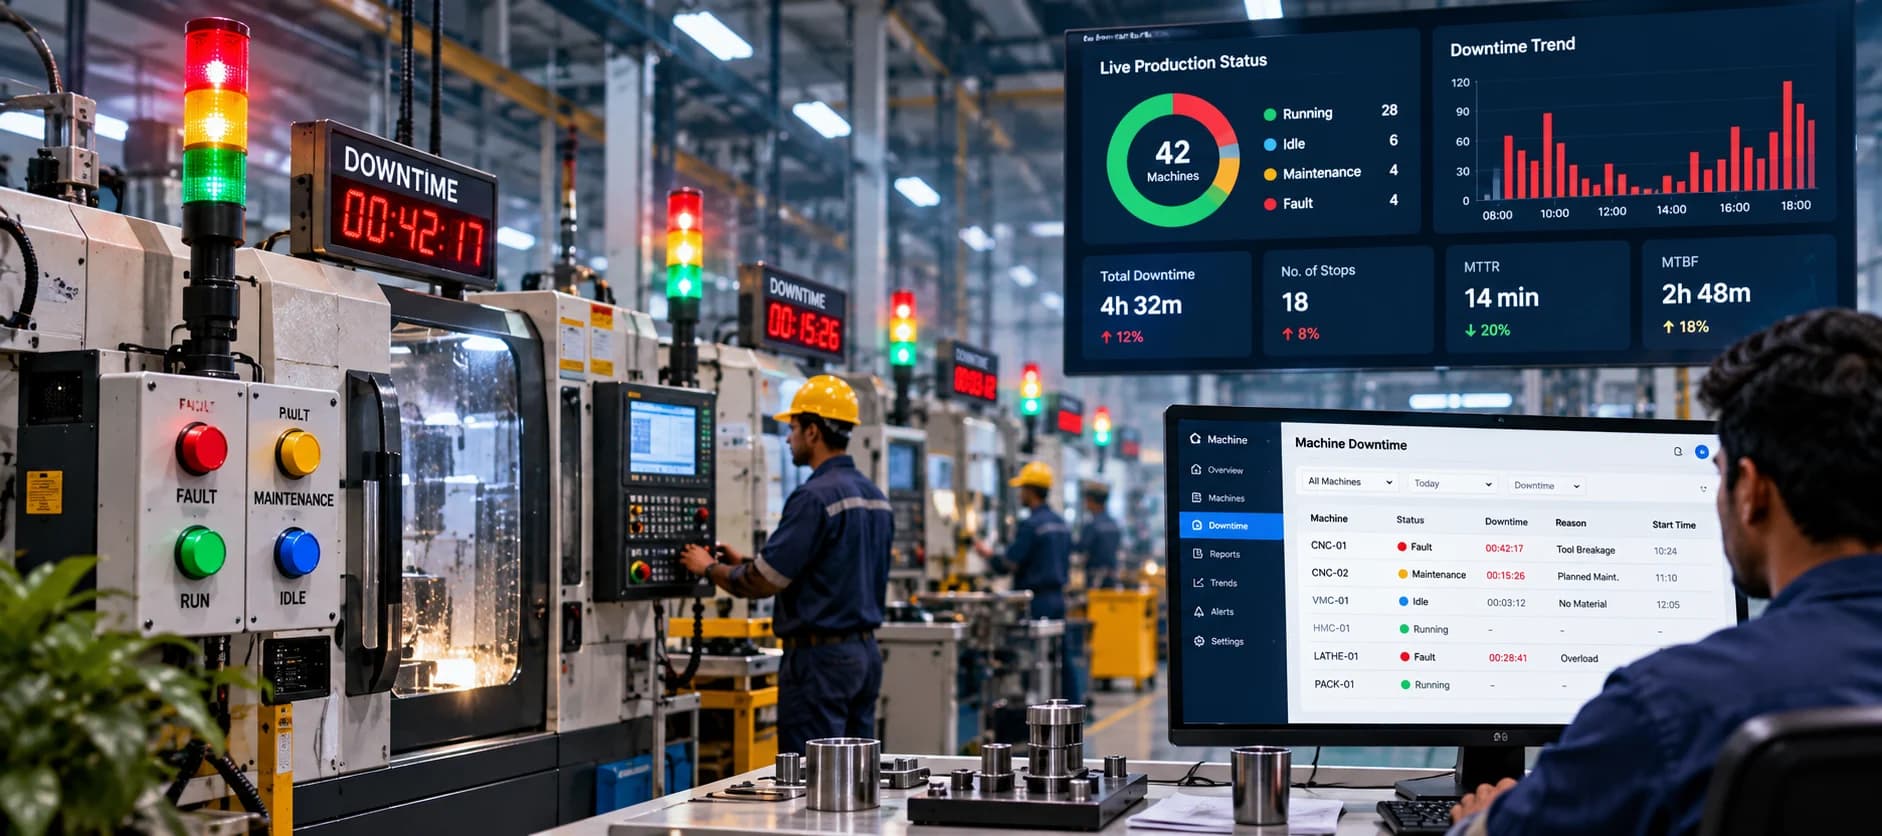
Factory downtime analytics: CNC machines with stack lights and red downtime timers on the shop floor, a wall screen showing live production status for 42 machines, a downtime trend, total downtime, number of stops, MTTR and MTBF, and a supervisor's monitor listing each machine's downtime and reason
Live status, downtime trend, MTTR and MTBF, beside the machines they measure
Downtime detection
Automatic
Deployment
Cloud or on-prem
Screens
Web, Android, Smart TV
Integrations
OEE, MES, ERP

01Why it matters

Why downtime monitoring matters Small stops, large losses

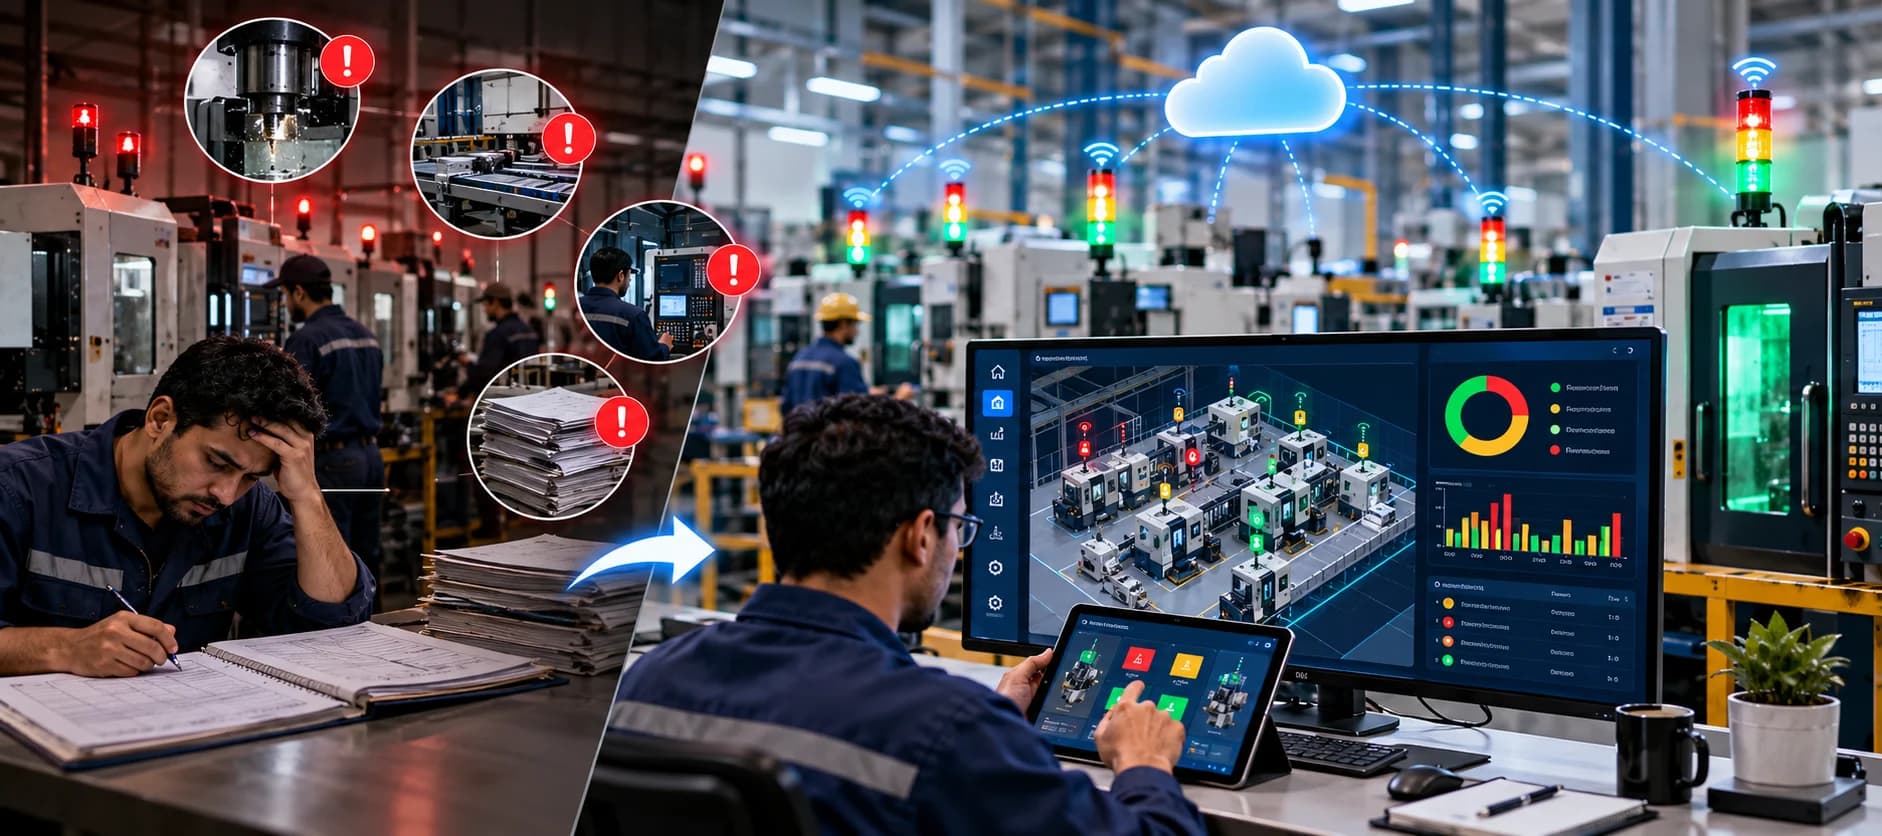
Even a small 5-minute stop repeated throughout the shift leads to massive production loss. Most factories face:

From manual chaos to a smart factory: on the left a supervisor logs stoppages by hand among stacks of paper while machine faults go unnoticed; on the right connected stack lights report to the cloud and an engineer follows every machine's live status on a dashboard and tablet
Before: stops logged by hand, faults found lateAfter: every machine's status, live
  1. 01Frequent micro-stops unnoticed by supervisors
  2. 02No real-time breakdown alerts
  3. 03Manual downtime entries in paper or Excel
  4. 04No way to measure response time
  5. 05Lack of visibility across shifts and machines

Robato's Downtime Monitoring Software solves these issues with automated detection and instant alerting.

02How it works

How the system works From detection to analytics

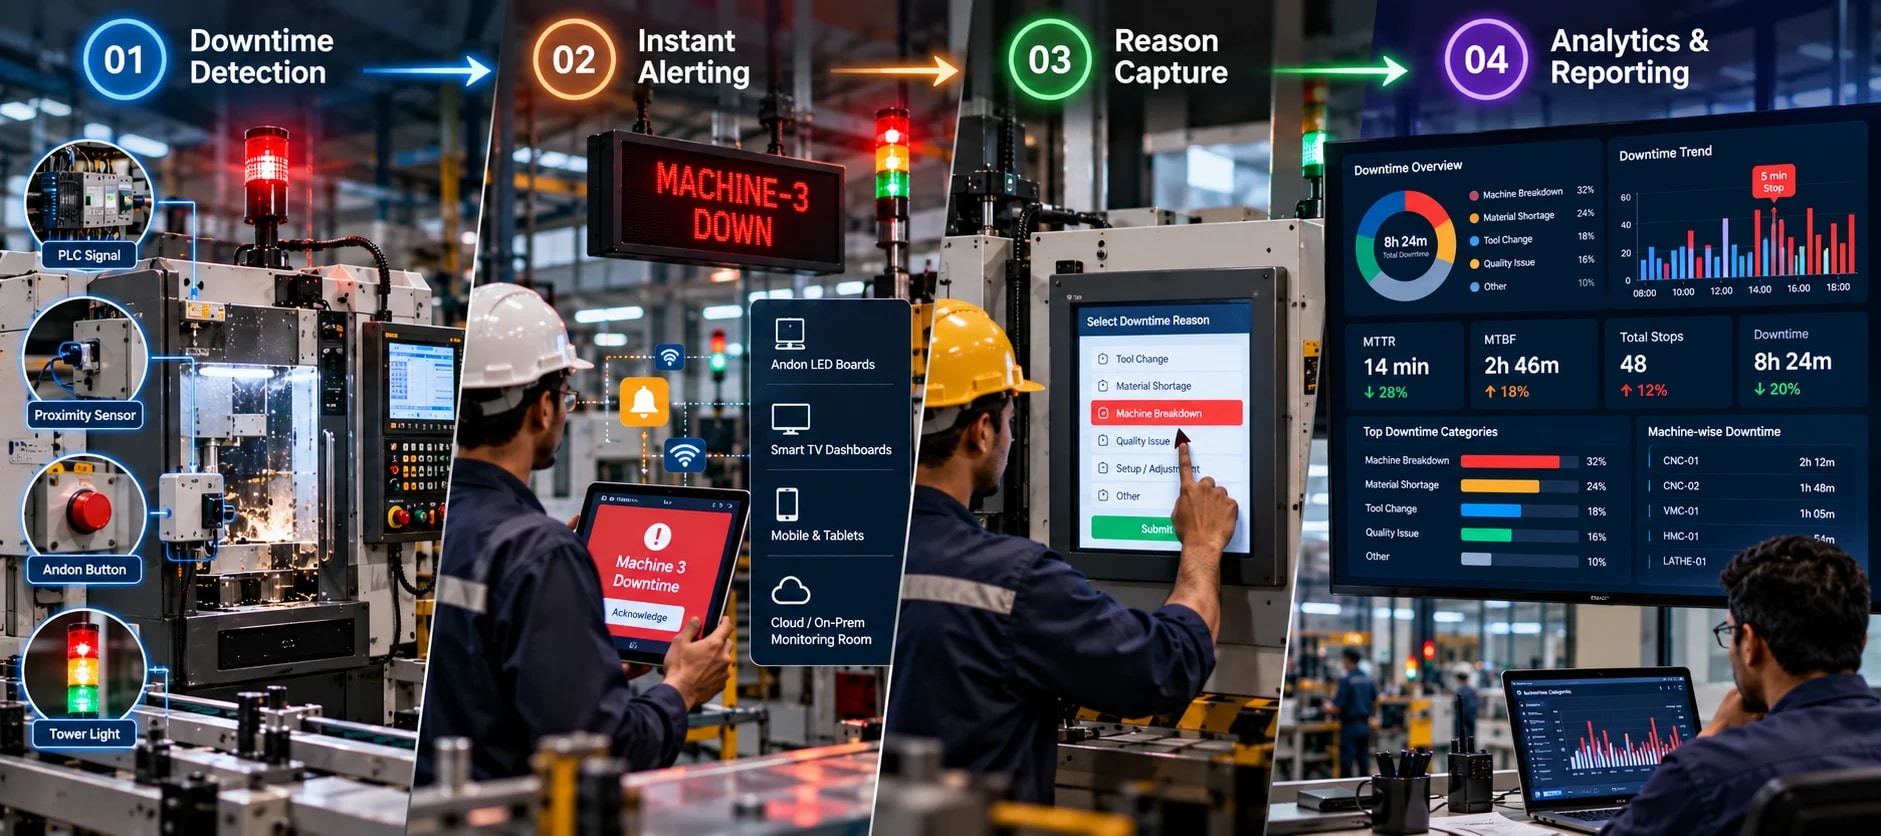
Every stoppage follows the same four steps: it is detected, the right people are alerted, the reason is recorded, and it lands in the reports.

Industrial downtime monitoring workflow in four steps: 01 downtime detection from a PLC signal, proximity sensor, Andon button and tower light on a machine; 02 instant alerting, a MACHINE-3 DOWN LED board and an operator acknowledging the alert on a tablet, sent to Andon LED boards, Smart TV dashboards, mobiles and tablets and a cloud or on-prem monitoring room; 03 reason capture, an operator selecting Machine Breakdown on a touch panel; 04 analytics and reporting, a dashboard with total downtime, MTTR, MTBF, total stops, a downtime trend, top downtime categories and machine-wise downtime
Detection, alerting, reason capture and analytics: one stoppage, from the machine to the reportOpen full size
  1. Step 01

    Downtime detection

    The system detects downtime through:

    • Smart production counters (cycle time analysis)
    • PLC digital inputs (machine running / stopped)
    • Proximity, IR and photoelectric sensors
    • Operator Andon buttons
    • Tower light signal changes
  2. Step 02

    Instant alerting

    When downtime occurs, alerts reach:

    • Andon LED boards
    • Smart TV dashboards
    • Supervisors' tablets and mobiles
    • Cloud or on-prem monitoring room
  3. Step 03

    Reason capture

    Operators enter the reason using:

    • Mobile app
    • HMI or touch panel
    • Web dashboard
    • Andon confirmation buttons
  4. Step 04

    Analytics & reporting

    The software generates:

    • Top downtime categories
    • MTTR (Mean Time To Repair)
    • MTBF (Mean Time Between Failures)
    • Shift-wise downtime
    • Machine-wise downtime
    • Line-wise pattern analysis

03Features

Key features of the downtime software

Everything you need for real-time downtime tracking and analysis.

  1. 01

    Real-time downtime detection

    Stops are detected automatically from sensors, production counters and PLC signals.

    Automatic detection · Cycle time analysis · PLC integration

  2. 02

    Live breakdown alerts

    Breakdowns show on LED Andon boards and Smart TV dashboards as they happen.

    Instant notifications · LED board display · Smart TV dashboards

  3. 03

    Micro-stop detection

    Short stops are picked up from cycle-time variation, so hidden losses are counted too.

    Pulse timing logic · Hidden loss tracking · Pattern recognition

  4. 04

    Operator downtime reason entry

    Operators record why a machine stopped from a mobile or HMI, from predefined categories.

    Mobile app entry · HMI integration · Predefined categories

  5. 05

    Supervisor response tracking

    Every response is logged with timestamps, from the alert to its acknowledgement.

    Response time logging · Acknowledgement tracking · Performance metrics

  6. 06

    Escalation workflow

    An issue left unresolved escalates tier by tier, with timeout triggers and manager alerts.

    Tiered escalation · Timeout triggers · Manager alerts

  7. 07

    Shift, line & machine dashboards

    Complete visibility: downtime by shift and by line, and every machine's status.

    Shift analytics · Line-wise view · Machine status

  8. 08

    Cloud & on-premise deployment

    Flexible options: run it as cloud SaaS, on your own server, or as a hybrid.

    Cloud SaaS · On-prem server · Hybrid setup

  9. 09

    OEE calculation integration

    Downtime feeds directly into Availability, alongside performance and quality.

    Availability tracking · Performance metrics · Quality integration

  10. 10

    API connectivity

    REST APIs connect downtime data with MES and ERP systems.

    REST APIs · MES integration · ERP connectivity

04Specifications

Technical specifications

What the system reads from, how it connects, where it runs and what it shows.

01Inputs
PLC, production counters, IR sensors, Andon buttons
02Connectivity
WiFi, Ethernet, MQTT, HTTPS
03Deployment
Cloud SaaS / On-Prem Server
04Devices supported
Web, Android App, Smart TV
05Dashboards
Machine, Line, Plant, Shift
06Integrations
OEE, Andon, Production Monitoring

05Industries

Industries using downtime monitoring

  1. 01Automotive OEM & Tier-1 suppliers
  2. 02Pharmaceutical & medical device manufacturing
  3. 03Textile weaving, knitting & garment factories
  4. 04Electronics & PCB assembly
  5. 05Food, beverage & FMCG packaging
  6. 06General engineering, CNC & fabrication

07FAQ

Frequently asked questions

It is a real-time system that tracks machine stoppages, breakdowns, idle states and micro-stops to reduce production loss.

Downtime can be detected through LED counters, PLC signals, sensors, or operator Andon calls.

Yes. Operators can enter downtime reasons using mobile app, HMI, web dashboard or Andon buttons.

Yes. Downtime values directly feed Availability calculations in OEE dashboards.

Yes. The system supports both Cloud SaaS and On-Premise deployment.

Yes. Alerts and breakdown status can be displayed on Smart TV production dashboards.

Yes. Micro-stops are detected using cycle time variation or pulse interval analysis.

Yes. REST APIs allow integration with ERP, MES and third-party systems.

Yes. Alerts can be sent instantly through mobile push notifications.

Yes. The platform supports unlimited machines, lines and plants.

08Get started

See every stoppage as it happens

Book a free trial and track downtime, its reasons and your team's response times on your own machines.

Call nowContact us

Production Downtime Tracking by Location

Explore our production downtime tracking solutions and local support across these locations.