
Top Production KPIs Every Factory Should Monitor
Modern manufacturing relies on data-driven decision-making to achieve higher efficiency, improved quality, and reduced operational costs. One of the most effective ways to measure and optimize manufacturing performance is through a Production KPI Dashboard. Key Performance Indicators (KPIs) provide valuable insights into machine utilization, production output, downtime, and overall equipment effectiveness.
By monitoring the right KPIs, manufacturers can identify bottlenecks, improve productivity, and make proactive decisions that support continuous improvement. A production KPI dashboard provides a centralized view of these metrics, allowing managers and operators to understand factory performance in real time.
This guide explores the most important production KPIs every factory should monitor and explains how a production KPI dashboard helps maximize manufacturing efficiency.
What is a Production KPI Dashboard?
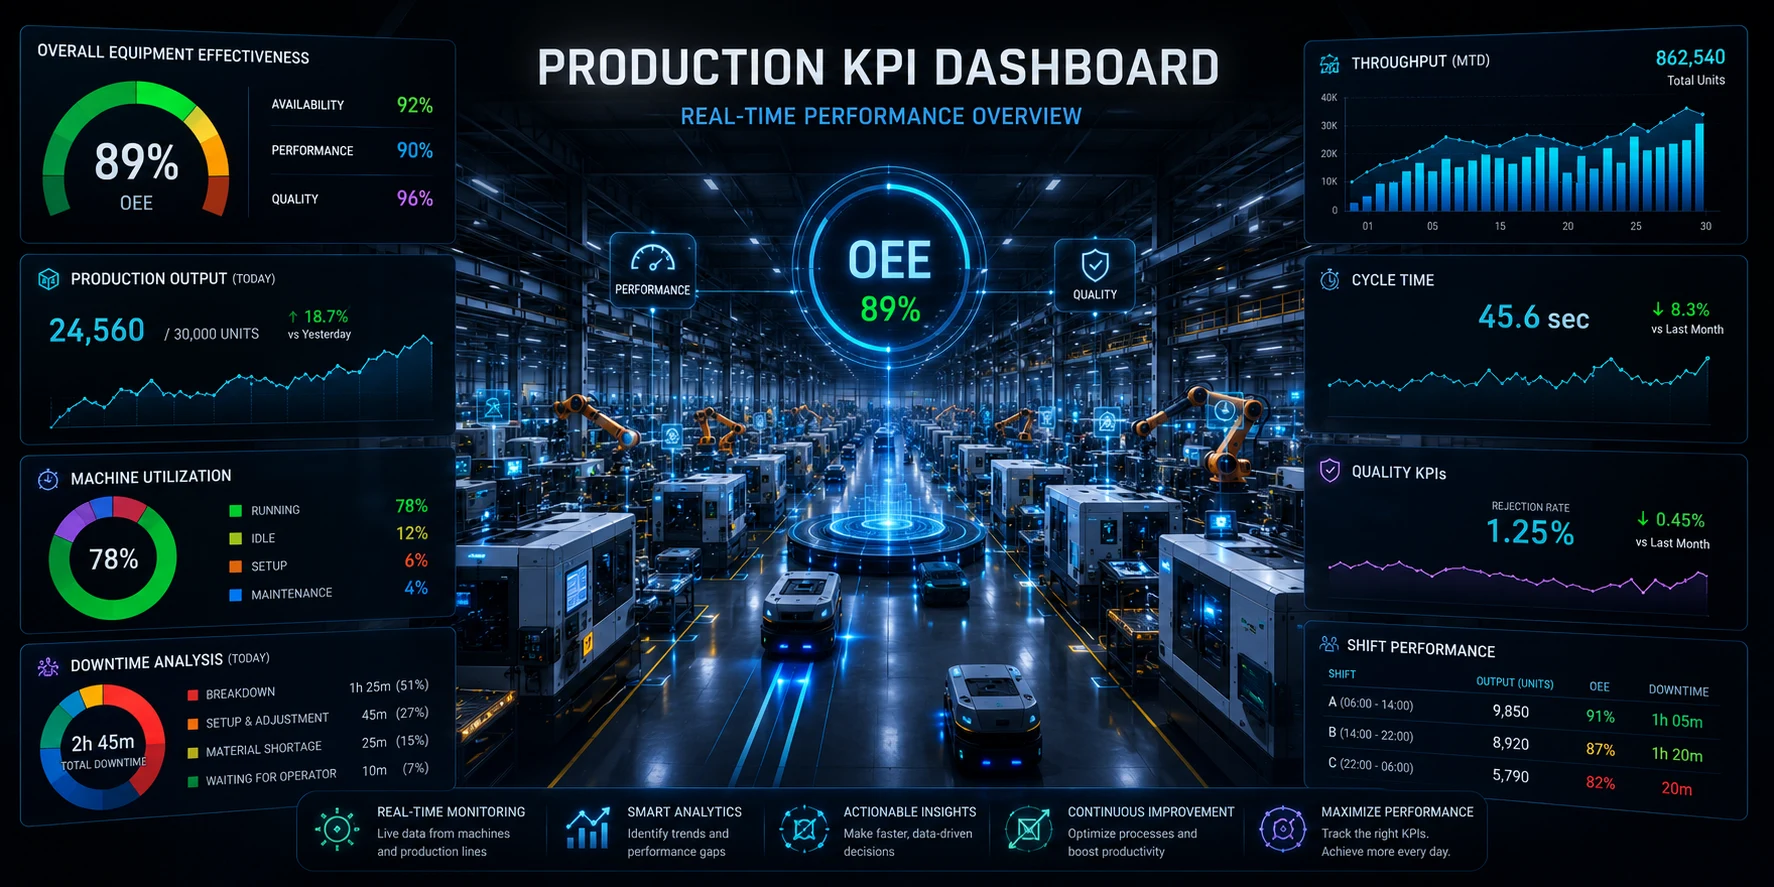
A Production KPI Dashboard is a visual platform that displays real-time manufacturing metrics and performance indicators. It gathers information from machines, sensors, PLCs, ERP systems, and production software to provide a clear overview of factory operations.
The dashboard helps manufacturers monitor:
- Production output
- Machine utilization
- Overall Equipment Effectiveness (OEE)
- Downtime events
- Cycle times
- Quality metrics
- Throughput
- Shift performance
By providing live insights, KPI dashboards support better decision-making and operational excellence.
Why Production KPIs Matter
Without measurable performance indicators, it becomes difficult to identify inefficiencies and optimize production processes.
Production KPIs help manufacturers:
- Improve productivity.
- Reduce downtime.
- Increase equipment utilization.
- Enhance product quality.
- Optimize resource allocation.
- Support continuous improvement.
- Enable data-driven decision-making.
Monitoring the right metrics ensures that production goals are aligned with business objectives.
Top Production KPIs Every Factory Should Monitor
1. Overall Equipment Effectiveness (OEE)
Overall Equipment Effectiveness is one of the most important manufacturing KPIs. It measures how effectively equipment is being utilized.
OEE consists of three components:
Availability
Measures machine uptime.
Performance
Compares actual production speed with ideal speed.
Quality
Measures defect-free production.
Monitoring OEE helps manufacturers identify production losses and improve overall efficiency.
Benefits of Tracking OEE
- Increased productivity
- Reduced downtime
- Better machine utilization
- Improved production performance
2. Production Output
Production output measures the quantity of products manufactured within a specified time.
Factories typically compare:
- Planned production
- Actual production
- Production efficiency
Monitoring output helps manufacturers ensure that production targets are achieved consistently.
Benefits
- Improved planning
- Higher throughput
- Better capacity utilization
3. Machine Utilization
Machine utilization measures how efficiently equipment is being used.
This KPI tracks:
- Running time
- Idle time
- Setup time
- Utilization percentage
Low utilization indicates inefficiencies that can negatively affect productivity.
Benefits
- Increased equipment efficiency
- Reduced idle time
- Better asset utilization
4. Downtime Percentage
Downtime percentage measures the amount of production time lost due to machine stoppages.
Causes may include:
- Equipment failures
- Material shortages
- Changeovers
- Maintenance activities
Reducing downtime directly improves productivity and profitability.
Benefits
- Lower production losses
- Faster problem resolution
- Improved machine reliability
5. Cycle Time
Cycle time represents the time required to manufacture one unit or complete one production cycle.
Monitoring cycle time helps manufacturers:
- Optimize processes
- Increase production speed
- Eliminate bottlenecks
Benefits
- Faster production
- Improved efficiency
- Reduced waste
6. Throughput
Throughput measures the amount of product produced over a specific period.
Higher throughput indicates efficient production processes and optimal machine performance.
Benefits
- Increased output
- Improved productivity
- Better resource utilization
7. Rejection Rate
The rejection rate indicates the percentage of defective products produced.
High rejection rates can lead to:
- Increased waste
- Higher costs
- Customer dissatisfaction
Monitoring quality metrics helps manufacturers maintain consistency and improve product quality.
Benefits
- Reduced defects
- Lower rework costs
- Enhanced customer satisfaction
8. First Pass Yield (FPY)
First Pass Yield measures the percentage of products that pass quality inspection without requiring rework.
A high FPY indicates:
- Efficient processes
- Better quality control
- Lower manufacturing costs
Benefits
- Reduced waste
- Improved efficiency
- Higher product quality
9. Mean Time Between Failures (MTBF)
MTBF measures the average operating time between machine failures.
Higher MTBF values indicate:
- Improved equipment reliability
- Better maintenance practices
- Reduced downtime
Benefits
- Increased machine availability
- Lower maintenance costs
- Enhanced productivity
10. Mean Time to Repair (MTTR)
MTTR measures the average time required to repair equipment after a failure.
Lower MTTR values indicate:
- Faster maintenance response
- Improved reliability
- Reduced production interruptions
Benefits
- Reduced downtime
- Faster recovery
- Improved equipment performance
11. Schedule Adherence
Schedule adherence compares actual production against planned schedules.
It helps manufacturers evaluate:
- Delivery performance
- Production efficiency
- Capacity utilization
Benefits
- Improved planning
- Better customer satisfaction
- Increased operational efficiency
12. Capacity Utilization
Capacity utilization measures how much of the available production capacity is being used.
Monitoring capacity helps organizations:
- Avoid underutilization
- Improve production planning
- Increase profitability
Benefits
- Better resource allocation
- Higher productivity
- Optimized operations
How a Production KPI Dashboard Improves Performance
Real-Time Monitoring
Manufacturers can track KPIs continuously and respond immediately to production issues.
Better Decision-Making
Data-driven insights help managers optimize production processes.
Reduced Downtime
Real-time alerts enable faster corrective actions.
Increased Productivity
Continuous KPI monitoring improves machine utilization and throughput.
Enhanced Quality Control
Monitoring quality metrics helps reduce defects and maintain consistency.
Improved Operational Visibility
Dashboards provide complete transparency across manufacturing operations.
Features of an Effective Production KPI Dashboard
A modern production KPI dashboard should include:
Real-Time Data Collection
Automatic data acquisition from machines and PLCs.
Interactive Visualization
Graphs, gauges, and trend charts for better analysis.
OEE Monitoring
Track availability, performance, and quality.
Downtime Analysis
Identify losses and recurring failures.
Shift Performance Reports
Compare productivity across shifts.
Alerts and Notifications
Receive instant notifications when abnormalities occur.
Historical Trend Analysis
Evaluate long-term production performance.
Production KPI Dashboards and Industry 4.0
Industry 4.0 depends on connected systems and intelligent analytics. KPI dashboards support digital transformation by enabling:
- Industrial IoT integration
- Smart factory monitoring
- Automated reporting
- Predictive maintenance
- Manufacturing analytics
- Data-driven operations
These capabilities help manufacturers create efficient and intelligent production environments.
Best Practices for KPI Monitoring
Focus on Relevant Metrics
Avoid tracking unnecessary data and prioritize business-critical KPIs.
Automate Data Collection
Reduce errors and improve reporting accuracy.
Use Visual Dashboards
Simplify performance analysis and improve decision-making.
Review KPIs Regularly
Continuous monitoring supports ongoing improvement initiatives.
Encourage Cross-Department Collaboration
Share KPI insights with production, maintenance, and quality teams.
Future Trends in Production KPI Dashboards
Modern dashboards are evolving with technologies such as:
Artificial Intelligence
AI-powered analytics provide predictive insights.
Cloud Monitoring
Remote access to KPI dashboards from anywhere.
Digital Twins
Virtual factory simulations improve process optimization.
Edge Computing
Real-time processing enhances responsiveness.
Predictive Analytics
Forecast production trends and machine failures.
These technologies are making manufacturing operations smarter and more efficient.
Conclusion
A Production KPI Dashboard is a powerful tool for measuring and improving manufacturing performance. By monitoring critical KPIs such as OEE, machine utilization, throughput, cycle time, and downtime, manufacturers can optimize operations and achieve higher productivity.
As Industry 4.0 and smart manufacturing continue to evolve, KPI dashboards will play an increasingly important role in enabling data-driven decision-making and operational excellence.
Organizations that continuously monitor and improve their production KPIs gain a significant competitive advantage in today's manufacturing landscape.
Frequently Asked Questions (FAQs)
What is a production KPI dashboard?
A production KPI dashboard is a visual interface that displays key manufacturing metrics and performance indicators in real time.
Which production KPIs are most important?
Important KPIs include OEE, production output, machine utilization, downtime percentage, throughput, cycle time, and rejection rate.
Why are production KPIs important?
They help manufacturers measure performance, improve efficiency, reduce downtime, and support continuous improvement.
How do KPI dashboards support Industry 4.0?
They provide real-time visibility, manufacturing analytics, and data-driven insights for smart factory operations.
Can KPI dashboards integrate with ERP and MES systems?
Yes. Modern KPI dashboards can integrate with ERP, MES, SCADA, and Industrial IoT platforms.