CNC Dashboard Best Practices: A Complete Guide to Real-Time Machine Monitoring
Manufacturing facilities often operate multiple CNC machines across different production lines, shifts, and departments. Each machine generates valuable information about its operating condition, production output, cycle time, alarms, and performance. However, when this information is scattered across individual controllers, spreadsheets, and manual reports, production teams can struggle to understand what is happening across the factory.
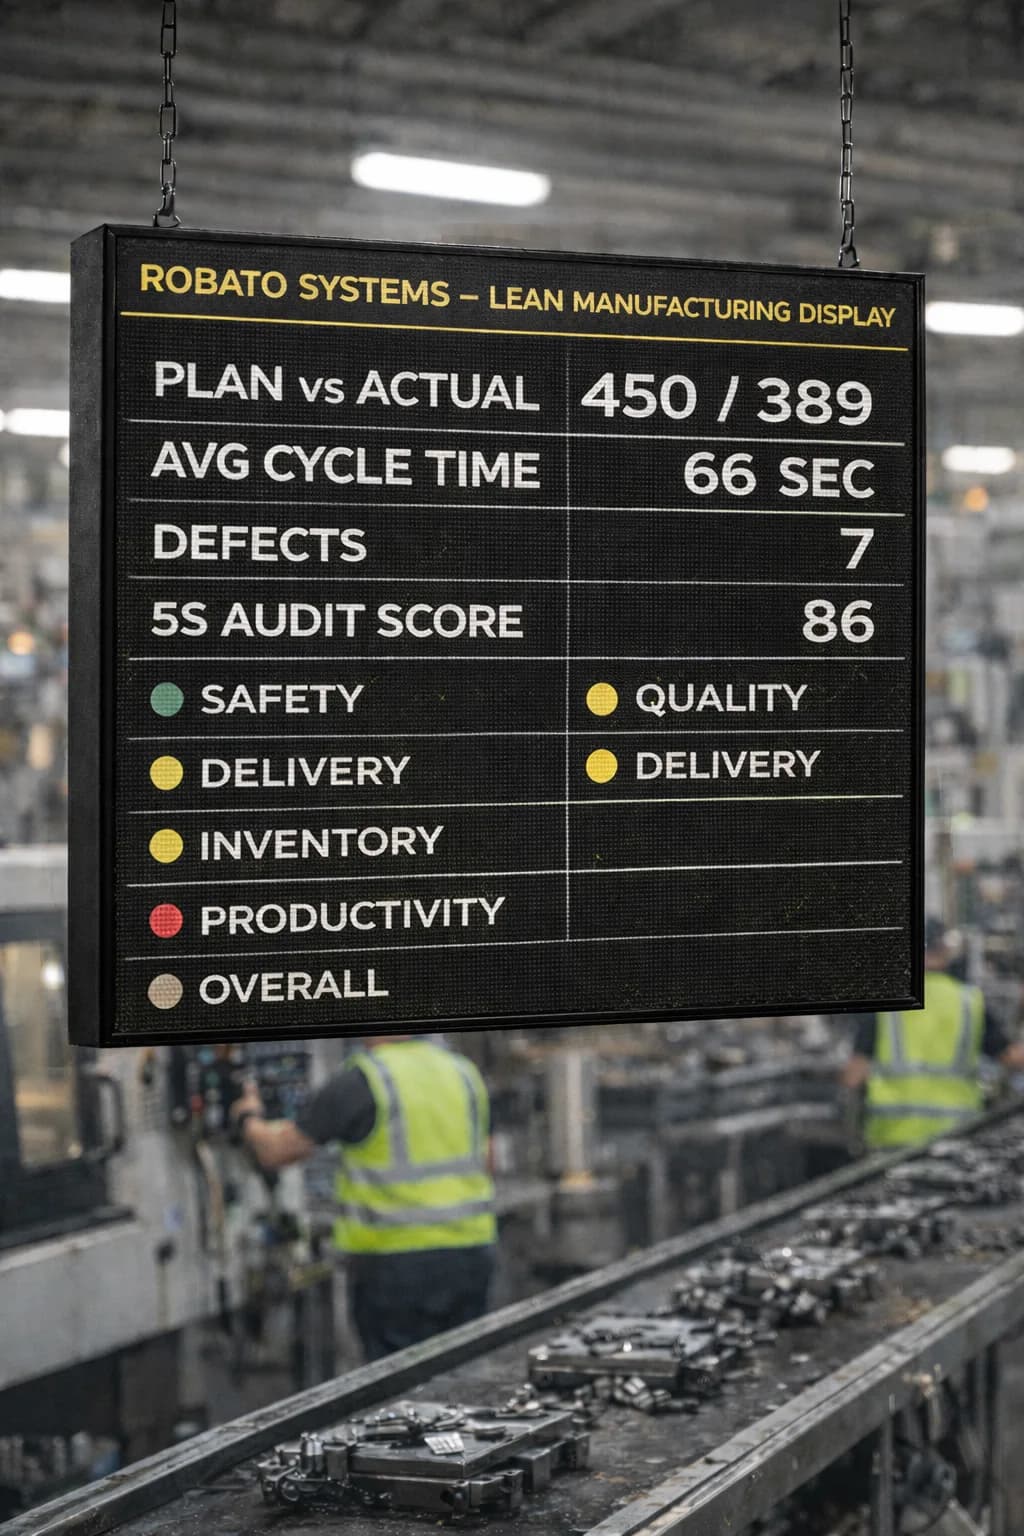
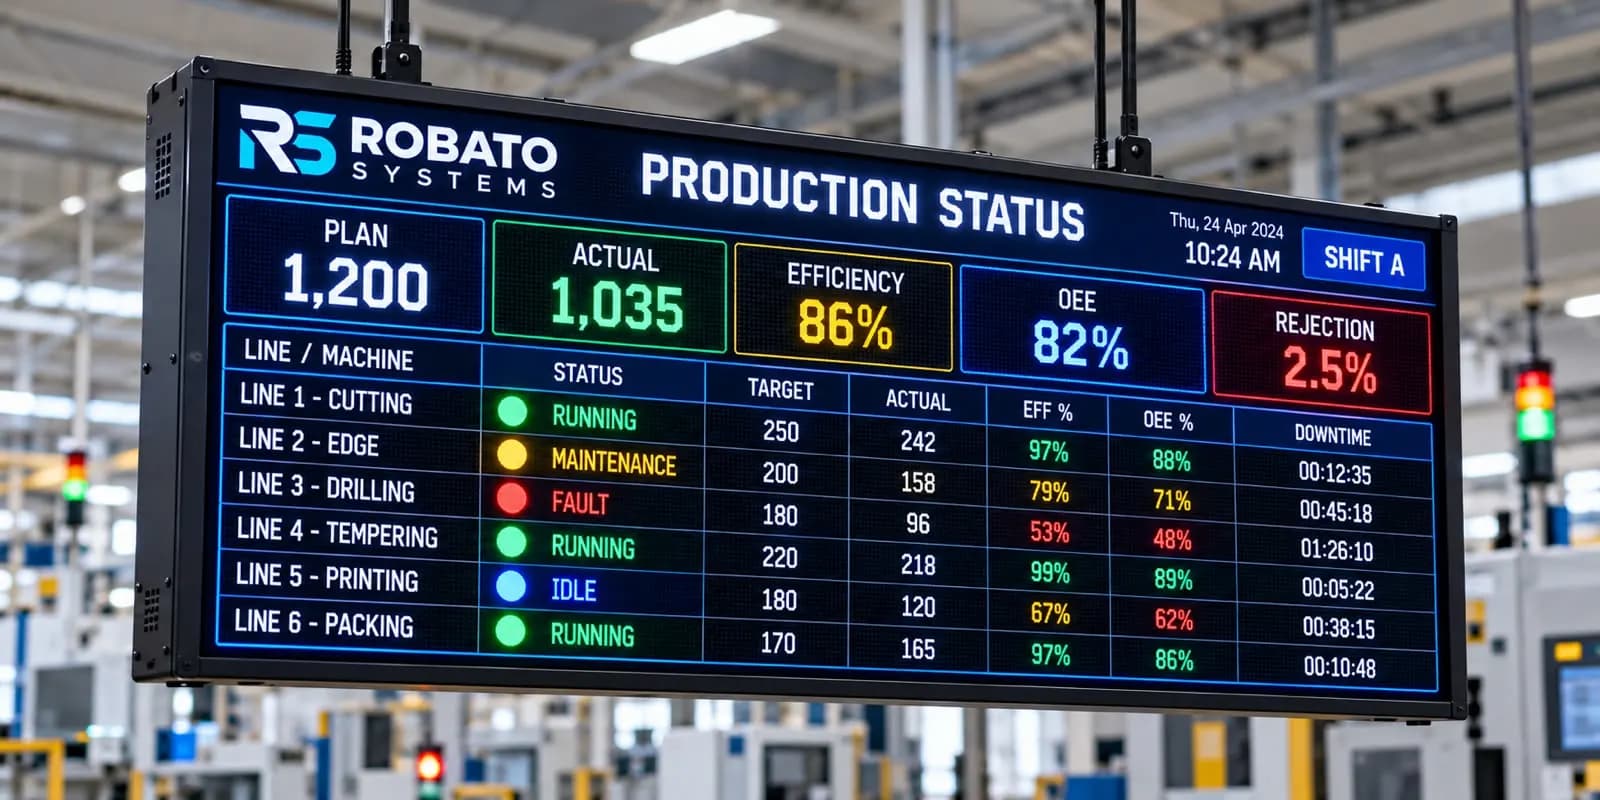
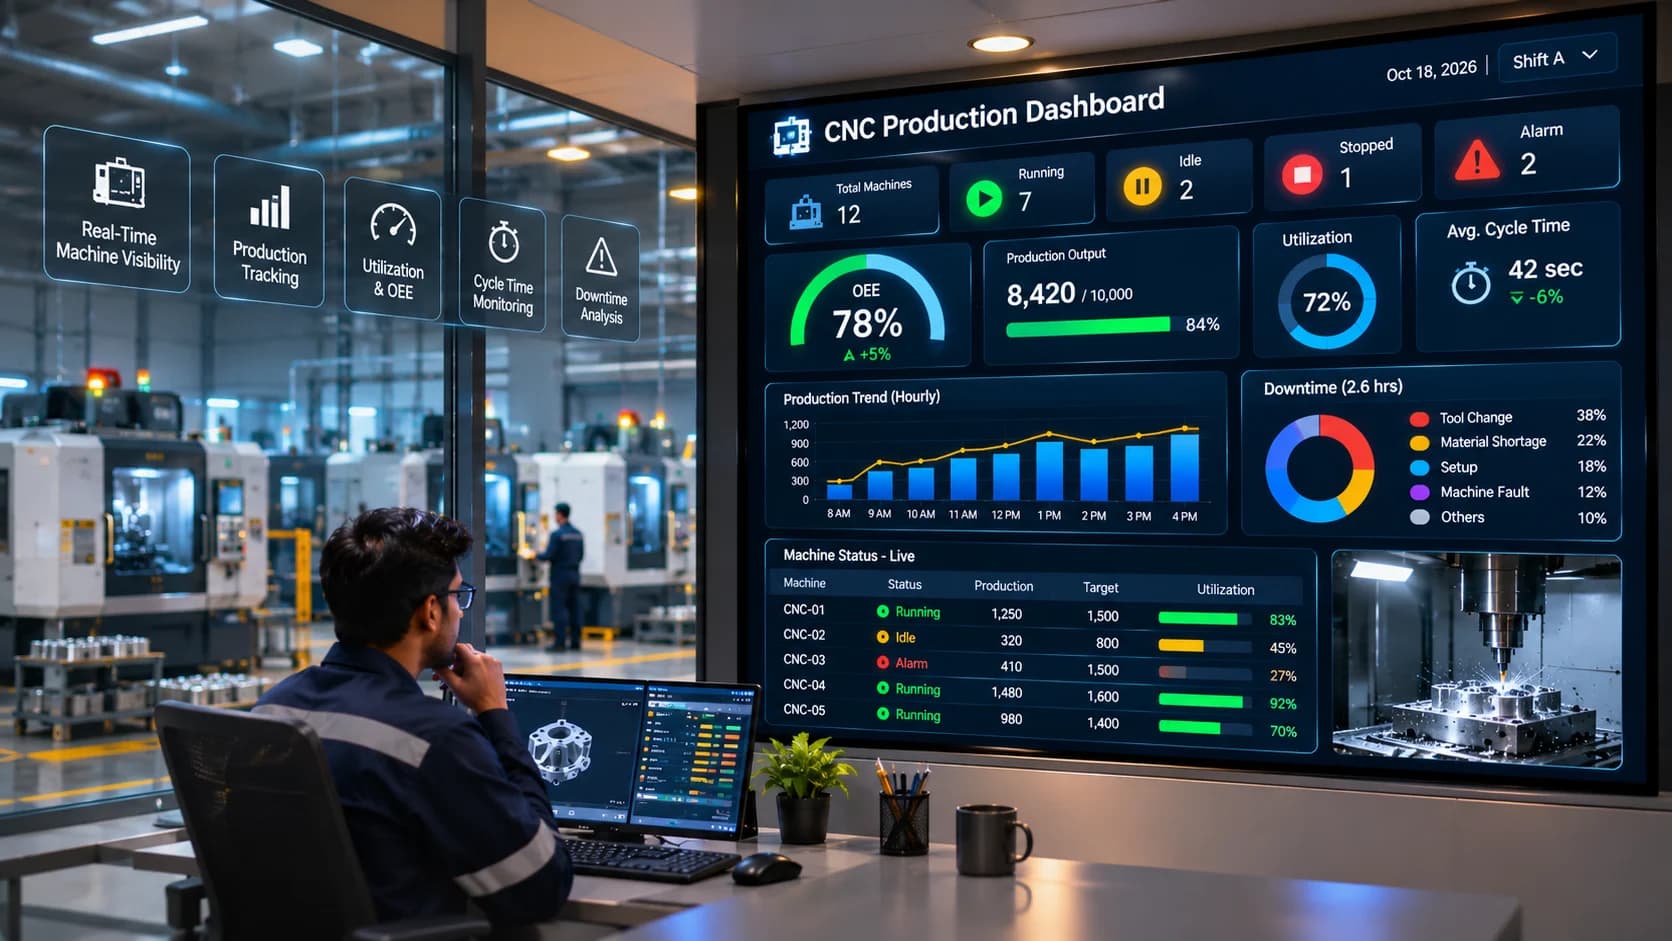
A CNC dashboard brings this information together in a centralized visual interface. It helps production managers, supervisors, operators, and maintenance teams monitor machine activity, review production performance, and identify operational issues.
A well-designed CNC monitoring dashboard does more than display machine readings. It organizes important production information into clear indicators, visual trends, alerts, and reports that support timely decisions.
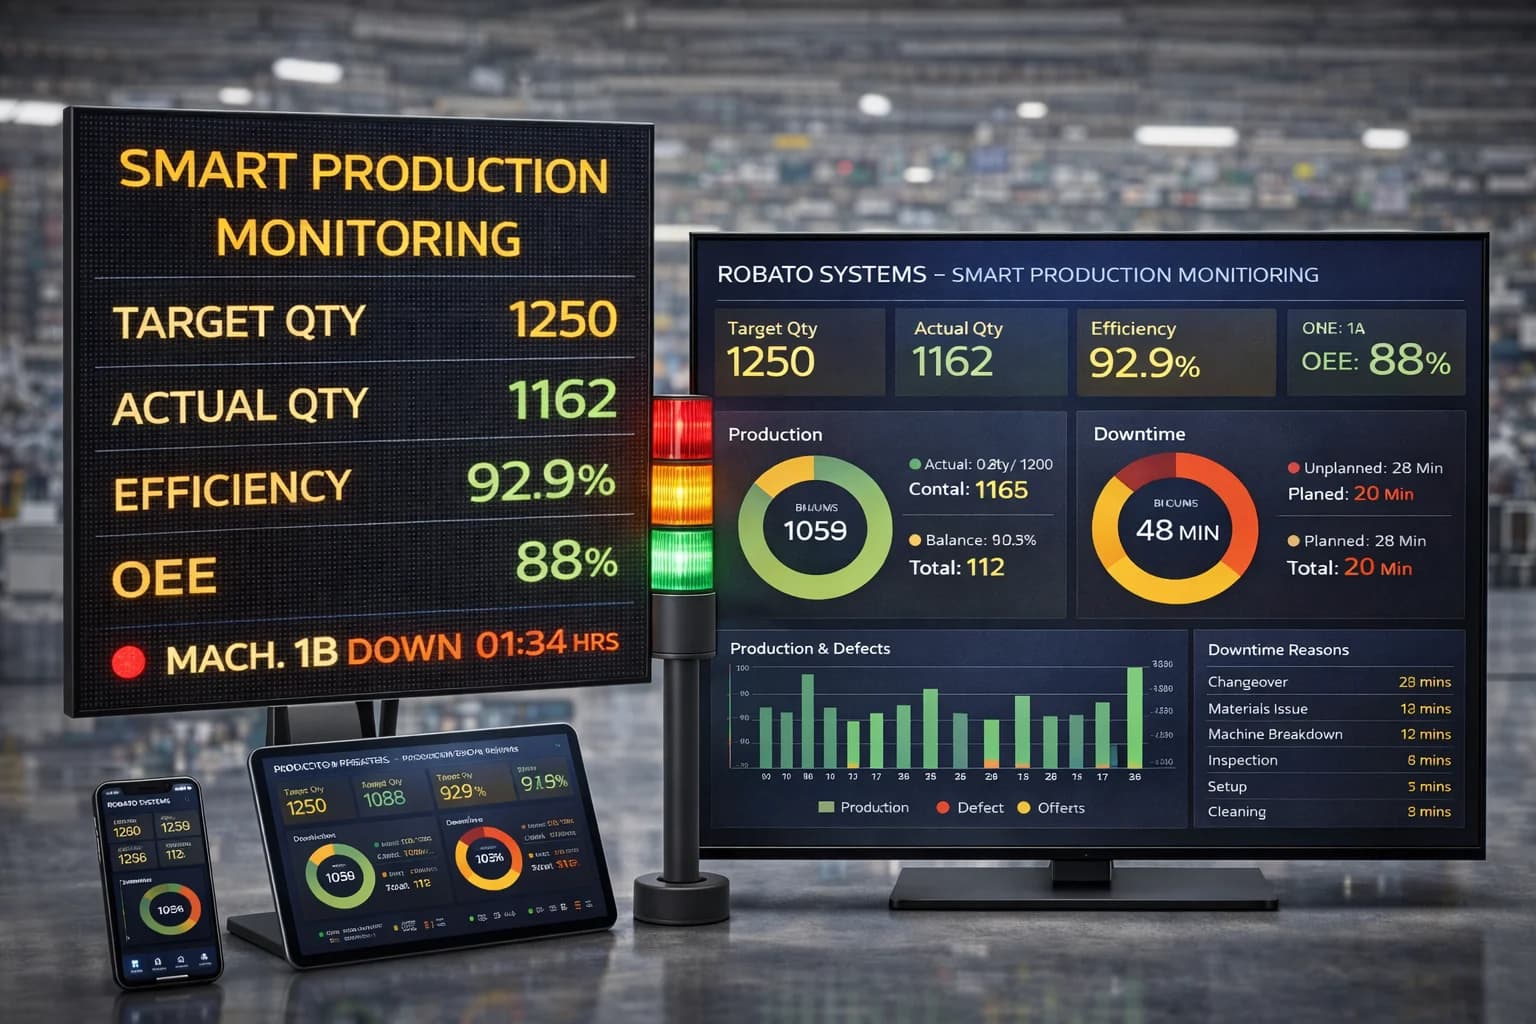
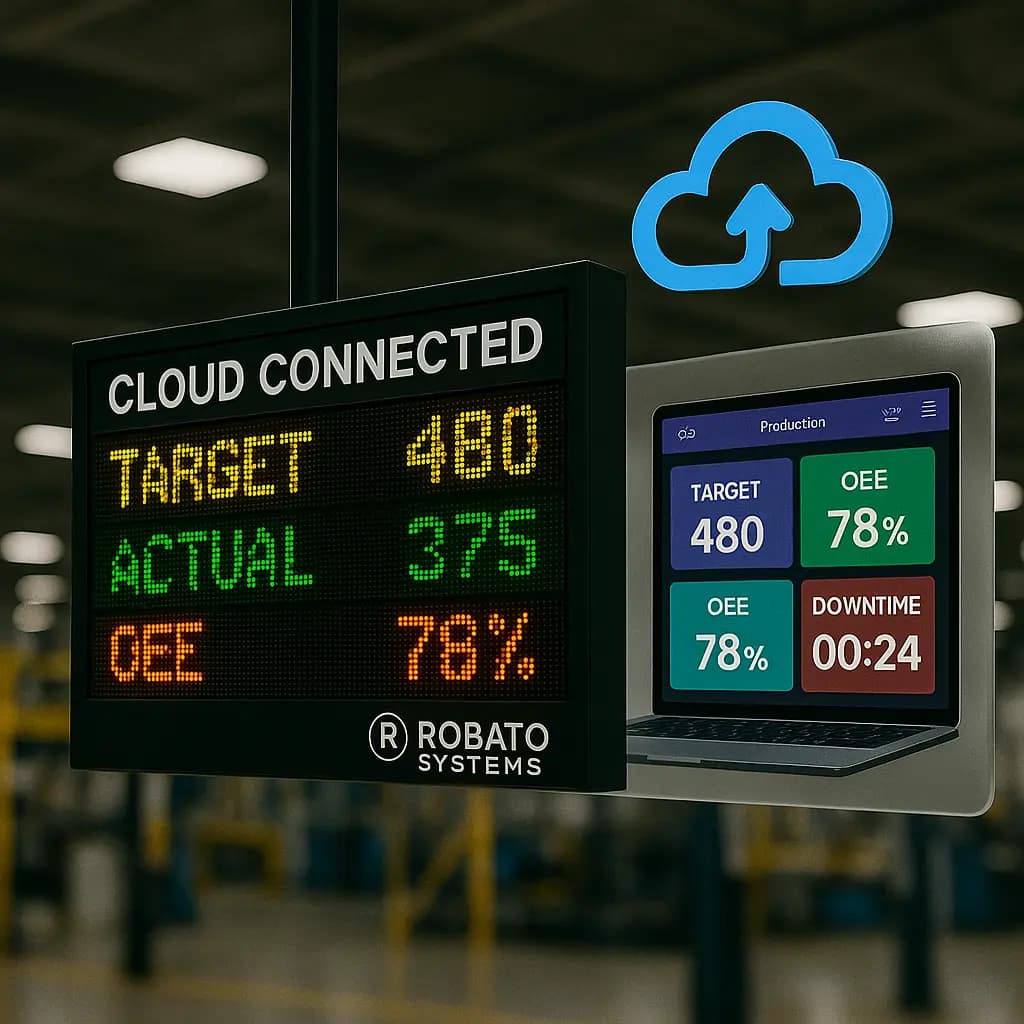
With industrial IoT technologies, manufacturers can connect CNC controllers, PLCs, sensors, and data acquisition devices to a centralized monitoring platform. The collected information can then be displayed through dashboards accessible from production computers, control rooms, Smart TVs, or other authorized devices.
This guide explains what a CNC dashboard is, which KPIs it should display, how to design an effective dashboard, and the best practices manufacturers should follow when implementing one.
What Is a CNC Dashboard?
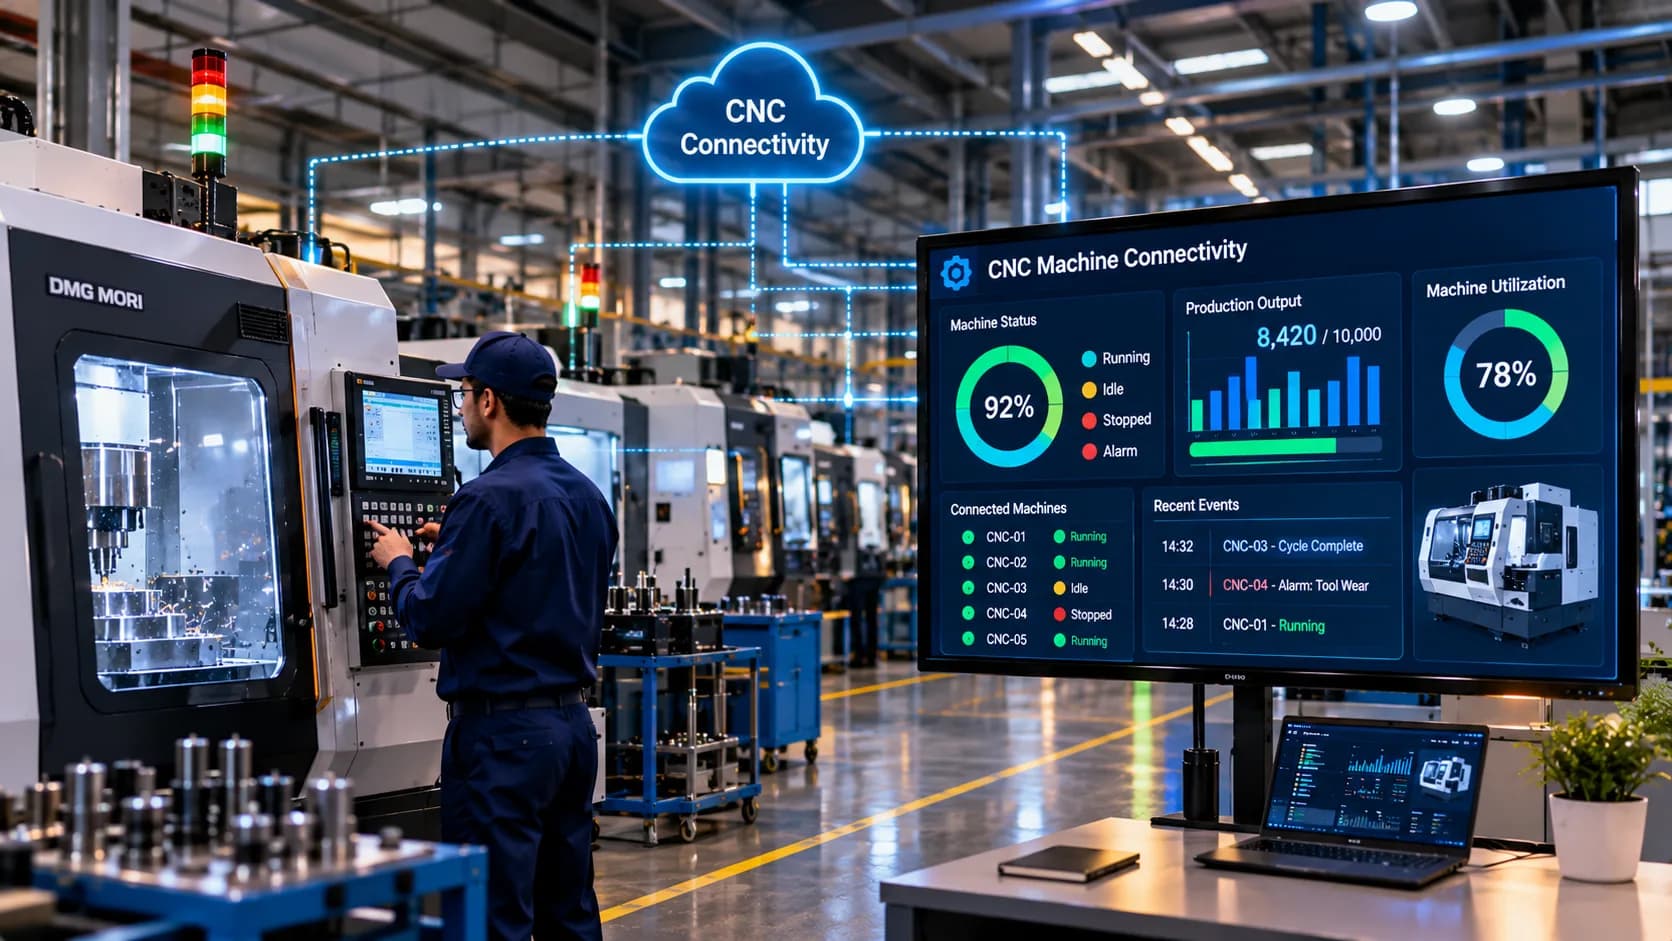
A CNC dashboard is a visual monitoring interface that displays operational and production information collected from Computer Numerical Control machines.
It provides a consolidated view of machine activity and production performance, allowing users to understand equipment conditions without checking each machine individually.
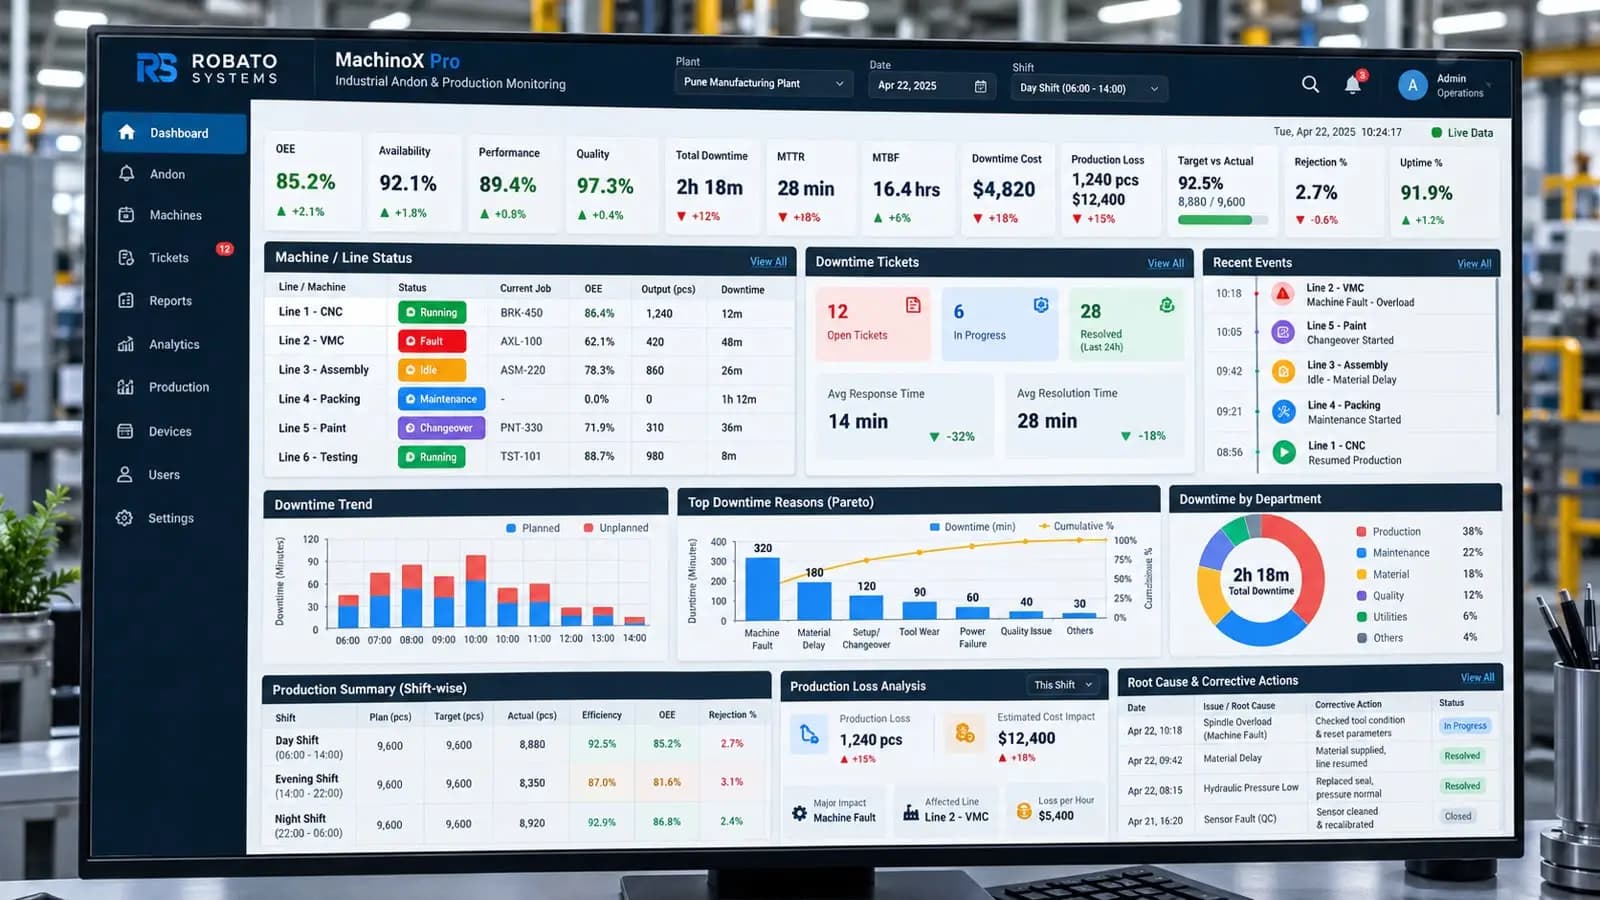
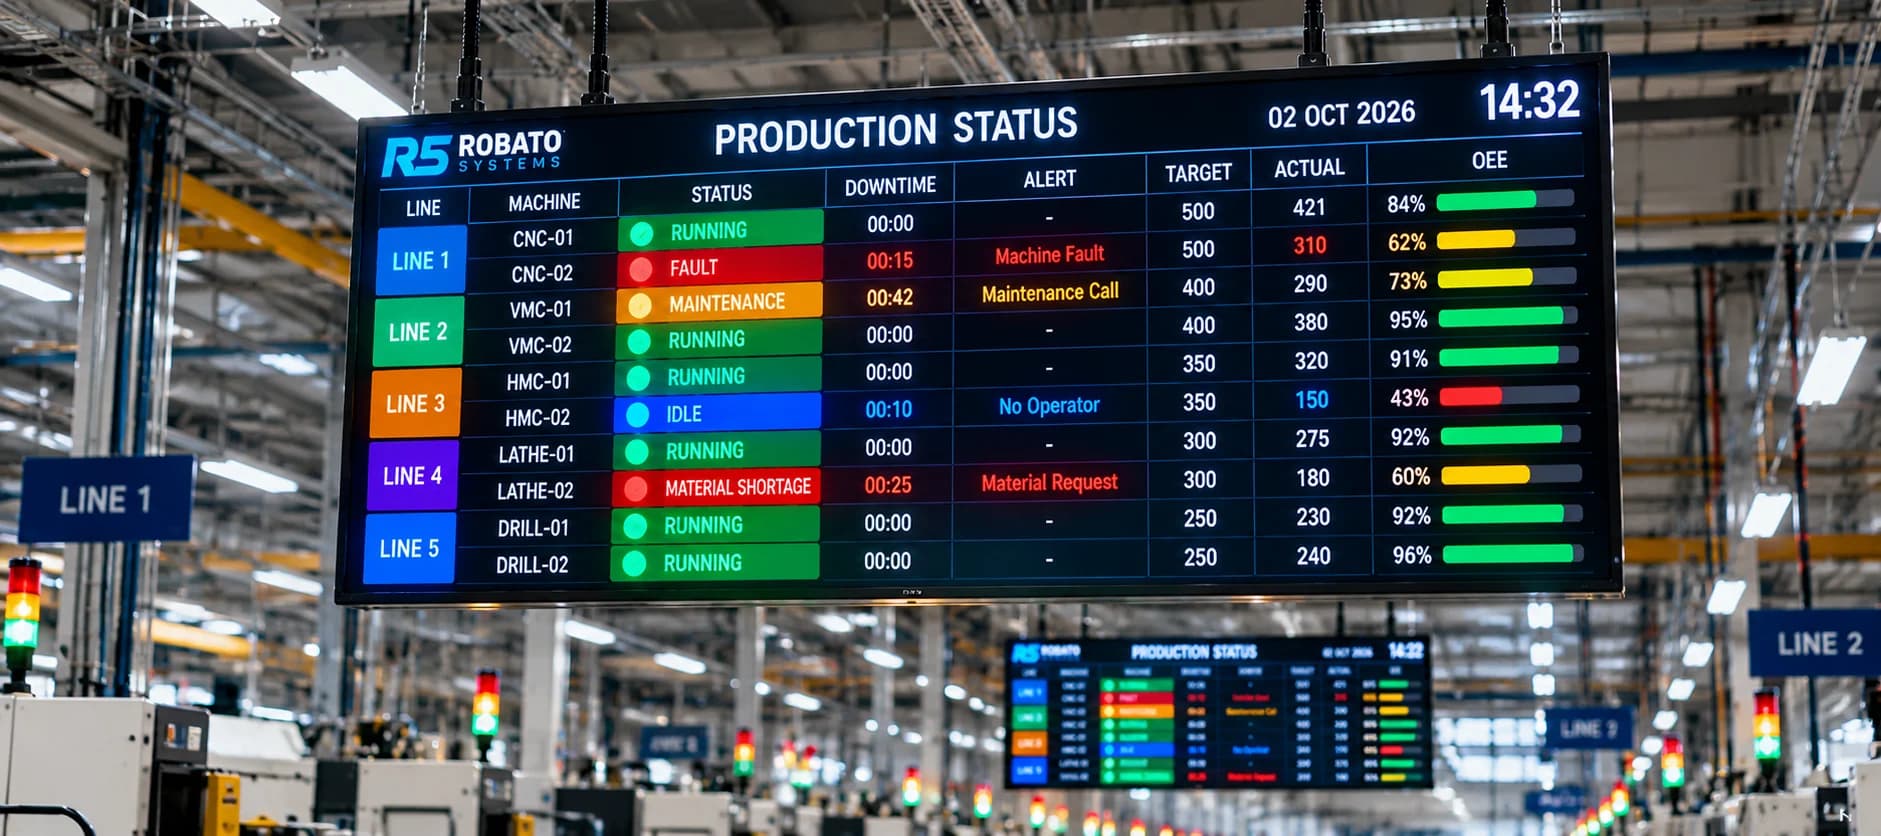
Depending on the monitoring system and available data sources, a CNC dashboard may display:
Current machine status
Running, idle, stopped, and alarm conditions
Production counts
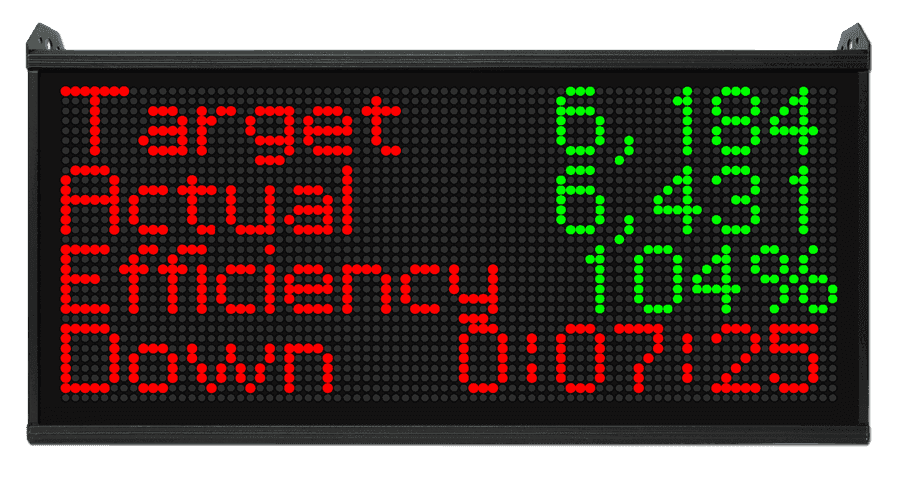
Target versus actual production
Machine cycle time
Shift-wise production
Downtime duration
Machine utilization
OEE indicators
Production trends
Machine alarms and notifications
The information is typically collected from CNC controllers, PLCs, sensors, industrial gateways, and operator inputs.
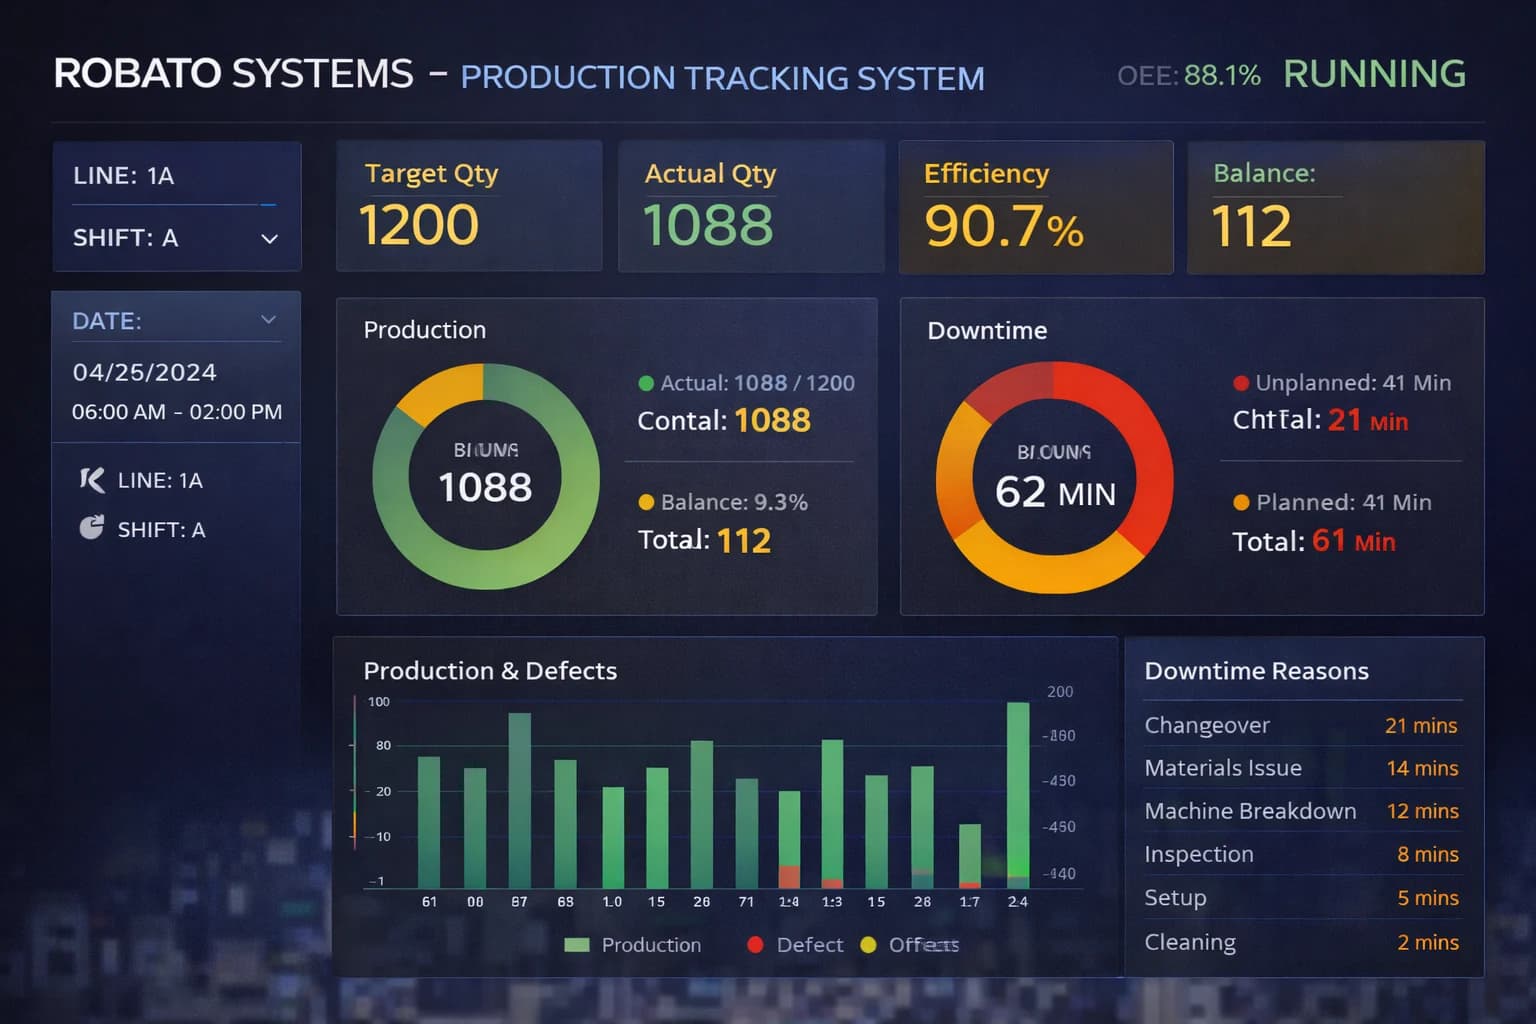
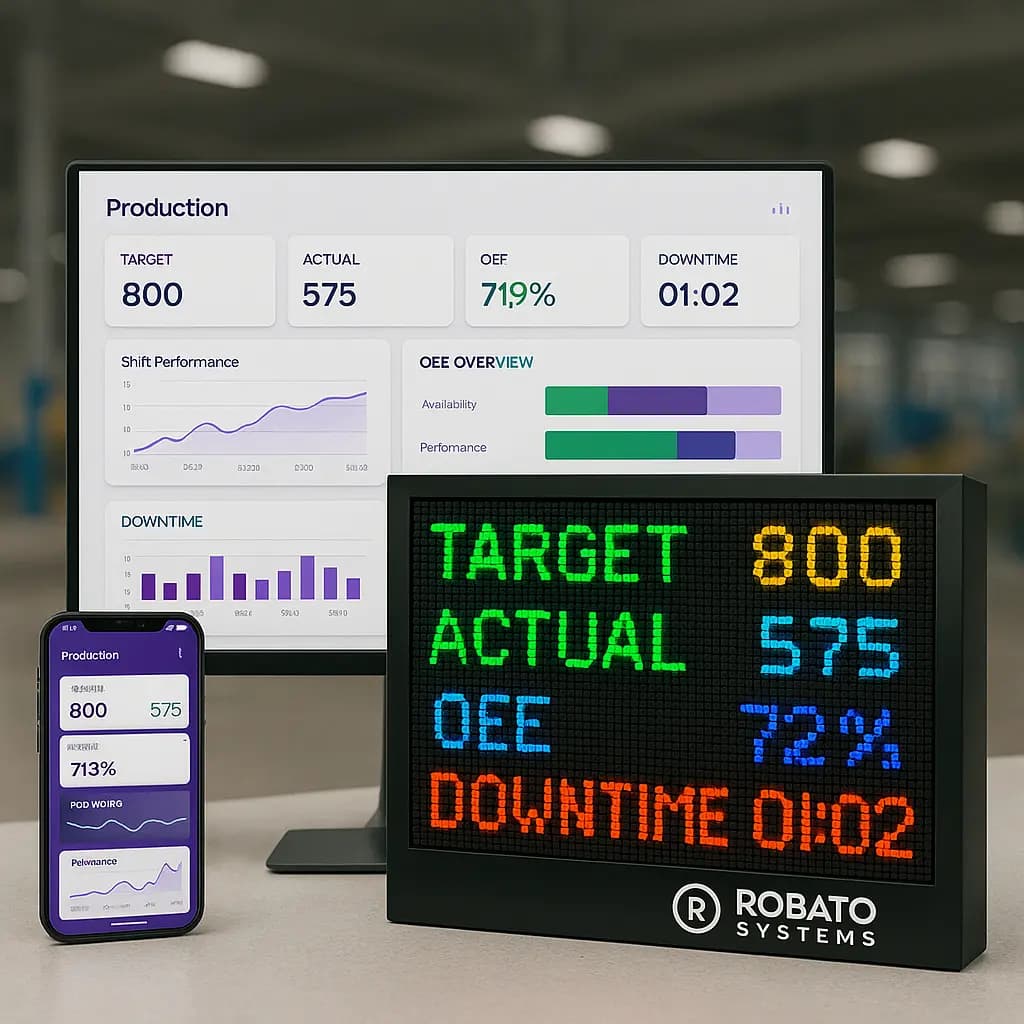
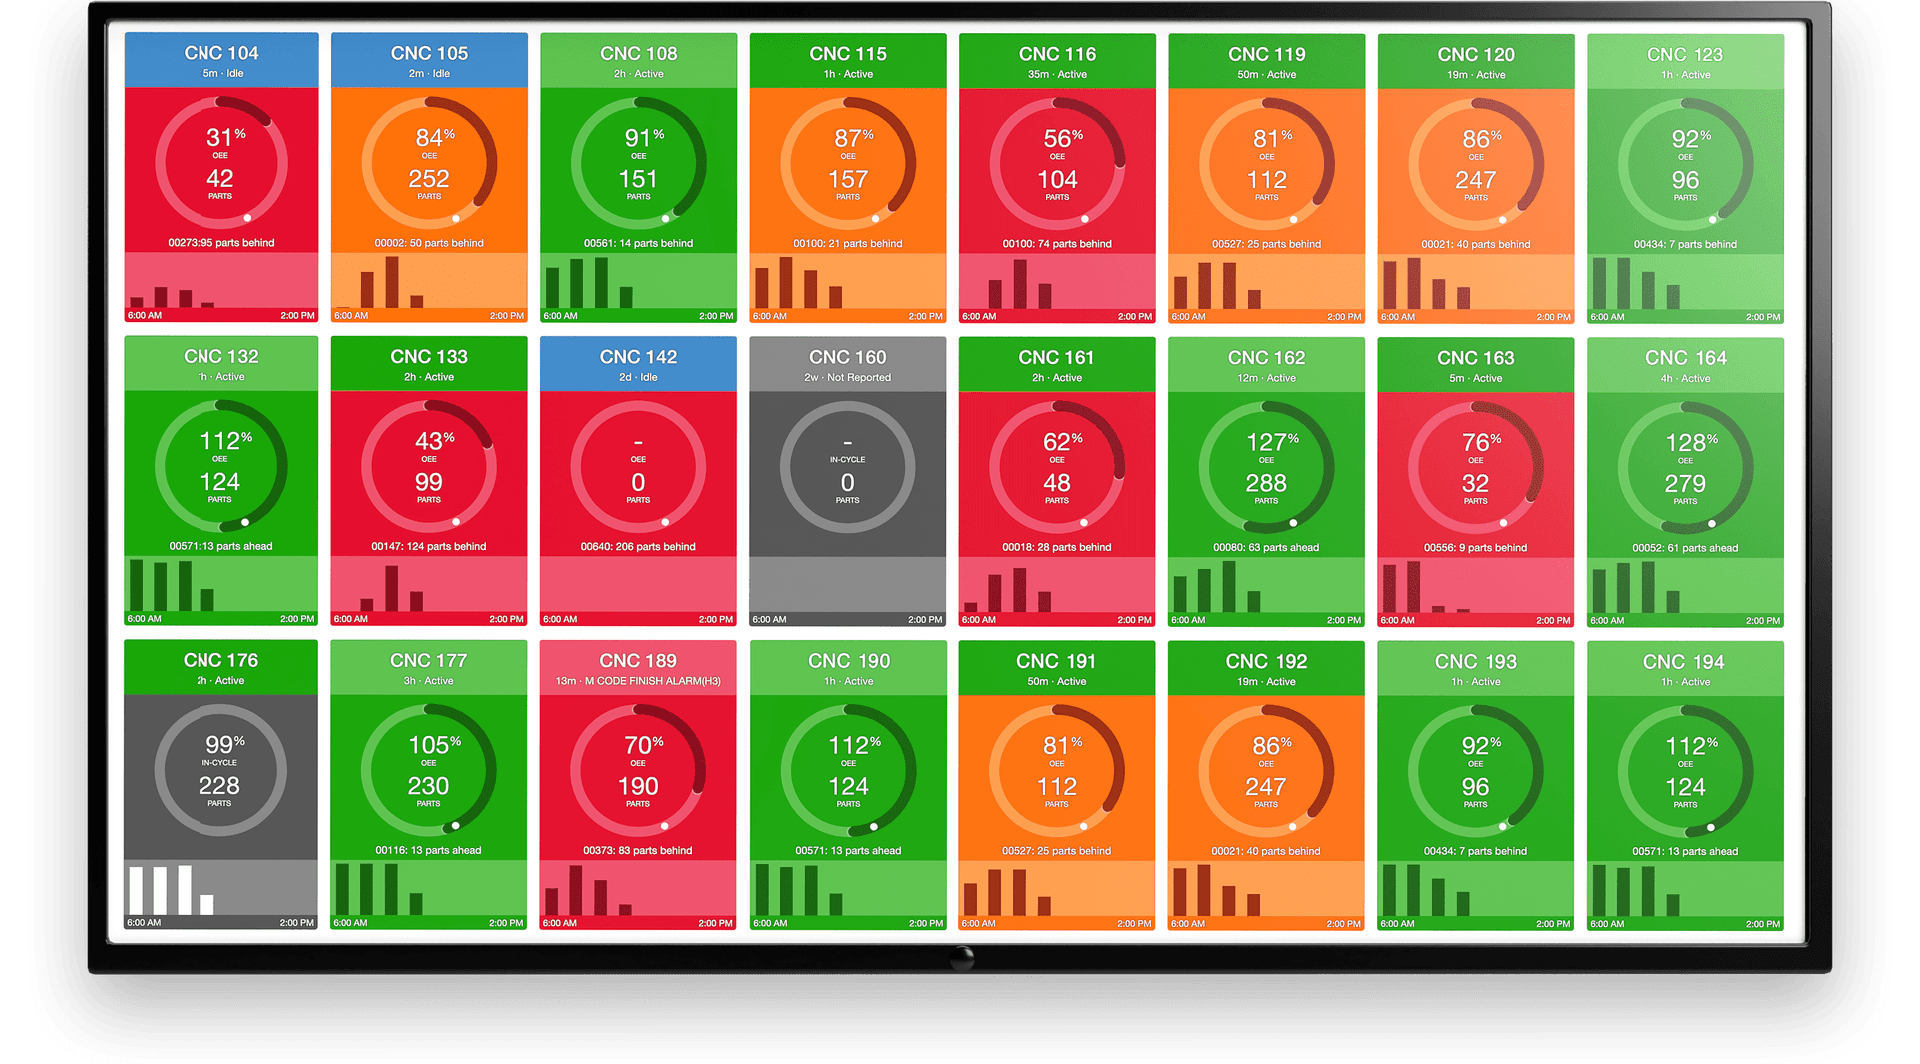
A connected monitoring platform processes the information and presents it through visual elements such as KPI cards, tables, charts, status indicators, and machine-wise summaries.
Why Do Manufacturers Need a CNC Monitoring Dashboard?
Without a centralized dashboard, production teams may depend on manual inspections, operator reports, and individual machine displays.
These methods can make it difficult to identify production issues across multiple machines.
A CNC dashboard provides a common view of operational information and helps manufacturers manage production more effectively.
1. Real-Time Machine Visibility
A dashboard displays the operating conditions of connected CNC machines.
Supervisors can quickly identify which machines are running, idle, stopped, or experiencing alarms.
This reduces the need for repeated manual checks across the shop floor.
2. Better Production Tracking
Machine-level production information can be presented through actual output, planned targets, and completed quantities.
This helps production managers understand whether machines and production lines are progressing according to schedule.
3. Faster Identification of Downtime
A dashboard can highlight machine stoppages and show how long equipment has remained inactive.
When downtime reasons are also collected, production teams can investigate recurring interruptions more effectively.
4. Improved Performance Visibility
Machine utilization, cycle time, production output, and OEE indicators provide a broader understanding of equipment performance.
These metrics help identify machines that may require attention.
5. Centralized Monitoring Across Machines
A single dashboard can display information from multiple connected CNC machines.
This is particularly useful for factories with several production lines, departments, or operating shifts.
Manufacturers looking to centralize machine information can explore Robato's production monitoring solution.
Essential Features of an Effective CNC Dashboard
A useful CNC dashboard should focus on information that supports production decisions.
The exact features depend on the factory's processes, but the following capabilities are commonly valuable.
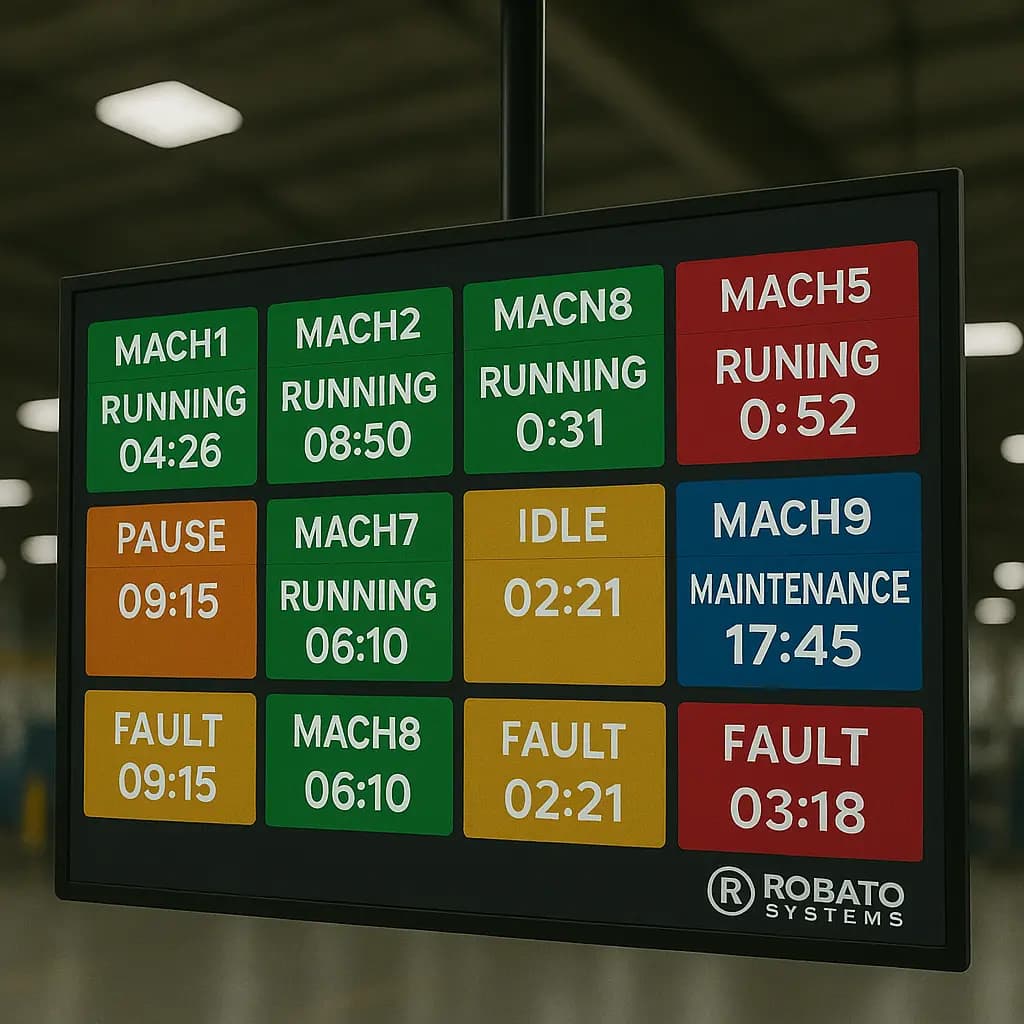
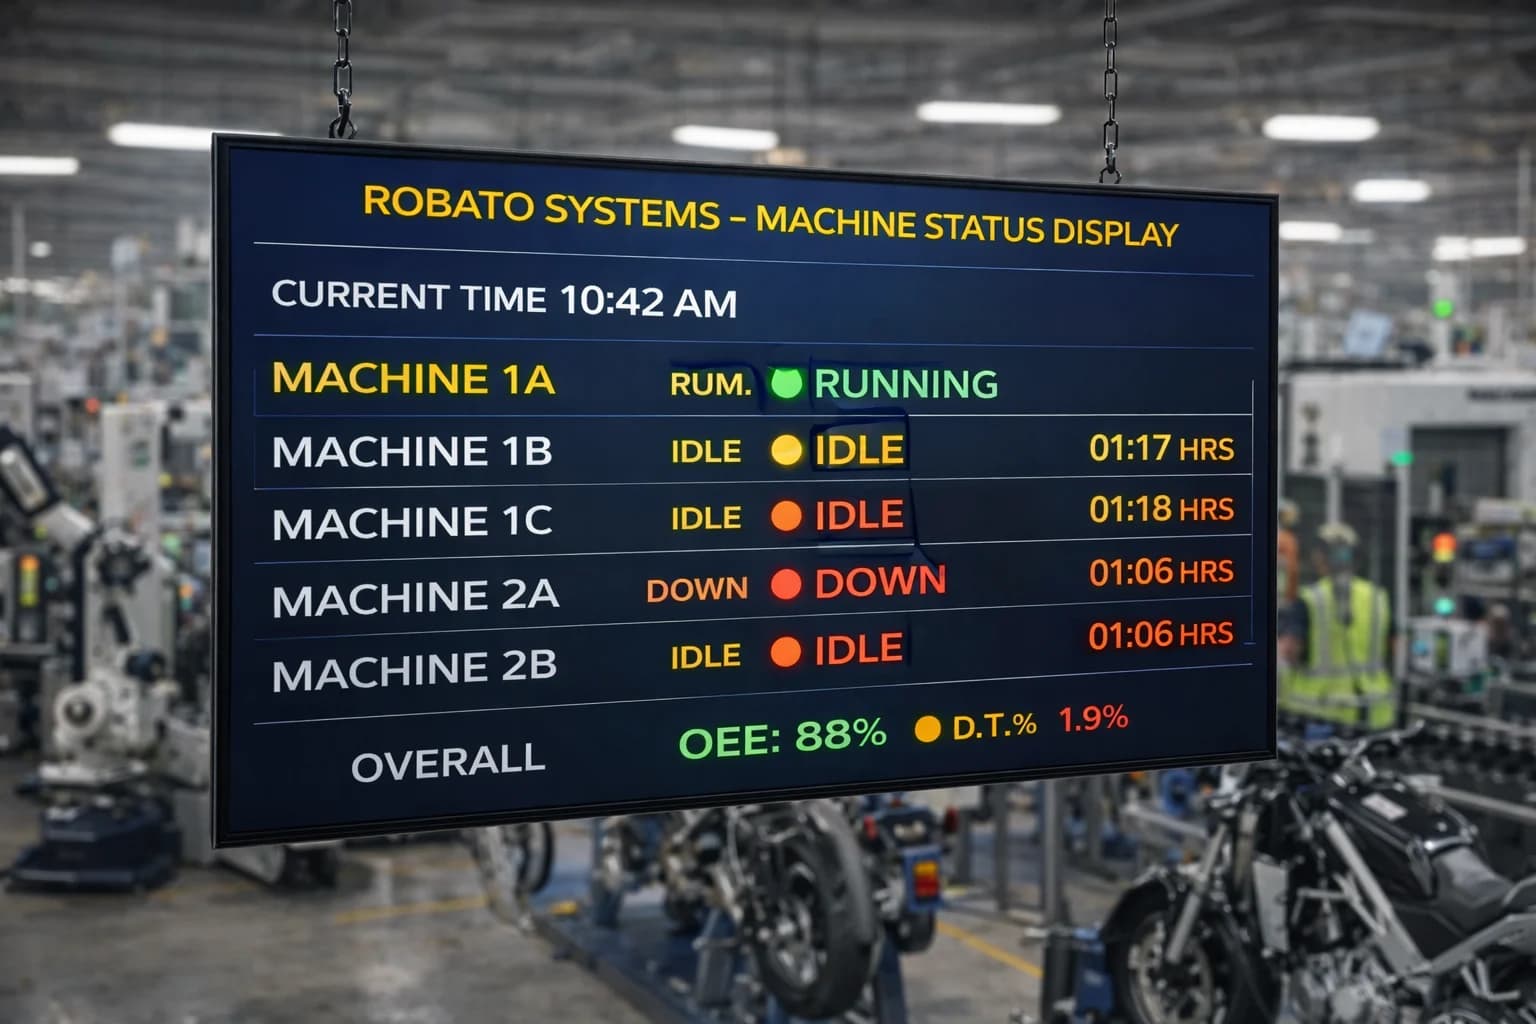
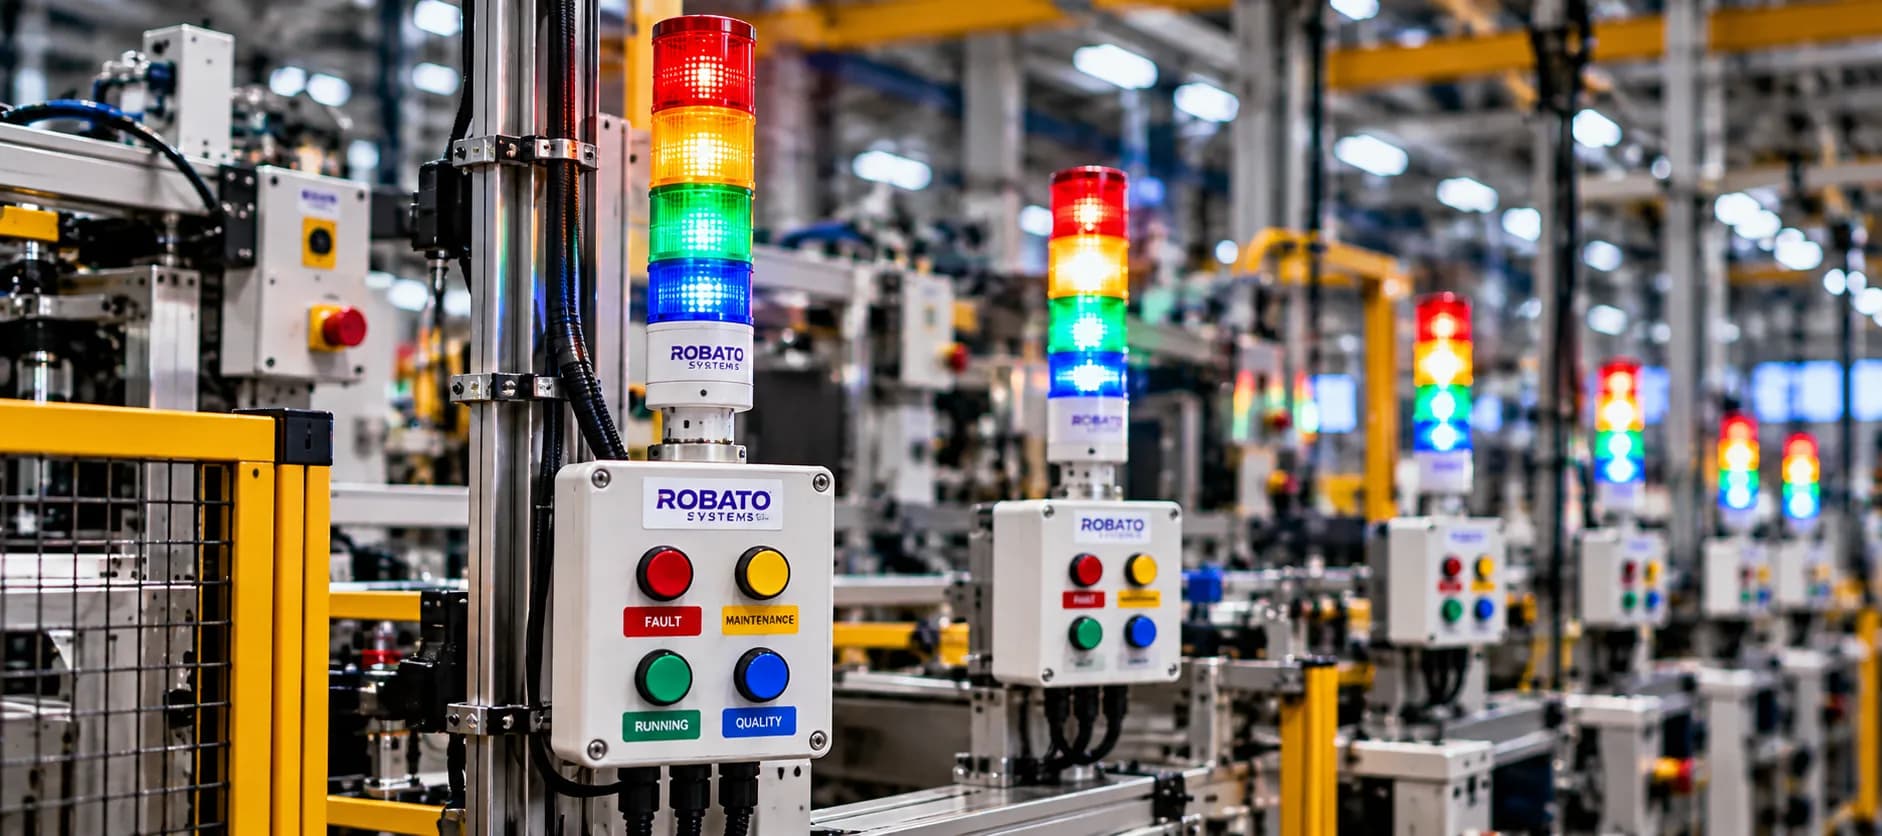
1. Live Machine Status
Machine status is one of the most important elements of a CNC monitoring dashboard.
It should clearly indicate whether each connected machine is:
Running
Idle
Stopped
In alarm
In setup
Under maintenance
The dashboard should use consistent definitions across machines.
For example, one controller's internal signal may represent program execution, while another may expose a cycle-active signal. Both need to be mapped correctly before they are displayed as a common machine status.
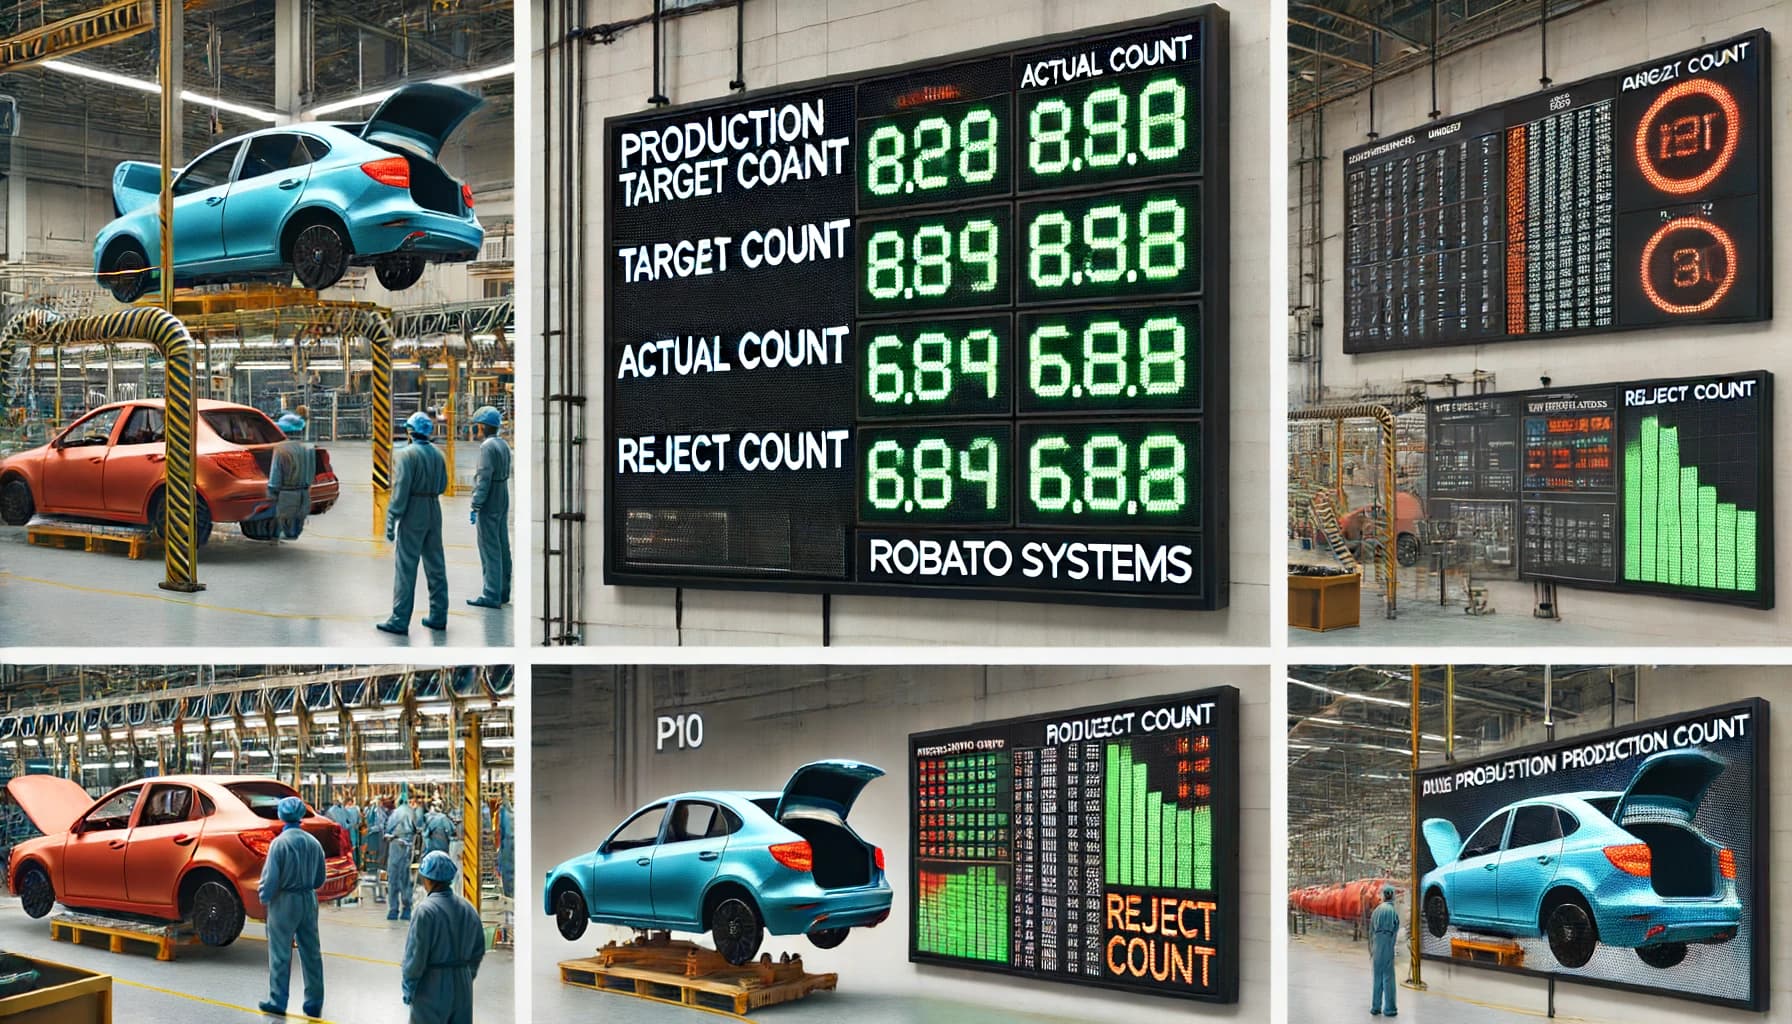
2. Production Count and Output
Production tracking helps supervisors understand how many components each machine has produced.
A dashboard can display:
Current shift production
Daily production
Planned production target
Actual production
Production variance
Machine-wise output
Production counts may come from controller counters, PLC registers, cycle-complete signals, or suitable part-detection sensors.
It is important to distinguish between completed cycles, produced parts, and accepted parts.
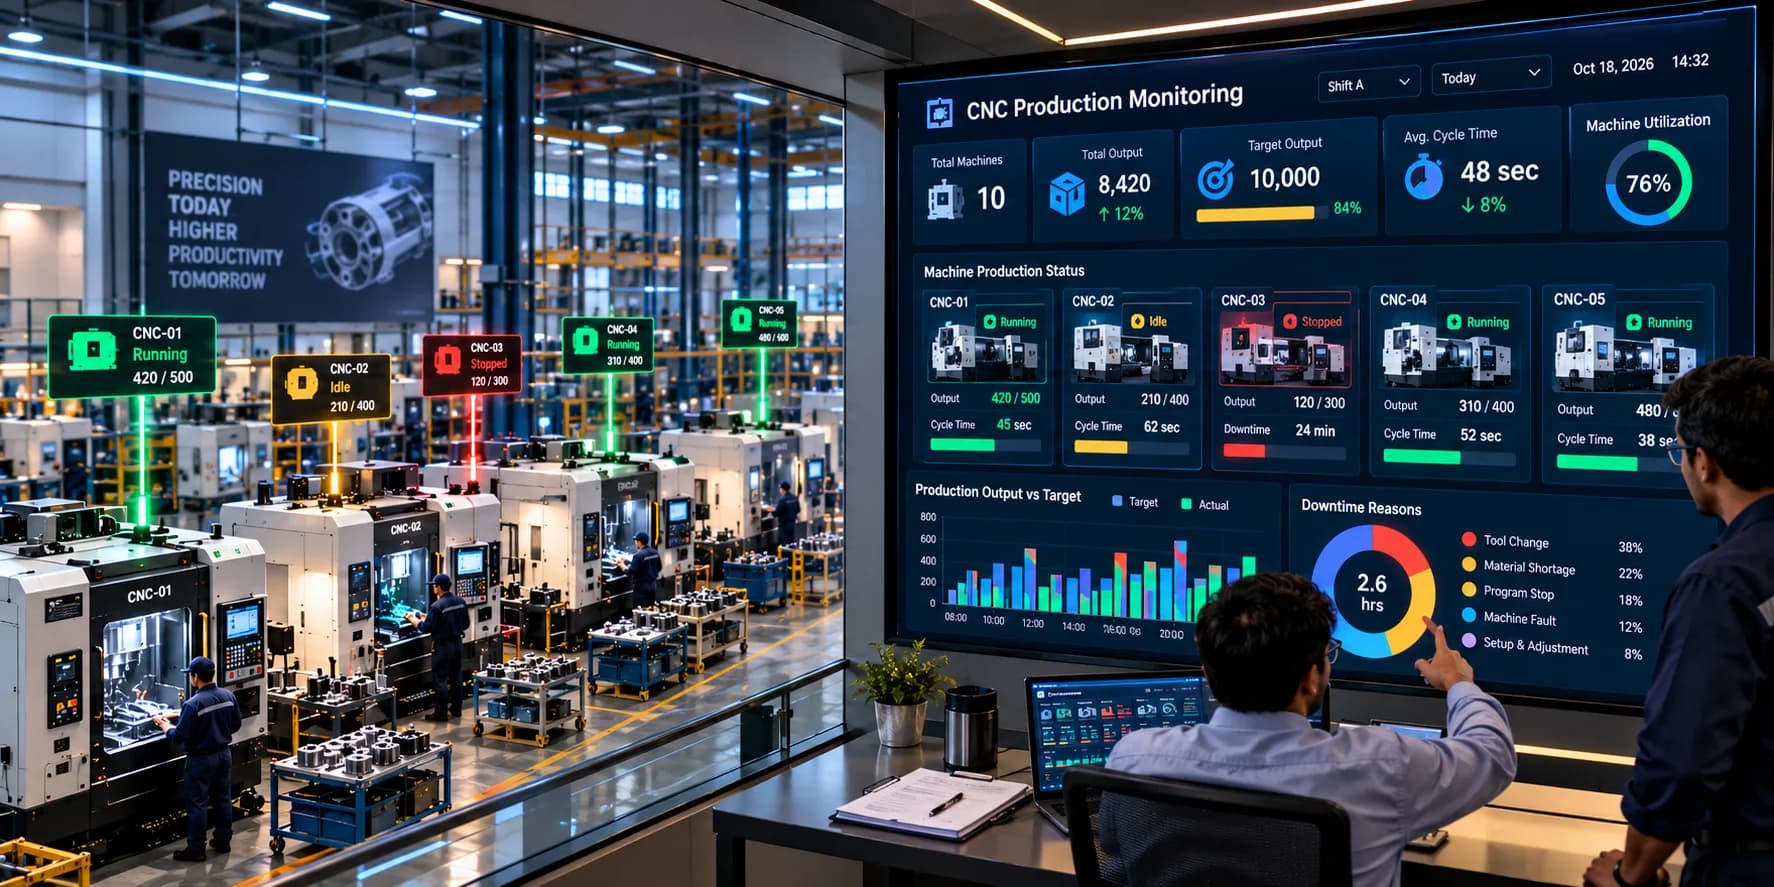
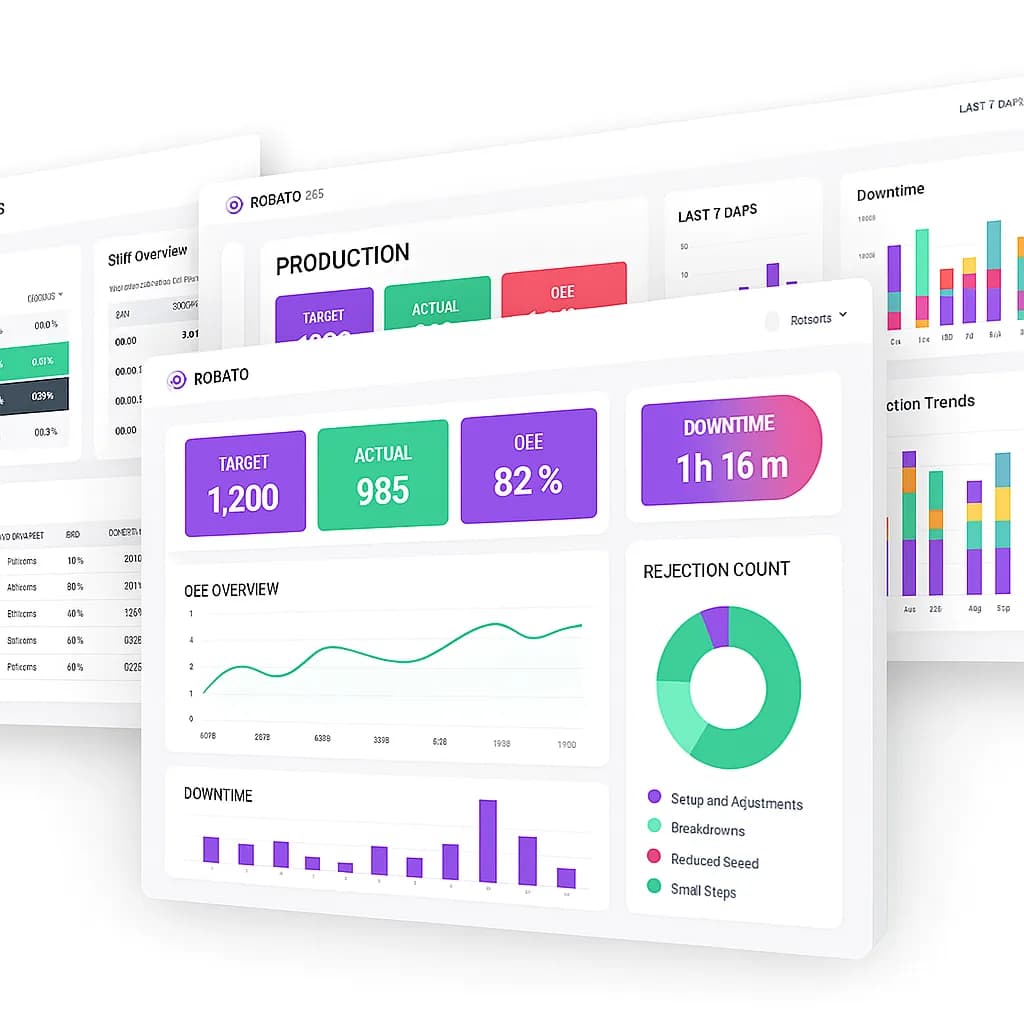
3. Target vs. Actual Production
Comparing actual output with planned production helps identify production gaps.
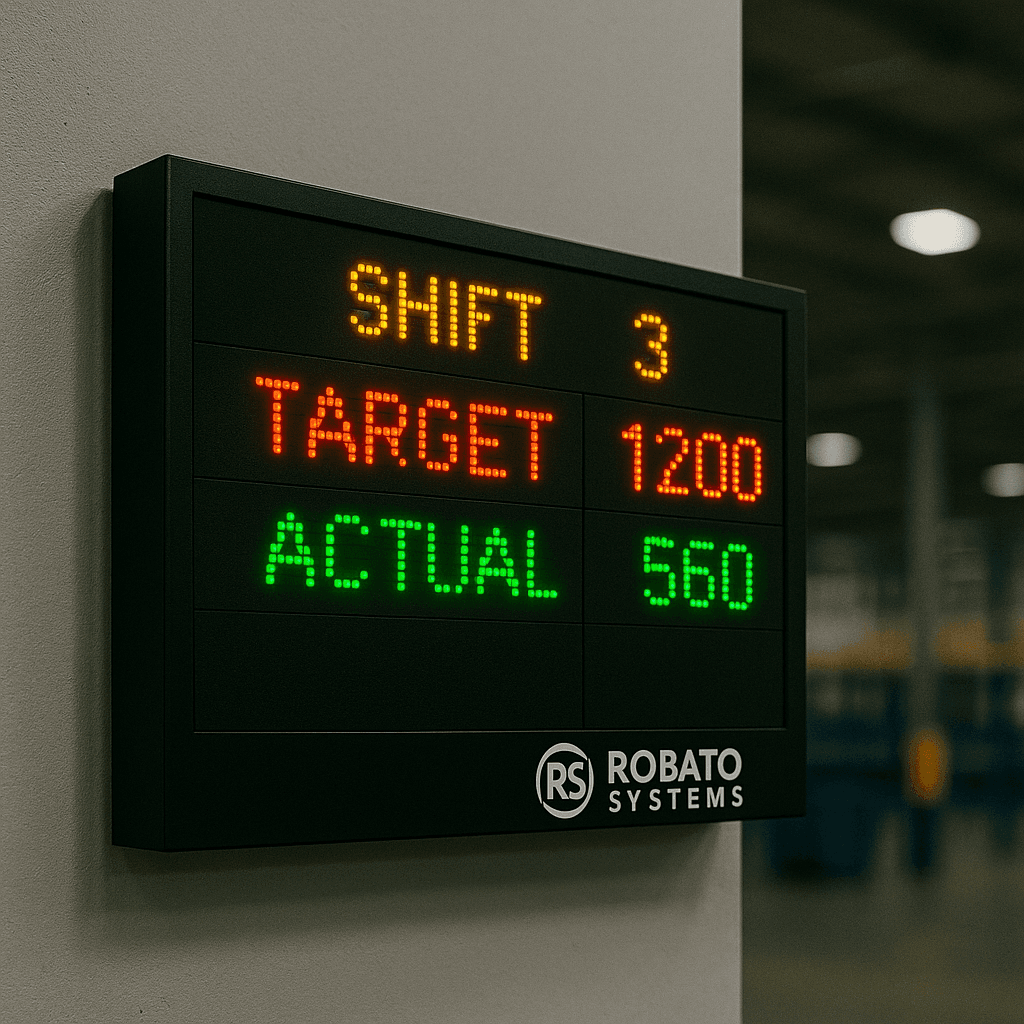
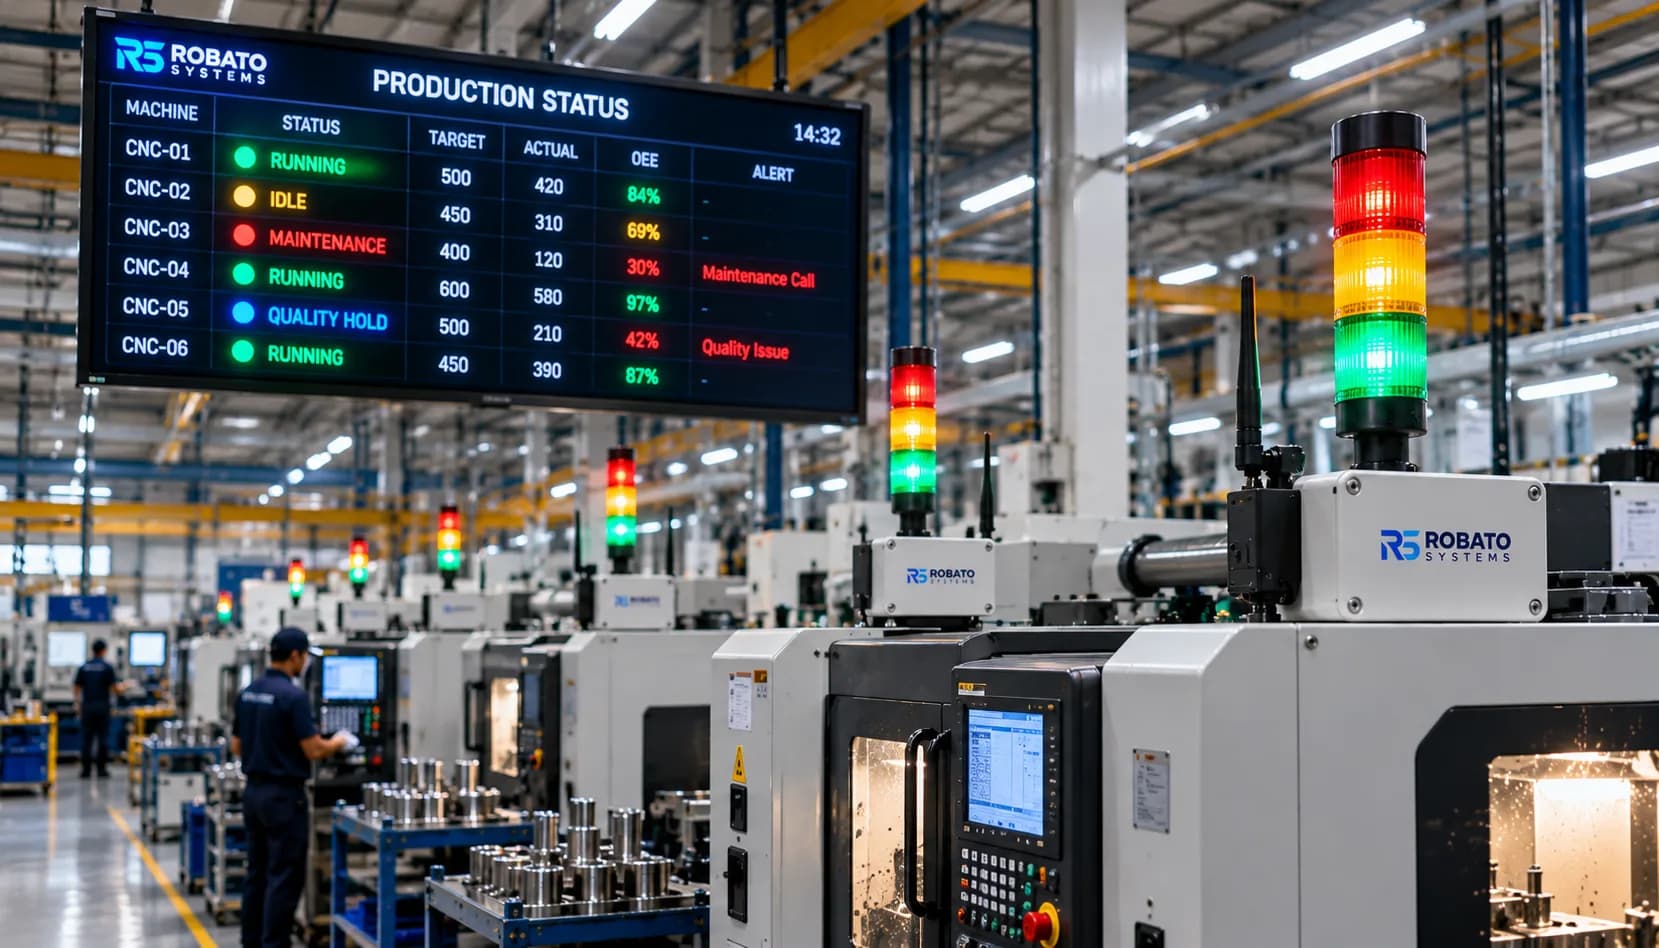
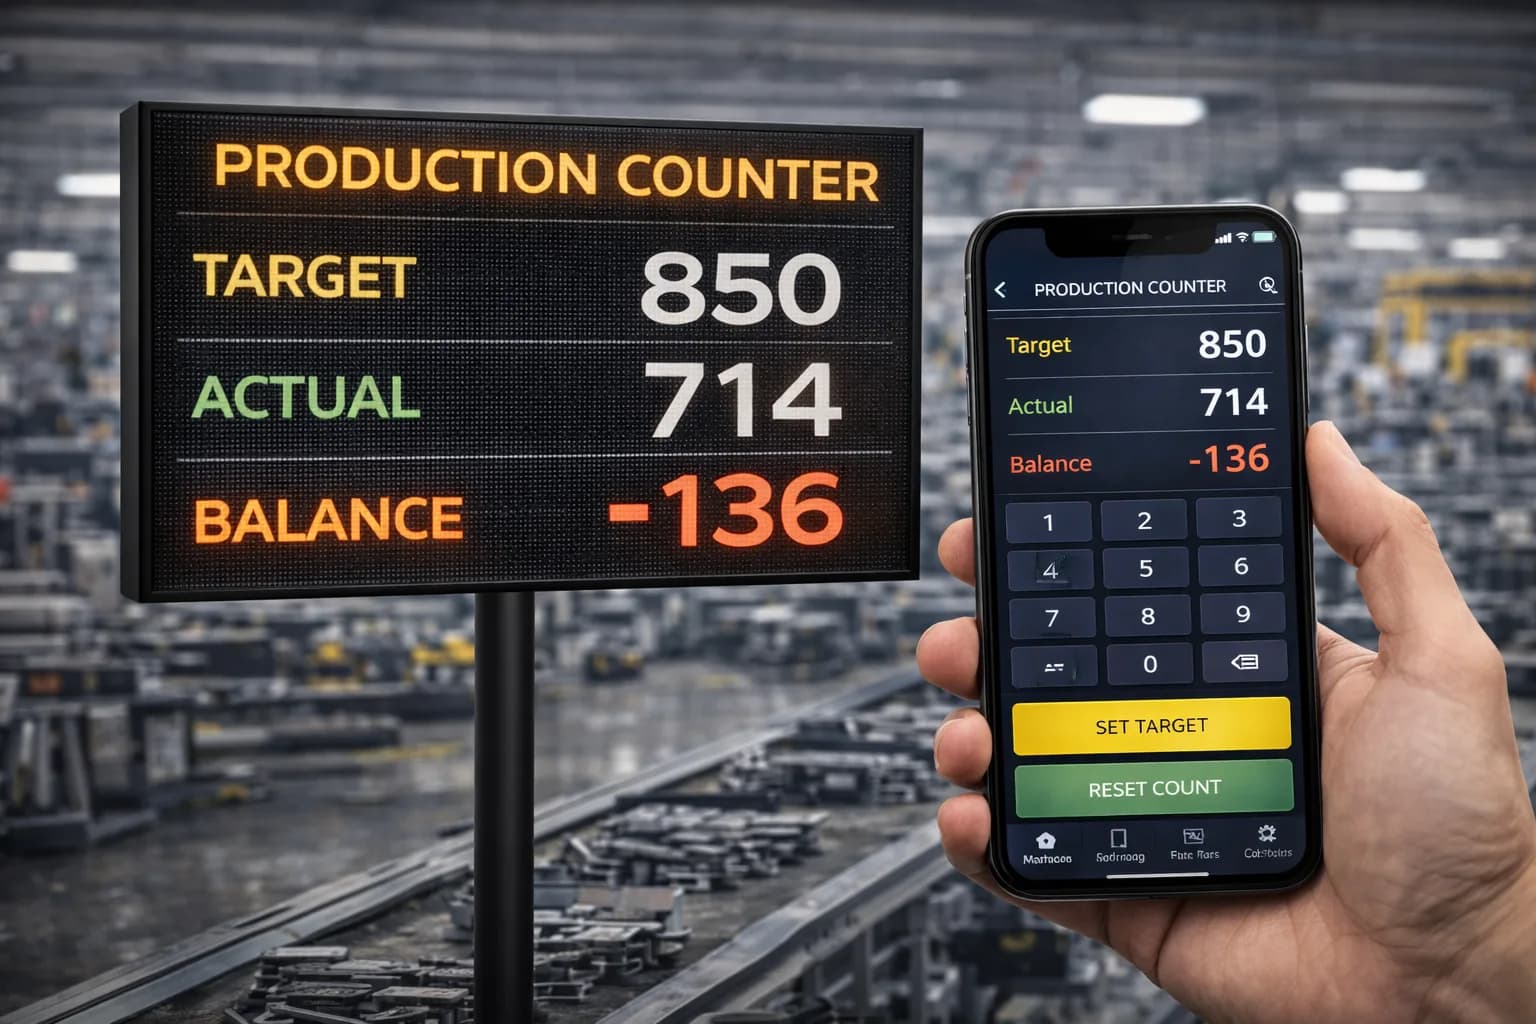
For example, a dashboard may show that a machine has completed 420 parts against a shift target of 500.
This gives supervisors a clear indication of whether production is on track.
Targets should be based on realistic production plans and adjusted when product, tooling, or process requirements change.
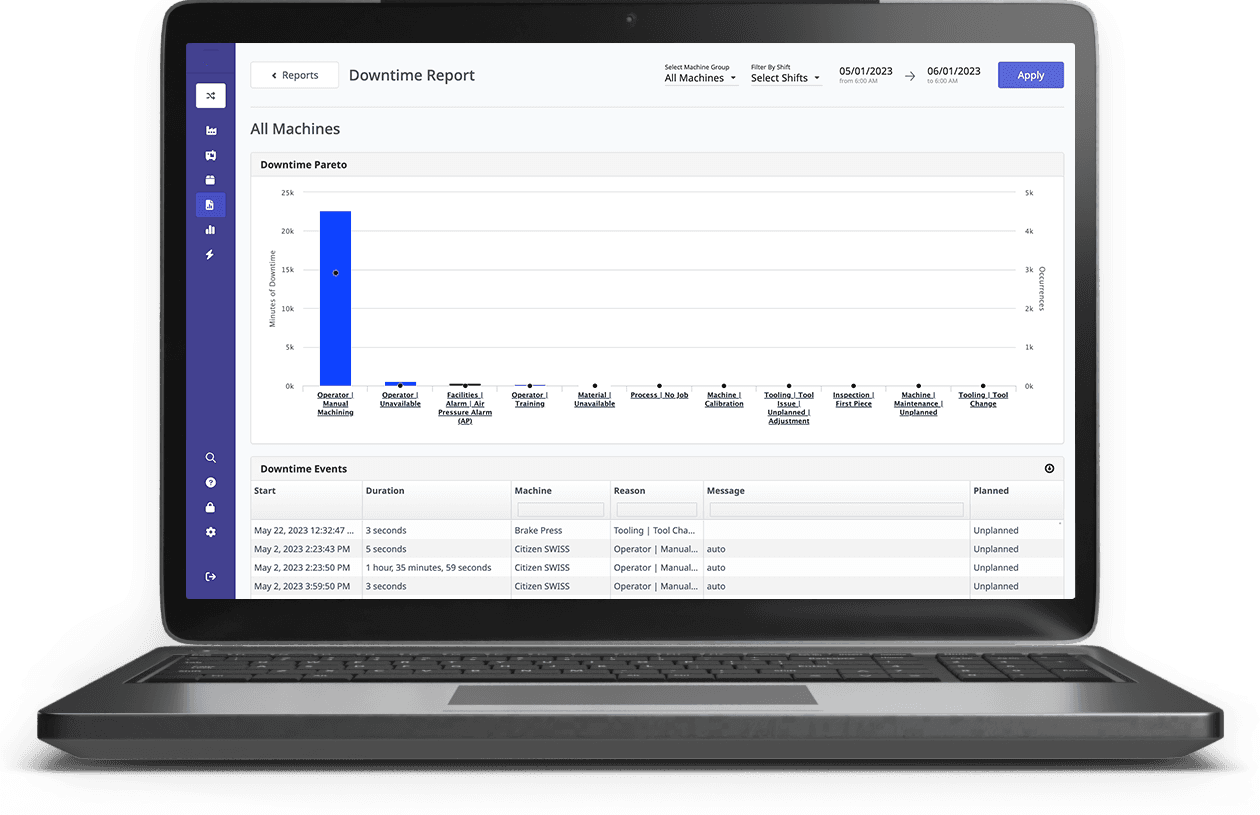
4. Downtime Monitoring
Downtime information helps identify periods when machines are not producing.
An effective dashboard should display:
Current downtime
Total downtime by shift
Number of stoppages
Downtime duration
Downtime reasons, where available
Machine signals can identify when equipment stops operating. Operator inputs or maintenance records may be needed to determine the actual reason.
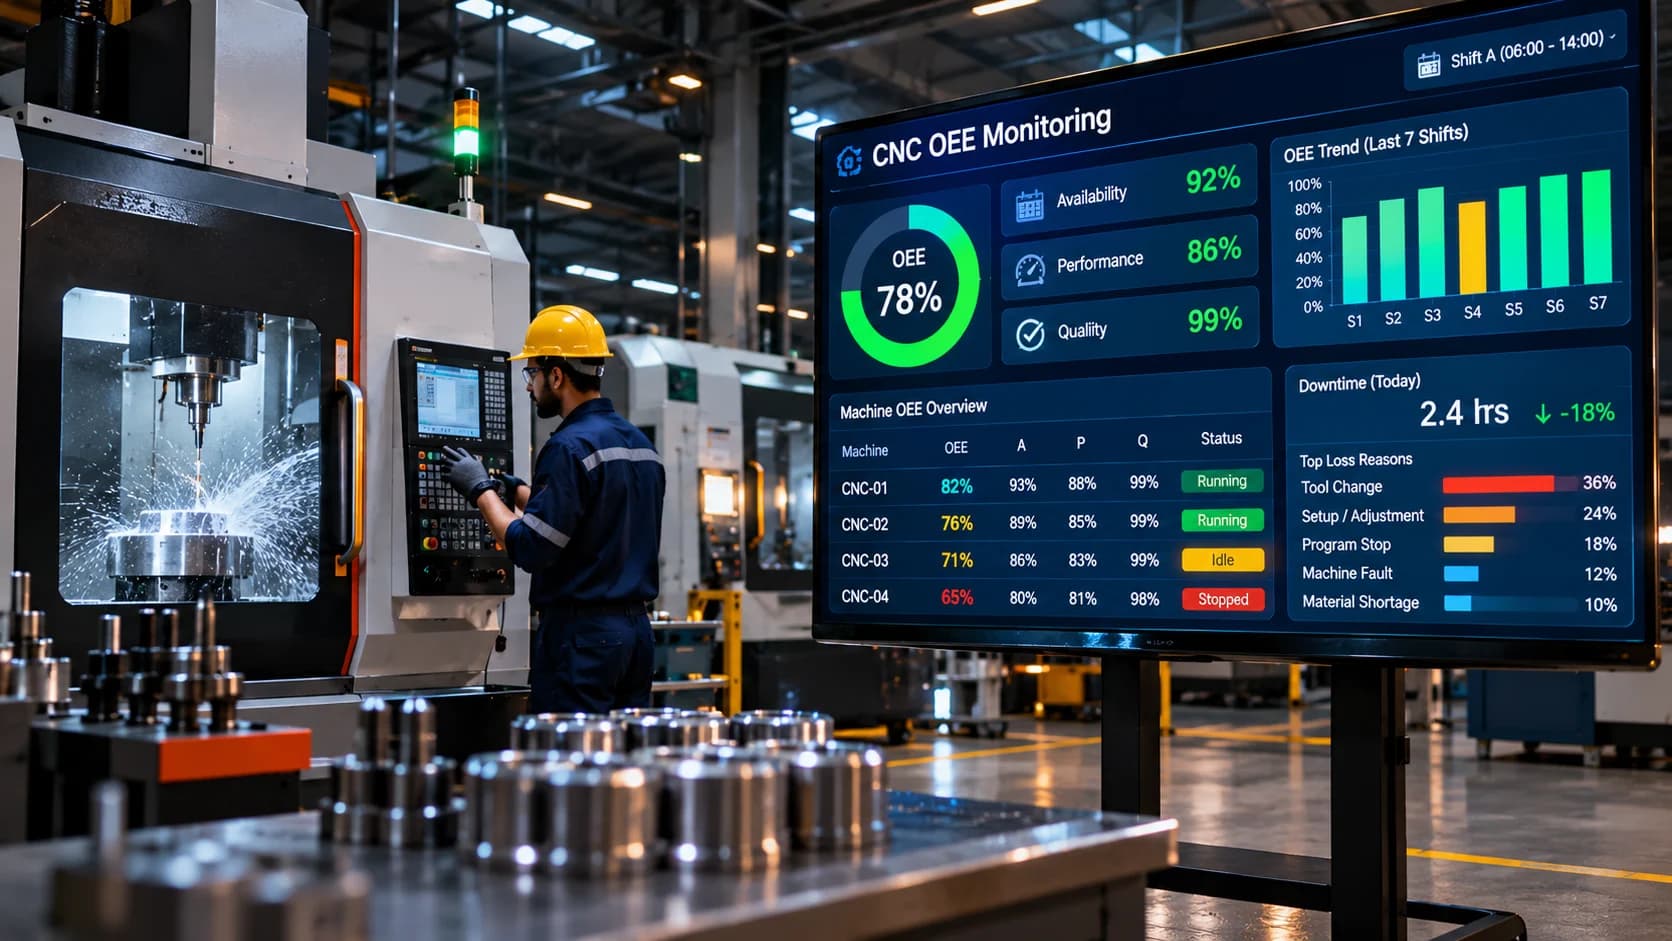
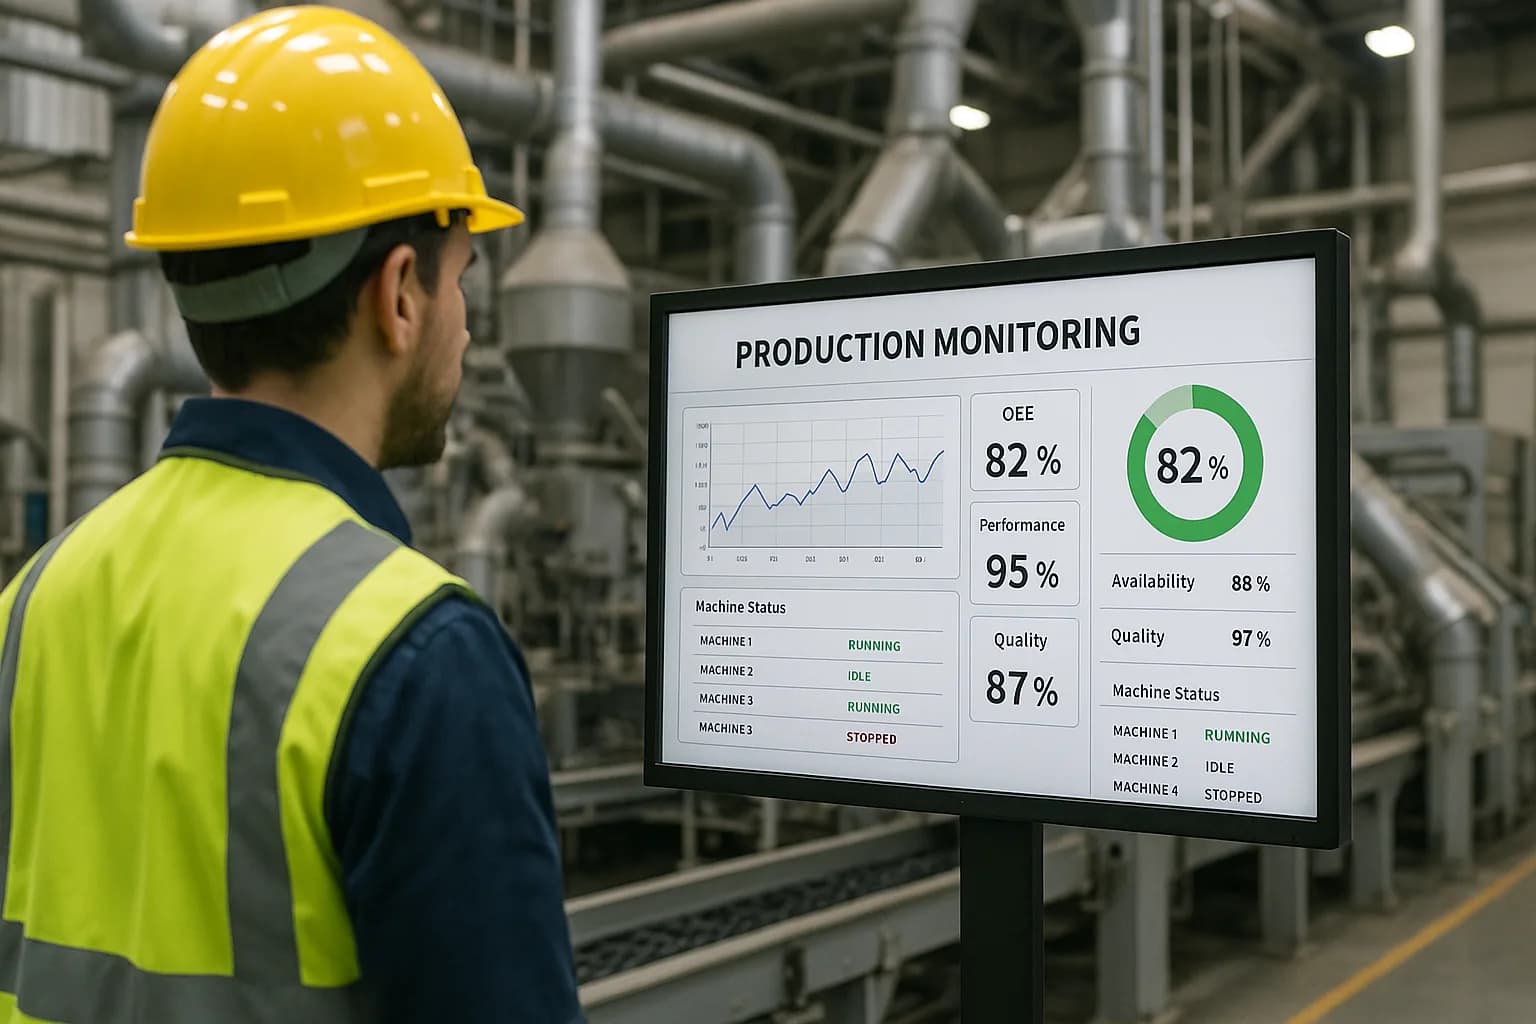
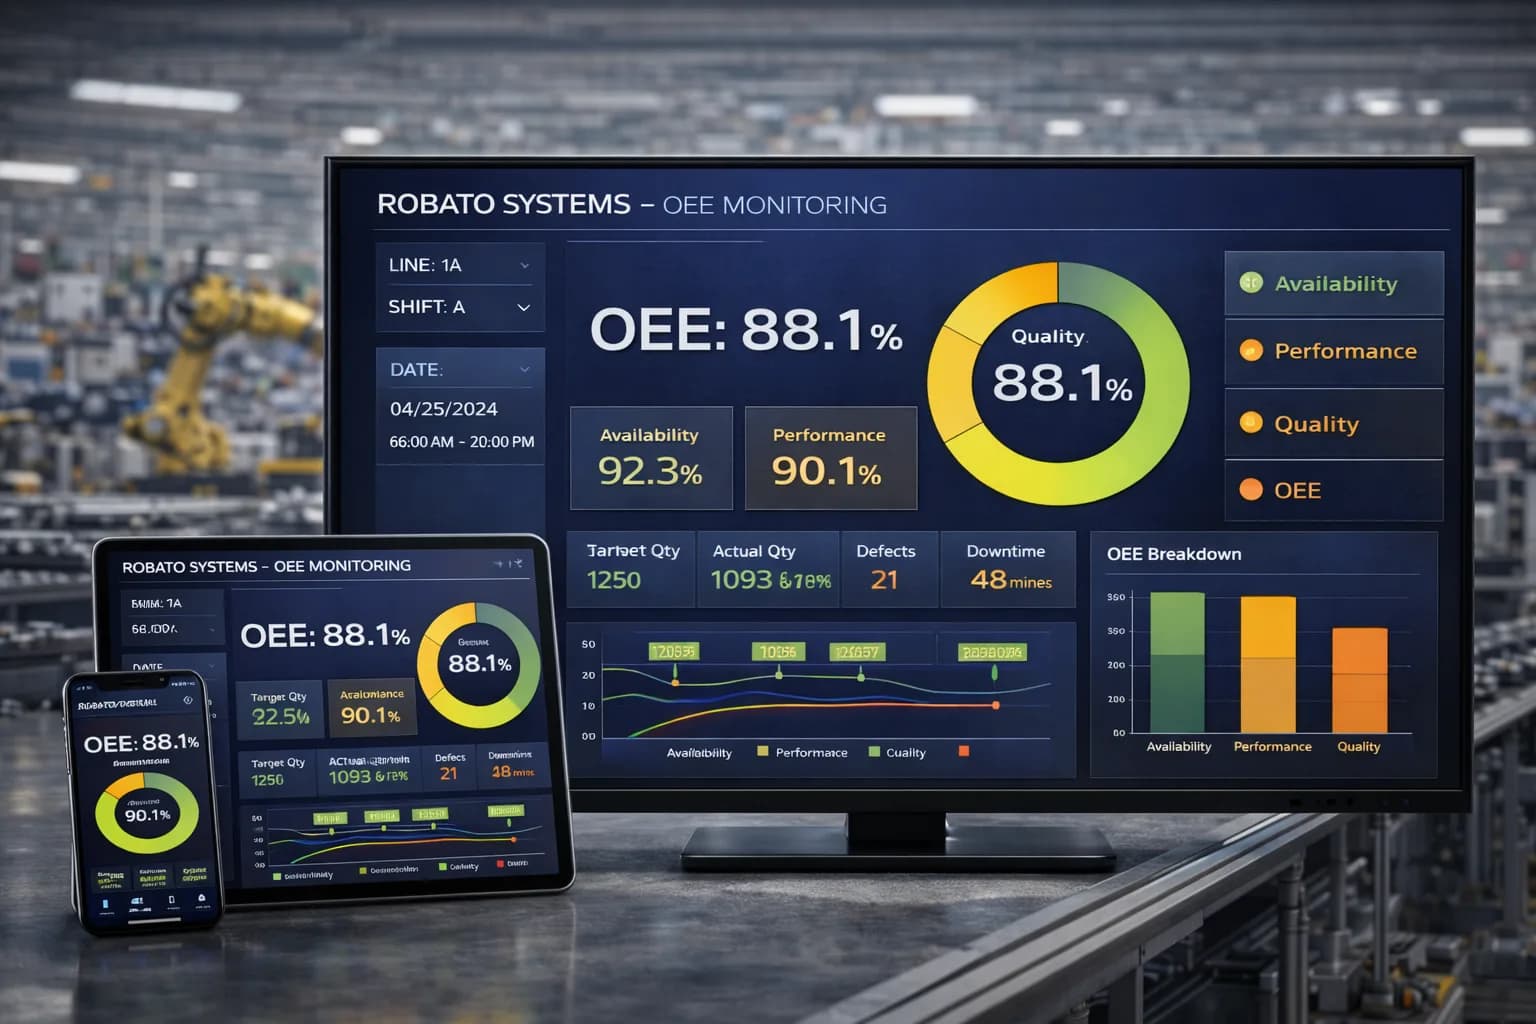
5. OEE Monitoring
Overall Equipment Effectiveness measures manufacturing performance through three components:
Availability
Performance
Quality
A CNC dashboard can display the overall OEE value alongside these individual components.
This helps production teams understand whether performance losses are associated with machine availability, operating speed, or quality.
A dedicated OEE monitoring system can help manufacturers organize these measurements.
6. Machine Alarms and Notifications
Alarm information can help maintenance teams identify equipment conditions that require attention.
A dashboard may display:
Active alarm
Machine identifier
Alarm description
Event timestamp
Alarm duration
Acknowledgement status, where supported
Notifications should be configured according to operational priorities. Too many low-value alerts can make important warnings harder to notice.
7. Historical Production Trends
Historical data helps manufacturers compare performance over different periods.
A dashboard may include:
Hourly production
Shift-wise output
Daily machine utilization
Downtime trends
Cycle-time variation
OEE history
These views help teams identify recurring patterns and evaluate improvement initiatives.
Important KPIs to Display on a CNC Dashboard
Key Performance Indicators provide measurable information about production operations.
The dashboard should prioritize KPIs that align with the factory's operational goals.
| KPI | What It Measures | Why It Matters |
|---|---|---|
| Machine Availability | Available operating time compared with planned production time | Highlights availability losses |
| Machine Utilization | How much of the selected time period the machine is operating | Helps evaluate equipment usage |
| Production Output | Number of components produced | Tracks manufacturing output |
| Target Achievement | Actual output compared with planned output | Identifies production gaps |
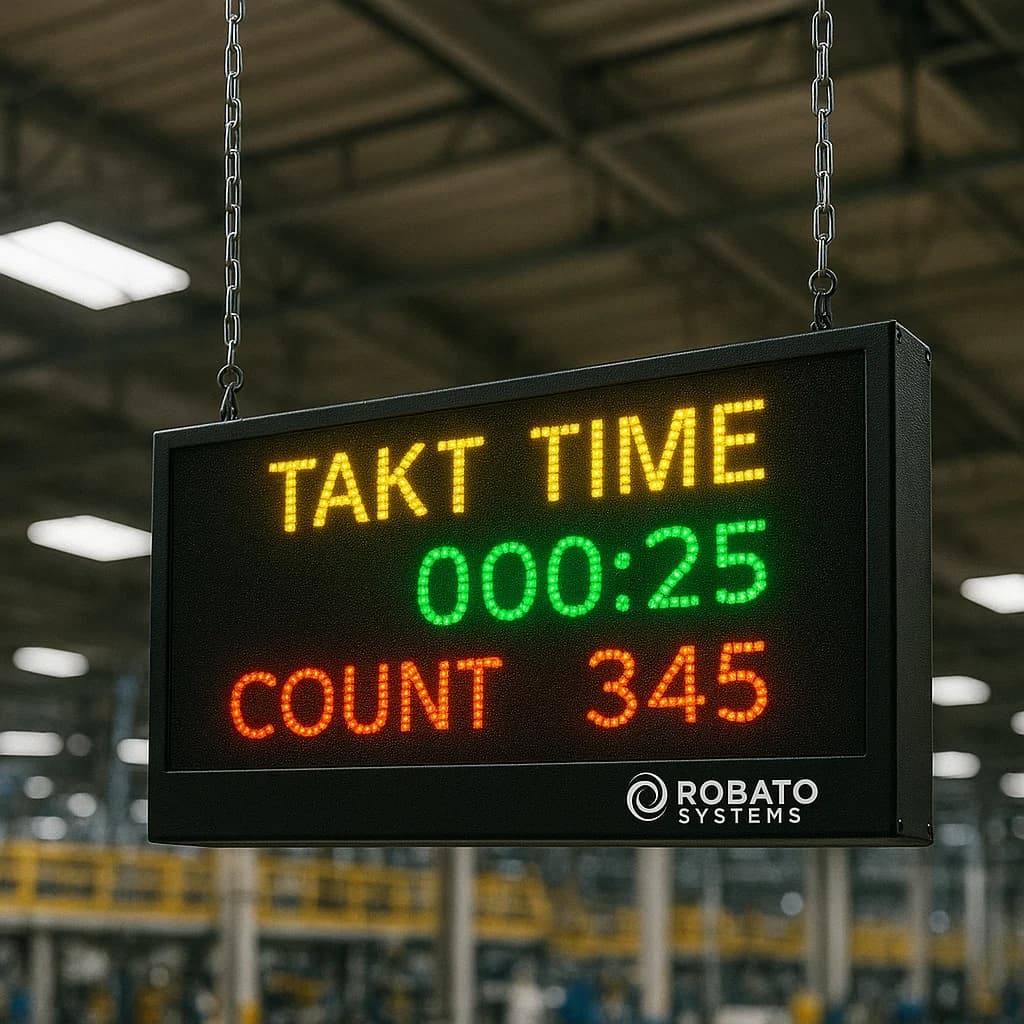
| Cycle Time | Time required to complete a production cycle | Helps evaluate production speed |
| Downtime | Time spent in defined non-producing conditions | Highlights production interruptions |
| OEE | Combined availability, performance, and quality | Provides an overall effectiveness measure |
| Rejection Rate | Rejected parts compared with total production | Tracks quality performance |
1. Machine Availability
Availability measures the proportion of planned production time during which the machine was available to operate.
Formula:
Availability (%) = (Operating Time ÷ Planned Production Time) × 100
For example, if a machine has 420 minutes of operating time during a planned production period of 480 minutes:
Availability = (420 ÷ 480) × 100 = 87.5%
The calculation depends on consistent definitions of planned production time and downtime.
2. Machine Utilization
Utilization measures how much a machine is used during a defined observation period.
One commonly used operational calculation is:
Utilization (%) = (Machine Operating Time ÷ Available Time) × 100
The denominator should be defined clearly. Some factories use scheduled time, while others use a broader available-time window.
Utilization and OEE availability are related but should not automatically be treated as identical.
3. Production Achievement
Production achievement compares actual output against the production target.
Formula:
Production Achievement (%) = (Actual Production ÷ Target Production) × 100
For example, if the target is 500 parts and actual output is 450 parts:
Production Achievement = (450 ÷ 500) × 100 = 90%
4. Cycle Time
Cycle time represents the duration required to complete a production cycle.
A CNC dashboard can compare actual cycle time against the expected cycle time for the relevant part or program.
This comparison is useful for identifying variations in machining performance.
5. Downtime Percentage
A factory may calculate downtime percentage using:
Downtime (%) = (Downtime ÷ Planned Production Time) × 100
The dashboard should clearly define which machine states count as downtime and which are excluded from planned production time.
6. Overall Equipment Effectiveness
OEE combines availability, performance, and quality.
Formula:
OEE = Availability × Performance × Quality
For meaningful OEE reporting, all three components must use consistent time and production definitions.
A dashboard should show the component values alongside the final OEE percentage rather than displaying only one combined number.
Different Types of CNC Dashboards
Not every user needs the same information. Production managers, supervisors, operators, and maintenance teams have different responsibilities.
A useful dashboard design provides role-appropriate information.
1. Machine-Level Dashboard
A machine-level dashboard focuses on an individual CNC machine.
It may display:
Current operating status
Active production program
Production counter
Cycle time
Machine alarms
Selected operating parameters
This view is useful for operators and maintenance personnel.
2. Production-Line Dashboard
A production-line dashboard displays information from multiple machines within a production area.
Typical information includes:
Machine-wise status
Line production output
Target versus actual production
Active stoppages
Shift performance
This helps supervisors understand the condition of an entire production line.
3. Factory-Level Dashboard
A factory-level dashboard provides an overall view of connected production equipment.
It may include:
Total connected machines
Running and stopped machine counts
Total production output
Overall downtime
Department-wise production
OEE summary
Major alerts
This view is useful for plant managers and senior production teams.
4. Maintenance Dashboard
A maintenance dashboard focuses on machine conditions and maintenance-related information.
It may display:
Active machine alarms
Repeated fault conditions
Equipment downtime
Machine operating hours
Maintenance status
Selected condition-monitoring measurements
It can support maintenance investigations and planning when connected to suitable equipment data and maintenance records.
5. Shift-Wise Production Dashboard
A shift dashboard compares production activity across different operating shifts.
It may display:
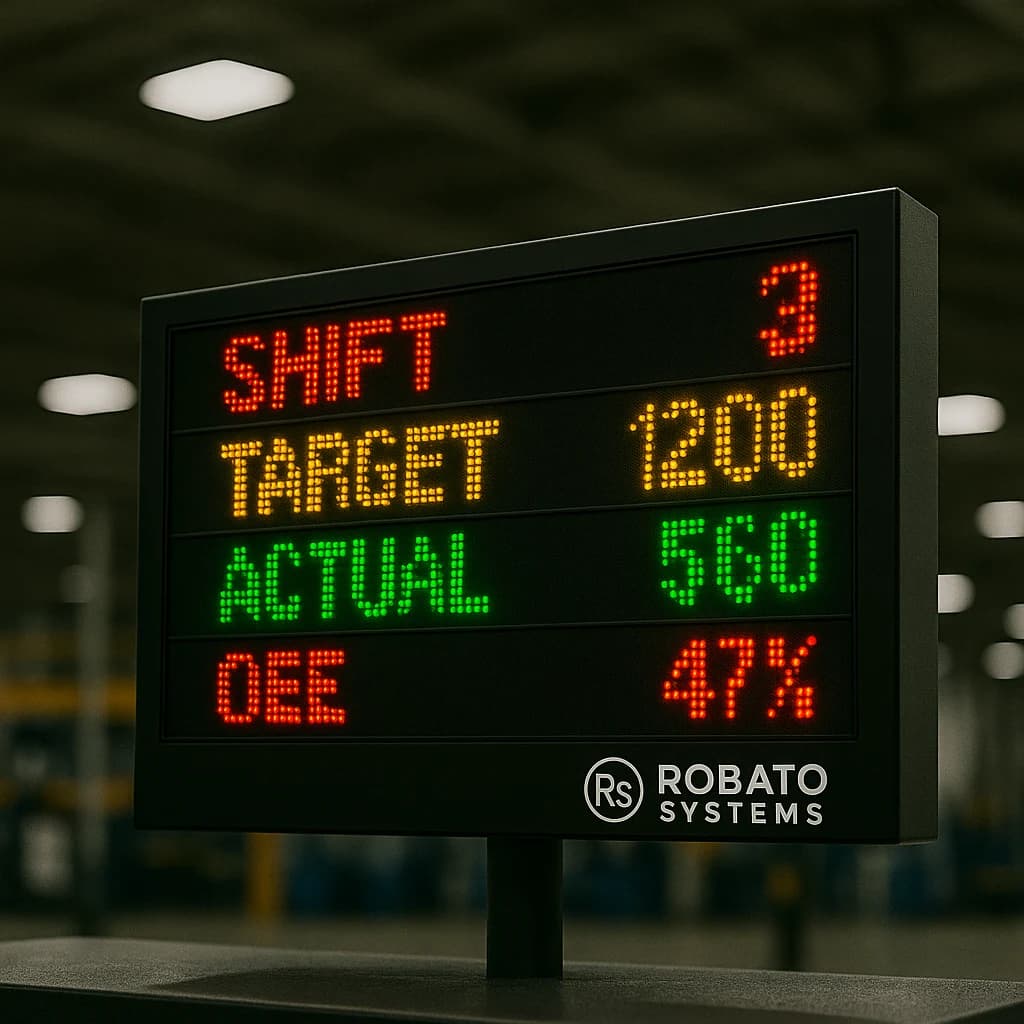
Shift target
Actual production
Machine running time
Downtime duration
Rejected quantity
Shift-wise OEE
This helps management compare performance using consistent reporting periods.
Best Practices for Designing a CNC Dashboard
An effective dashboard should make important information easy to understand.
Displaying too many numbers, charts, and indicators can make the interface difficult to use.
The following practices help create a clear and useful CNC monitoring dashboard.
1. Keep the Most Important Information Visible
Place critical machine and production information near the top of the dashboard.
For example:
Total connected machines
Running machines
Stopped machines
Current production output
Active alarms
Overall OEE
Users should not need to navigate through several screens to understand the current production situation.
2. Use Consistent Status Indicators
Machine states should use consistent labels and visual indicators across the entire factory.
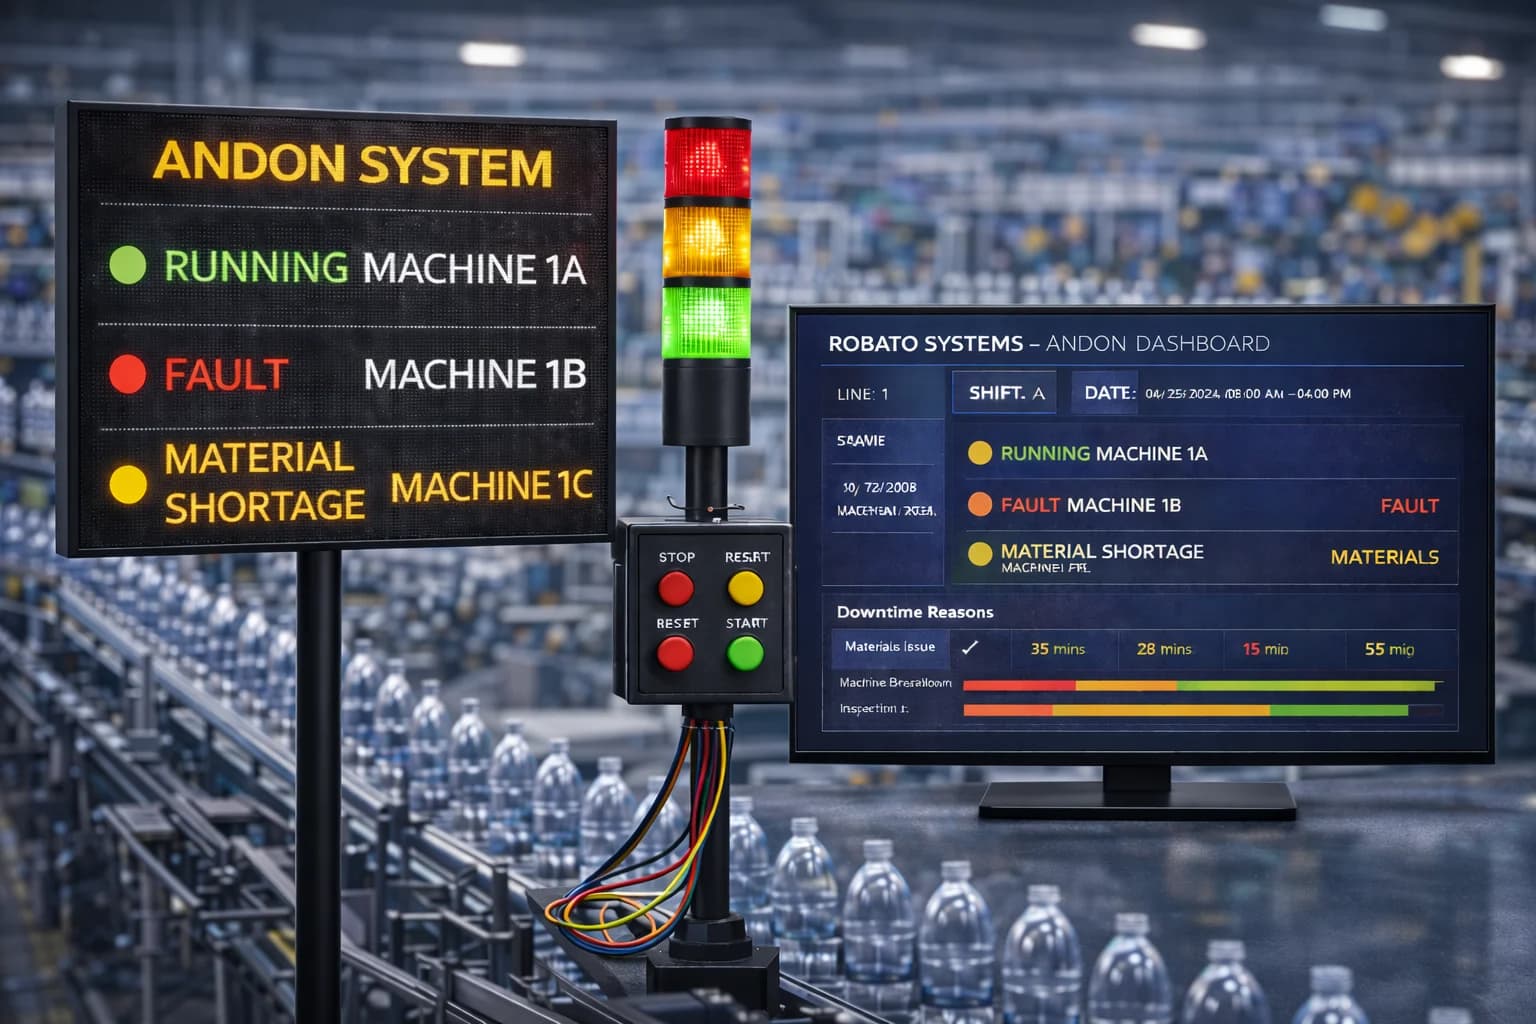
For example:
Green for running
Yellow for idle or attention required
Red for alarm or fault
Grey for disconnected or unavailable
These are suggested visual conventions, not universal machine-state definitions. The dashboard legend should explain what each status means.
3. Avoid Information Overload
Do not display every available controller variable on the main dashboard.
Prioritize the information needed for daily production decisions.
Detailed technical parameters can be placed in machine-specific views.
4. Make Production Targets Easy to Compare
Display actual production alongside the planned target.
Progress indicators and clear numerical comparisons can help supervisors understand production gaps quickly.
5. Include Relevant Time Filters
Allow users to review information across useful reporting periods.
Common options include:
Current shift
Previous shift
Today
Yesterday
Last seven days
Custom date range
Time filters should use consistent shift boundaries and reporting rules.
6. Show Data Freshness
A dashboard should indicate when machine information was last updated.
This helps users distinguish between current machine status and potentially outdated information caused by communication interruptions.
7. Design for Different Screen Sizes
Manufacturing dashboards may be displayed on desktop monitors, control-room screens, tablets, and Smart TVs.
Use responsive layouts and readable typography.
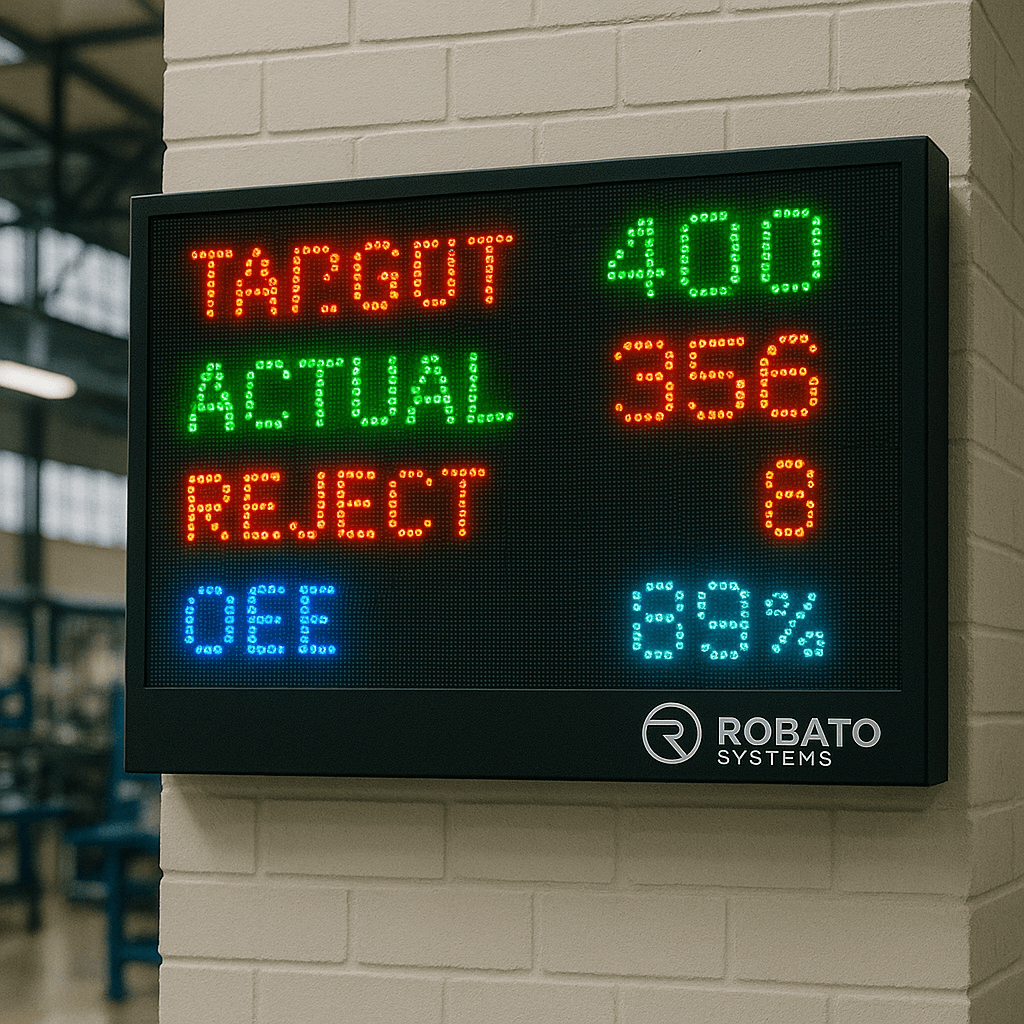
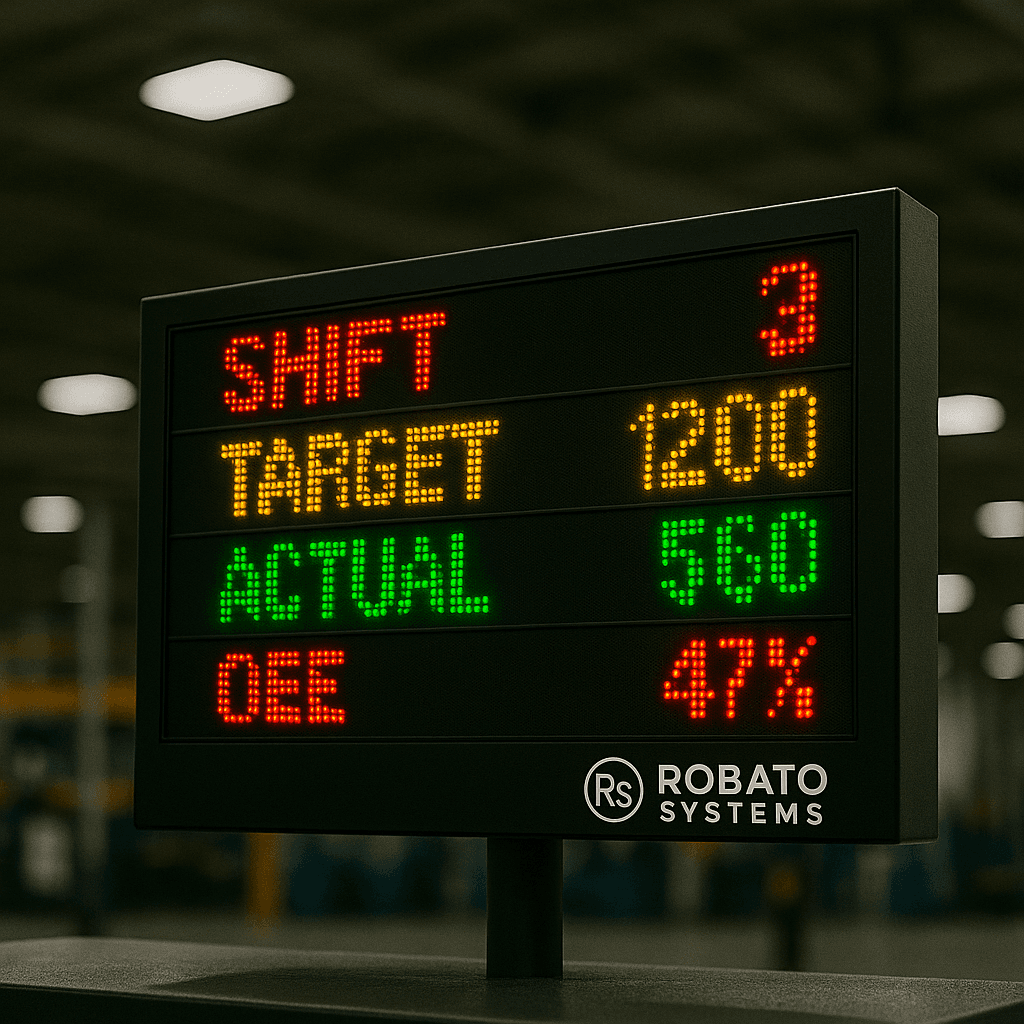
For large factory displays, prioritize visibility from a distance and avoid small text or dense tables.
8. Make Important Alerts Noticeable
Critical machine alarms and production interruptions should be visually distinguishable from routine information.
Avoid excessive notifications that create alert fatigue.
9. Use Clear Labels and Units
Every metric should have a clear name, unit, and calculation definition.
For example, cycle time should specify whether it is measured in seconds or minutes, and production quantity should clearly identify the reporting period.
10. Validate Data Before Displaying KPIs
A visually attractive dashboard cannot compensate for incorrect machine data.
Validate counters, machine-state mappings, timestamps, and calculation rules before using the information for production decisions.
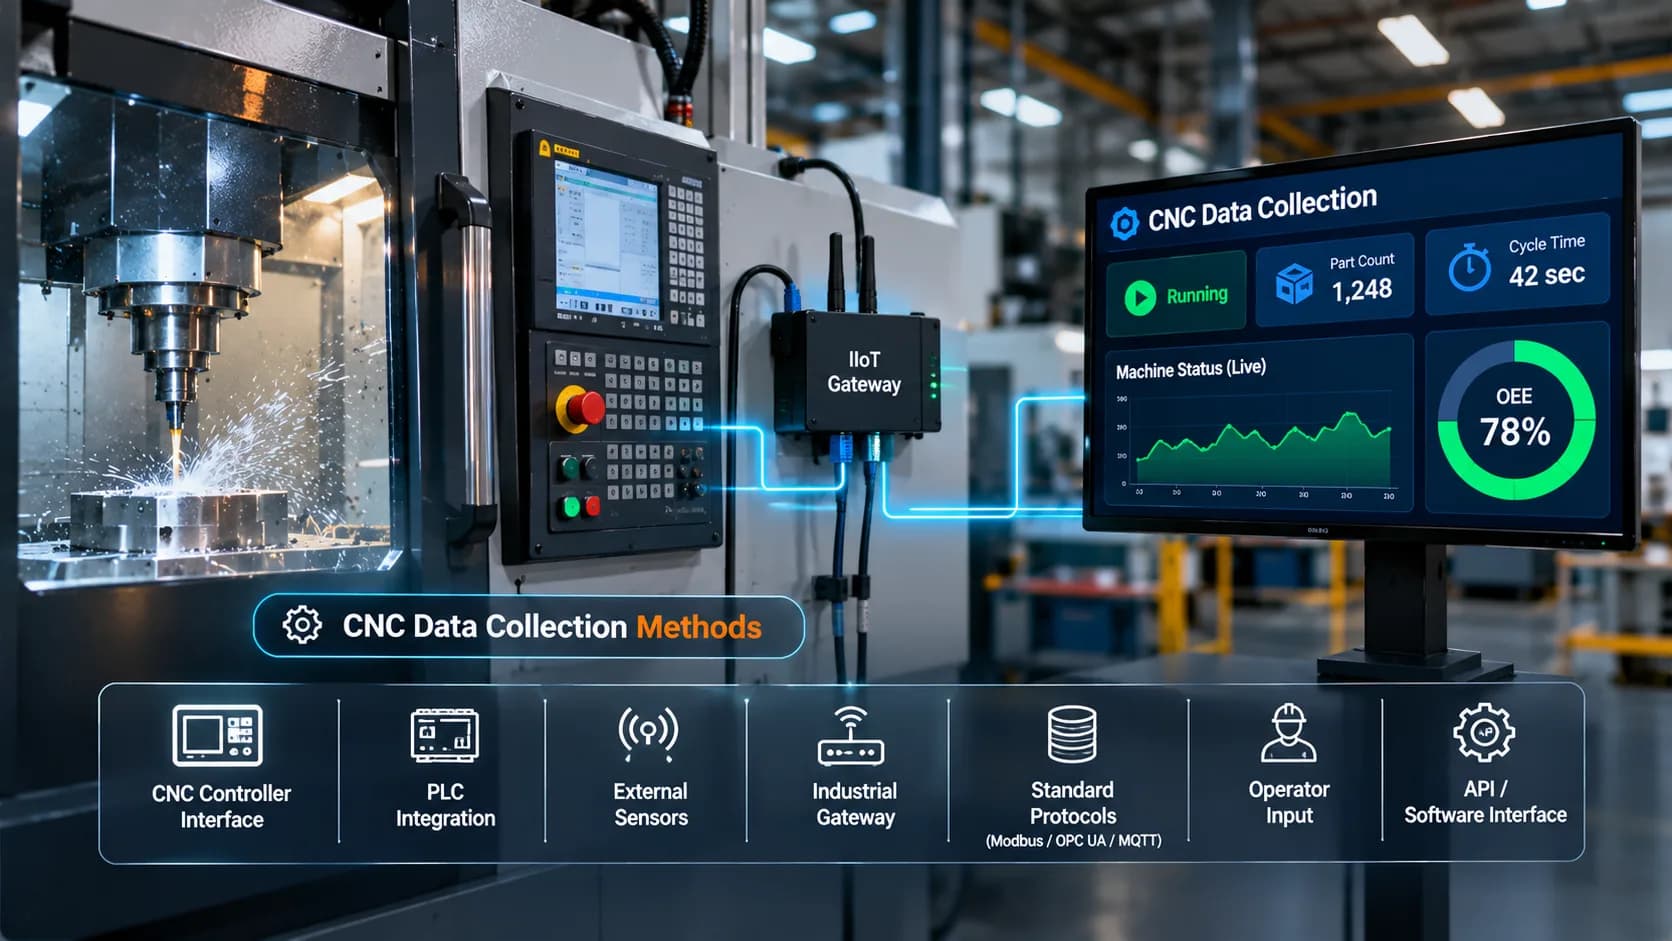
How Real-Time CNC Dashboards Collect Machine Data
A CNC dashboard depends on a reliable data collection architecture.
Information may come from different sources depending on machine connectivity and the required monitoring details.
1. CNC Controller Integration
Where supported, the controller can provide machine information through native communication interfaces or compatible data-access options.
This may include machine status, program information, alarms, spindle readings, and production counters.
2. PLC Integration
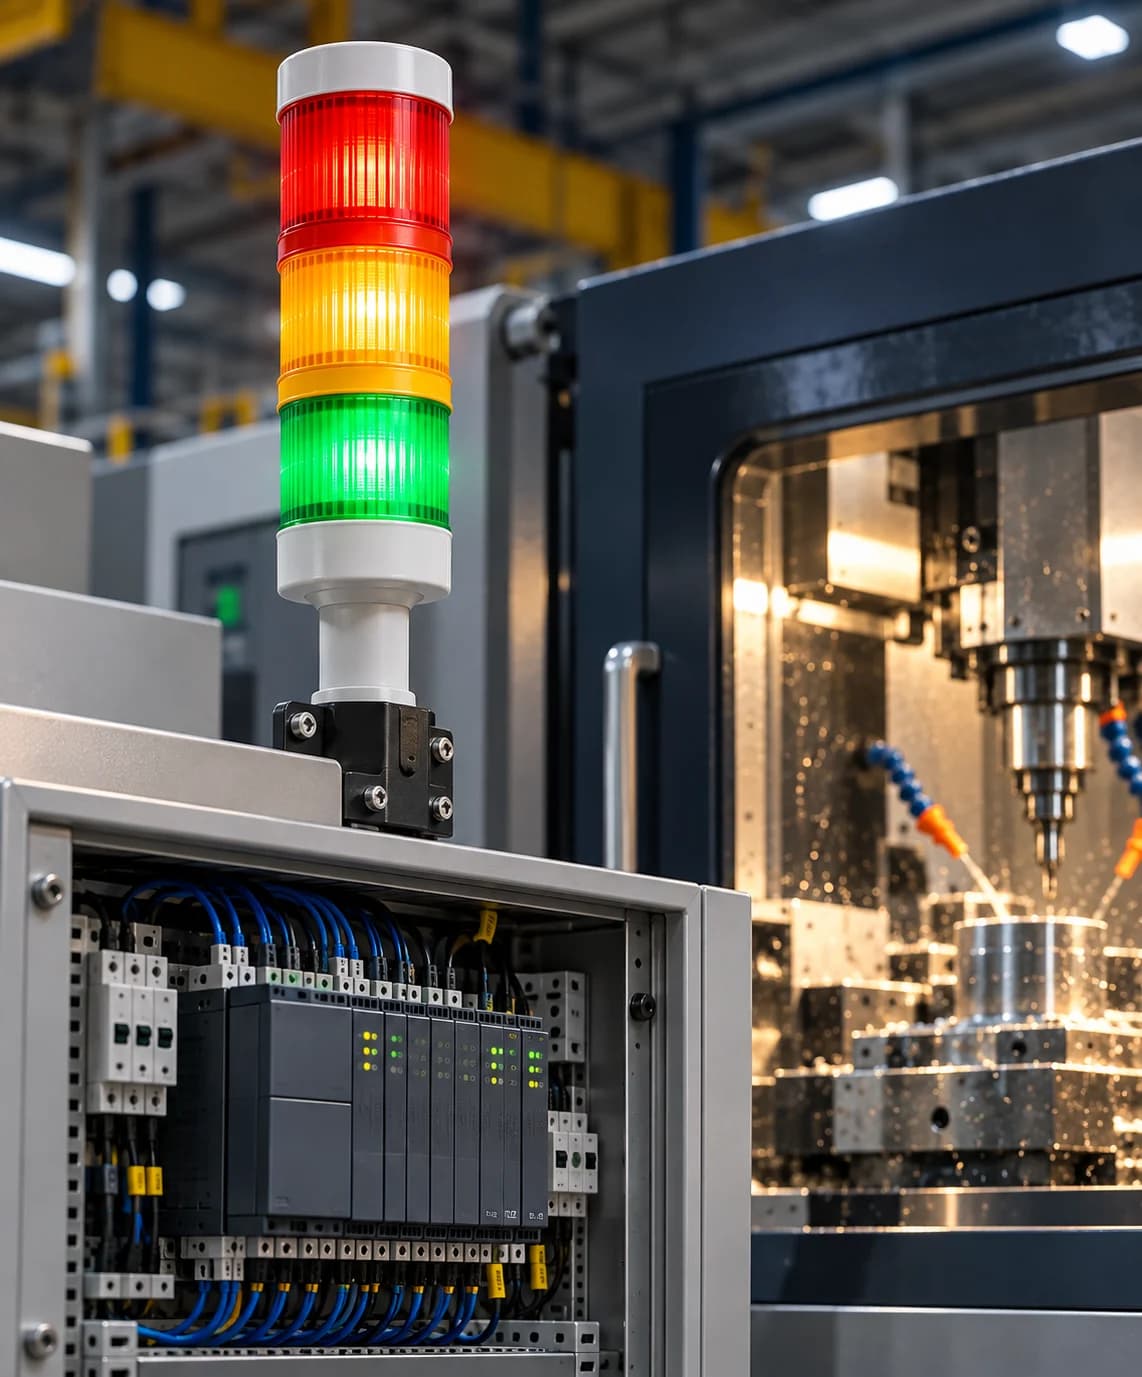
PLCs can expose machine signals such as cycle active, cycle complete, machine fault, and part detection.
A compatible gateway or monitoring application can collect these values.
3. Sensor-Based Data Collection
External sensors can provide information from machines that do not expose sufficient controller data.
For example, an optical sensor may detect completed parts, while a current sensor can provide information about electrical load.
Sensor readings must be validated before they are used as production or machine-state indicators.
4. Industrial IoT Gateways
Gateways collect information from different machine interfaces and transfer it to monitoring applications.
They may support protocol conversion, data mapping, local buffering, and timestamp handling.
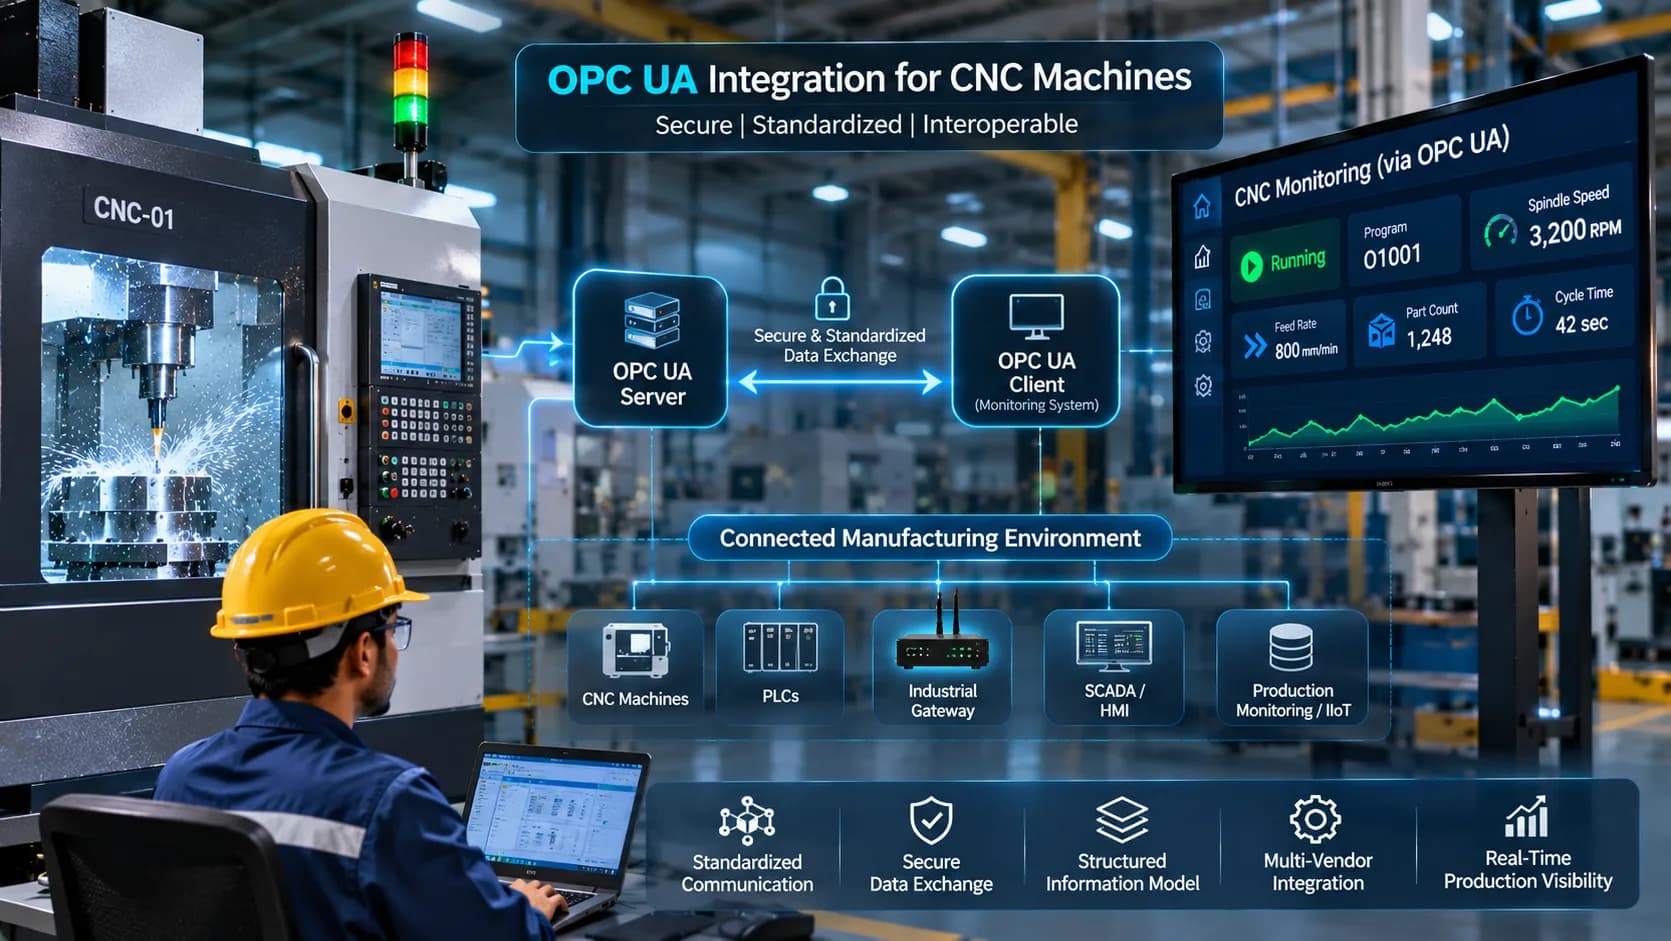
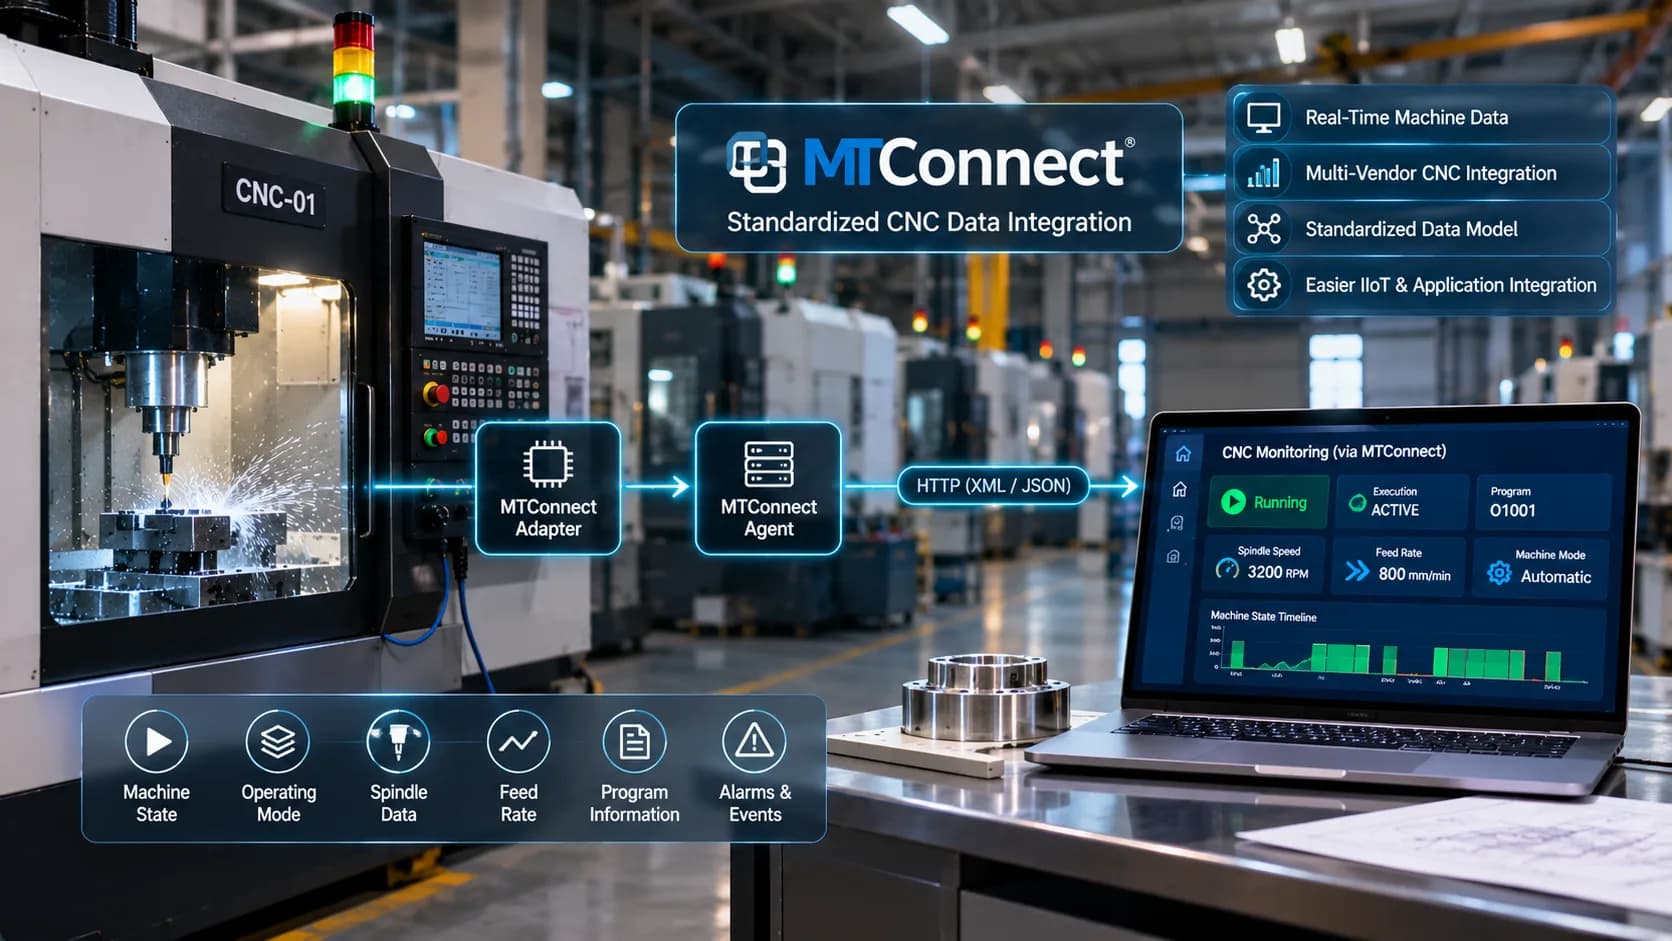
5. Communication Protocols
Depending on equipment compatibility, machine data may be accessed through:
MTConnect
OPC UA
Modbus
MQTT
Controller-specific communication interfaces
These technologies serve different purposes and may be used together in the same architecture.
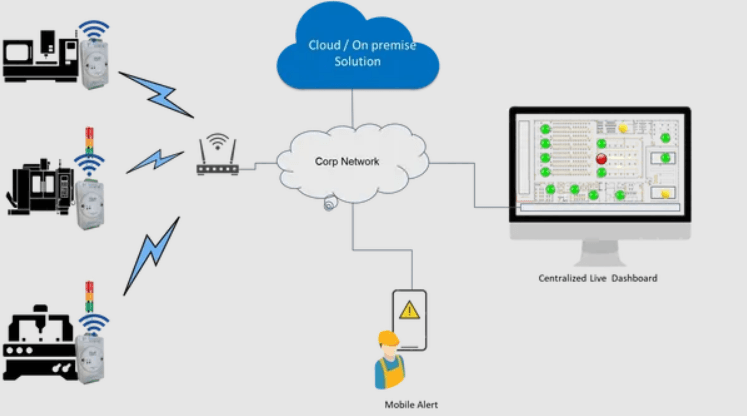
CNC Dashboard Architecture for an IIoT-Based Factory
A typical CNC monitoring architecture connects shop-floor equipment to a centralized data platform.
CNC Machines → PLCs and Sensors → Industrial IoT Gateway → Monitoring Platform → CNC Dashboard
Machine and Controller Layer
This layer contains CNC machines and their controllers, which generate operational information.
Data Acquisition Layer
PLCs, sensors, and compatible communication interfaces collect machine-level information.
Gateway Layer
Industrial gateways process and transmit the collected information.
Data Platform Layer
The monitoring platform stores and organizes information by machine, time, production shift, and other relevant production context.
Dashboard Layer
The dashboard presents live machine status, production KPIs, downtime information, alerts, and historical trends.
A connected production monitoring software platform can help consolidate this information into a centralized monitoring environment.
Common CNC Dashboard Implementation Challenges
Implementing a CNC dashboard requires attention to data quality, connectivity, and usability.
1. Different Machine Controllers
Different CNC machines may provide different signals, protocols, and data formats.
Solution: Use a flexible integration architecture and standardize machine identifiers, operating states, and production metrics.
2. Inaccurate Production Counts
A controller counter may represent machining cycles rather than accepted components.
Solution: Confirm how production is counted and account for multi-part cycles, rejected components, and counter resets.
3. Missing Machine Data
Some machines may not expose the information required for monitoring.
Solution: Evaluate PLC signals, additional sensors, and compatible data acquisition devices.
4. Network Interruptions
Communication failures can leave dashboards displaying outdated machine information.
Solution: Monitor connection health, use suitable buffering mechanisms, and clearly identify stale or unavailable data.
5. Inconsistent KPI Definitions
Different departments may calculate utilization, downtime, or production achievement differently.
Solution: Define common KPI formulas, time boundaries, and production rules before dashboard deployment.
6. Poor Dashboard Usability
A dashboard with too many metrics can make important information difficult to identify.
Solution: Design views according to user roles and operational requirements.
7. Incomplete Downtime Reasons
Automatic machine-state detection may identify stoppages without identifying their causes.
Solution: Combine machine signals with operator-entered downtime reasons and maintenance records.
How to Implement a CNC Dashboard in a Manufacturing Facility
A structured implementation process helps ensure that the dashboard displays useful and reliable information.
Step 1: Identify Monitoring Requirements
Understand what production managers, supervisors, operators, and maintenance teams need to monitor.
Start with essential information such as machine status, production count, downtime, and cycle time.
Step 2: Audit CNC Machine Connectivity
Prepare an inventory of CNC machines and identify their controller models, available interfaces, PLCs, and sensors.
This helps determine the appropriate data collection method for each machine.
Step 3: Select the Data Collection Architecture
Choose controller integration, PLC-based collection, sensor-based acquisition, or a combination of methods.
Verify protocol compatibility and network requirements.
Step 4: Define KPIs and Calculation Rules
Document the formulas and definitions for:
Machine availability
Utilization
Production achievement
Cycle time
Downtime
OEE
Ensure that different machines and departments follow consistent reporting rules.
Step 5: Connect Machines to the Monitoring Platform
Configure gateways, communication interfaces, and machine data mappings.
Assign unique machine identifiers so that the platform can distinguish between equipment.
Step 6: Design Dashboard Views
Create dashboard layouts according to the needs of different users.
A factory-level dashboard may focus on overall production, while machine-level screens may show detailed operating information.
Step 7: Validate Data Accuracy
Compare dashboard readings with actual machine activity and production records.
Test machine-state changes, production counters, shift calculations, and downtime reporting.
Step 8: Train Users
Ensure supervisors and operators understand the dashboard indicators, filters, and reporting rules.
Step 9: Review and Improve
Review dashboard usage and KPI relevance regularly.
Remove unnecessary information, improve unclear visualizations, and add new metrics when they support a genuine operational requirement.
Cloud vs. On-Premise CNC Dashboard
CNC dashboards can operate through cloud-based or on-premise monitoring platforms.
The appropriate deployment depends on factory infrastructure, security requirements, data policies, and accessibility needs.
Cloud-Based CNC Dashboard
A cloud-based dashboard receives selected machine information through an approved network connection and displays it through a cloud-hosted application.
Potential advantages include:
Centralized monitoring across multiple factory locations
Remote access for authorized users
Consolidated production reporting
Flexible application expansion
Centralized historical data
A suitable cloud production monitoring solution can support centralized access to connected production information.
On-Premise CNC Dashboard
An on-premise dashboard processes and stores machine information within the factory's local infrastructure.
It may be appropriate for manufacturers with strict data policies, restricted internet access, or specific IT requirements.
Both approaches can provide machine visibility. The final selection should be based on operational requirements and security policies.
How CNC Dashboards Support OEE and Productivity Improvement
A CNC dashboard provides the visibility needed to understand production performance.
When machine information is collected accurately, manufacturers can use dashboard metrics to investigate production losses and identify improvement opportunities.
Identifying Availability Losses
Machine status and downtime information help reveal how much planned production time is lost due to stoppages.
Identifying Performance Losses
Cycle-time comparisons and production counts help identify situations where actual production is below expected output.
Identifying Quality Losses
Quality records and rejection information help determine how much production does not meet required specifications.
Comparing Machines and Shifts
Machine-wise and shift-wise dashboards can highlight performance differences across equipment and production teams.
Supporting Continuous Improvement
Historical trends help production teams evaluate whether process changes and corrective actions are improving performance.
The dashboard should support investigation and decision-making rather than automatically assuming that every difference in KPI values has the same cause.
Frequently Asked Questions About CNC Dashboards
1. What is a CNC dashboard?
A CNC dashboard is a visual interface that displays machine status, production output, downtime, cycle time, and other operational information collected from CNC machines.
2. What should a CNC monitoring dashboard display?
A useful CNC monitoring dashboard should display machine operating status, production counts, target versus actual output, downtime, cycle time, alarms, and relevant OEE indicators.
3. Can a CNC dashboard monitor multiple machines?
Yes. A centralized monitoring platform can collect information from multiple connected CNC machines and display their status and production performance through a common dashboard.
4. How does a CNC dashboard collect machine data?
Machine information can be collected through CNC controller interfaces, PLCs, sensors, industrial gateways, and supported communication technologies such as MTConnect and OPC UA.
5. Can a CNC dashboard show real-time machine status?
Yes. When machine signals and communication systems are configured correctly, the dashboard can display updated machine status. Actual update speed depends on data collection frequency, network performance, and system configuration.
6. What is the difference between a CNC dashboard and CNC monitoring software?
A CNC dashboard is the visual interface used to display machine and production information. CNC monitoring software is the broader application that collects, processes, stores, analyses, and presents that information.
7. Can a CNC dashboard calculate OEE?
Yes. A CNC dashboard can display OEE when the required availability, performance, and quality information is available and calculated using consistent definitions.
8. Can older CNC machines be connected to a dashboard?
Yes. Older machines may be connected through PLC signals, external sensors, serial interfaces, or suitable industrial gateways, depending on their available interfaces.
9. Can a CNC dashboard be displayed on a Smart TV?
Yes. A dashboard designed for large-screen display can be shown on a compatible Smart TV or connected display device, depending on the monitoring platform and supported display environment.
10. Is a cloud-based CNC dashboard better than an on-premise dashboard?
Neither option is universally better. Cloud-based systems can support centralized remote monitoring, while on-premise systems may suit factories with local data-storage or connectivity requirements. The right choice depends on the organization's infrastructure and policies.
Conclusion
A CNC dashboard is an important tool for manufacturers seeking better visibility into machine operations and production performance. By bringing machine status, production counts, downtime, cycle time, and OEE information into one interface, it helps production teams understand factory activity more clearly.
However, an effective dashboard depends on accurate machine data, consistent KPI definitions, reliable connectivity, and thoughtful visualization.
Manufacturers should begin with essential production metrics, validate their data sources, and design dashboard views around the needs of different users. As machine connectivity expands, the dashboard can evolve to support more advanced reporting and production analysis.
Explore Robato Systems' production monitoring solutions to understand how connected machine information can support centralized dashboards, production visibility, and smarter manufacturing operations.