CNC OEE Monitoring Explained: How to Measure and Improve CNC Machine Effectiveness
CNC machines are essential to modern manufacturing because they deliver precision, repeatability, and consistent production quality. However, owning advanced CNC equipment does not automatically mean that machines are being used effectively.
A CNC machine may be available but experience frequent stoppages. It may operate throughout a shift but produce fewer components than expected. Even when production targets are achieved, rejected parts and rework can reduce the actual value of manufacturing output.
These losses are not always visible through production counts alone. Manufacturers need a structured way to understand how much planned production time is being lost, whether machines are operating at their expected speed, and how much output meets quality requirements.
This is where CNC OEE monitoring becomes important.
Overall Equipment Effectiveness (OEE) is a manufacturing performance measurement that combines three factors: Availability, Performance, and Quality. By monitoring these factors together, manufacturers can identify where CNC machines are losing productive capacity and which improvements deserve attention.
A properly configured CNC OEE monitoring system turns machine and production data into measurable performance indicators. It helps production managers, operators, and maintenance teams move beyond basic output reporting and understand the actual effectiveness of their machining operations.
This guide explains the OEE formula, its three components, how to calculate CNC OEE, which losses to monitor, and how manufacturers can implement an effective OEE monitoring system.
What Is CNC OEE Monitoring?
CNC OEE monitoring is the process of measuring and analyzing the Overall Equipment Effectiveness of CNC machines using production, operating-time, downtime, and quality information.
OEE provides a combined measurement of how effectively planned production time is being used to manufacture good-quality components.
It consists of three key factors:
Availability: How much of the planned production time the machine actually operates.
Performance: Whether the machine operates at its expected production speed.
Quality: What proportion of the produced components meet quality requirements.
For example, a CNC milling machine may operate for most of its scheduled shift but experience several stoppages and produce some rejected components. Looking only at its production count may hide these losses.
OEE brings the different factors together into one percentage, helping manufacturers understand the overall effectiveness of the machine.
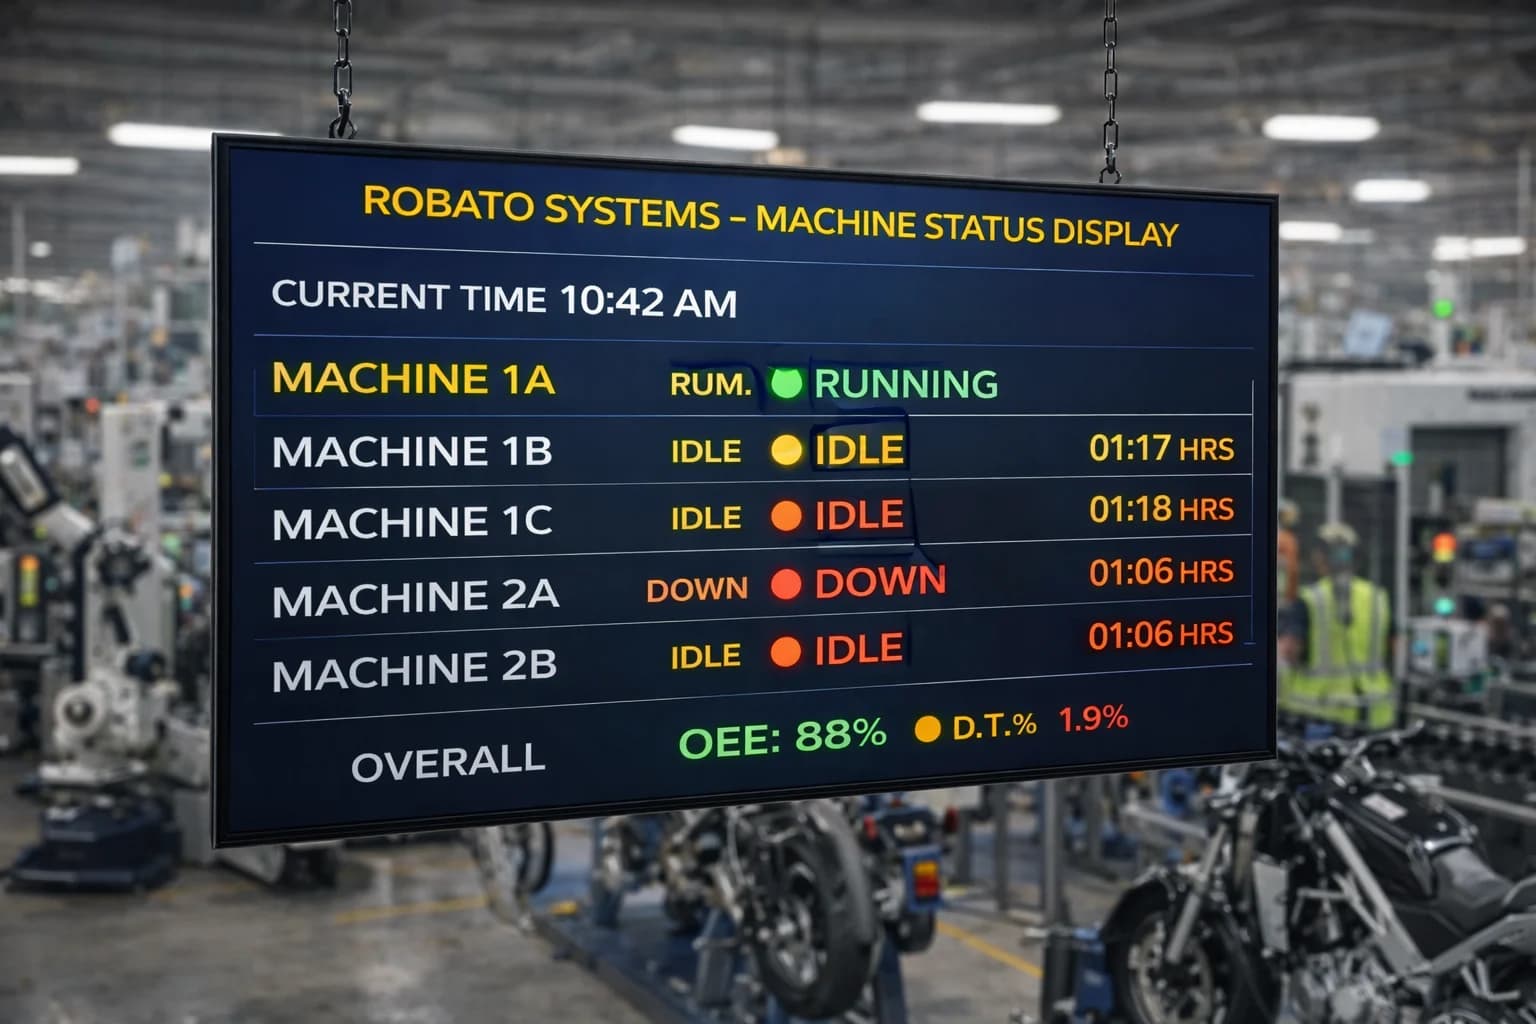
A dedicated OEE Monitoring System can collect production counts, PLC data, downtime records, and quality information to calculate Availability, Performance, and Quality across individual machines, production lines, and plants.
Why Is OEE Important for CNC Manufacturing?
CNC manufacturing involves several variables that can influence production performance. Tool changes, setup time, machine faults, program adjustments, material availability, cycle-time variations, and quality issues can all affect output.
Without a consistent performance measurement, manufacturers may know how many components were produced but not understand why the machine performed below its expected capacity.
1. Identify Hidden Production Losses
A machine can appear busy while losing valuable production time through small stoppages, longer cycle times, and repeated adjustments.
OEE helps separate these losses into measurable categories so teams can investigate the most significant problems.
2. Understand Actual Machine Effectiveness
Production quantity alone does not provide a complete picture of machine performance.
For example, two CNC machines may produce 500 components each, but one may have operated with fewer stoppages and a lower rejection rate.
OEE helps compare machine effectiveness using a common measurement framework, provided the production conditions and calculation rules are consistent.
3. Improve Production Planning
Reliable OEE information helps manufacturers understand the productive capacity of their existing equipment.
Production planners can use historical availability, performance, and quality information to make more informed decisions about job scheduling, production targets, and machine allocation.
4. Support Maintenance Priorities
Low availability may indicate frequent machine breakdowns, prolonged repairs, or repeated stoppages.
OEE records help maintenance teams understand how equipment interruptions affect production and prioritize investigations accordingly.
5. Improve Quality Performance
Quality is an important part of OEE because producing more components does not necessarily mean producing more usable components.
Tracking good parts and rejected parts helps manufacturers identify quality losses that may be associated with machining processes, tooling, setup, material, or other factors.
Understanding the Three Components of CNC OEE
OEE is calculated by multiplying Availability, Performance, and Quality.
Each component measures a different type of production loss.
1. Availability
Availability measures how much of the planned production time a CNC machine was actually running.
It helps manufacturers understand the effect of downtime on available machining time.
Availability Formula:
Availability (%) = (Operating Time ÷ Planned Production Time) × 100
Where:
Planned Production Time is the time scheduled for production.
Operating Time is the planned production time remaining after subtracting downtime included in the OEE calculation.
Example of CNC Machine Availability
Suppose a CNC turning machine is scheduled to operate for 480 minutes during a shift.
During the shift, it records 60 minutes of downtime due to machine-related stoppages.
| Particulars | Time |
|---|---|
| Planned production time | 480 minutes |
| Recorded downtime | 60 minutes |
| Actual operating time | 420 minutes |
Availability = (420 ÷ 480) × 100
Availability = 87.5%
This means the CNC machine was available for production during 87.5% of its planned production time.
Common Causes of CNC Availability Losses
Mechanical breakdowns
Electrical faults
Tool changes included in the downtime rules
Machine setup and adjustment
Unexpected machine stoppages
Waiting for maintenance
Material shortages, when classified as production downtime
Not every stopped period must be treated identically. Manufacturers should define planned production time and downtime categories consistently before calculating OEE.
2. Performance
Performance measures how efficiently a CNC machine operates while it is running.
It compares the actual production output with the theoretical output possible at the ideal cycle time.
A machine may have high availability but still produce fewer components than expected because of slower machining cycles, reduced feed rates, or frequent minor interruptions.
Performance Formula:
Performance (%) = (Ideal Cycle Time × Total Production Count ÷ Operating Time) × 100
Where:
Ideal Cycle Time is the expected time required to produce one component under defined conditions.
Total Production Count includes all produced components, including rejected components.
Operating Time is the actual time the machine was running.
Example of CNC Machine Performance
Suppose a CNC machine has the following production information:
| Particulars | Value |
|---|---|
| Ideal cycle time | 2 minutes per component |
| Total production | 180 components |
| Operating time | 420 minutes |
Performance = (2 × 180 ÷ 420) × 100
Performance = 85.71%
This indicates that the machine achieved approximately 85.71% of its theoretical production speed during its operating time.
Common Causes of CNC Performance Losses
Longer-than-expected machining cycles
Reduced cutting speeds or feed rates
Tool wear affecting machining speed
Minor machine interruptions
Frequent cycle resets
Program-related delays
Operator-related production delays
Ideal cycle time should be established for the relevant part, machine, and machining program. Using an unrealistic cycle-time target can make OEE results misleading.
3. Quality
Quality measures the proportion of produced components that meet the required quality standards.
It distinguishes good production from rejected or defective output.
Quality Formula:
Quality (%) = (Good Parts ÷ Total Production Count) × 100
Where:
Good Parts are components that meet the defined quality requirements.
Total Production Count includes both good and rejected components.
Example of CNC Machine Quality
Suppose a CNC milling machine produces 180 components during a shift.
Out of these:
Good components: 171
Rejected components: 9
Quality = (171 ÷ 180) × 100
Quality = 95%
This means 95% of the produced components met the defined quality requirements.
Common Causes of CNC Quality Losses
Incorrect machining dimensions
Tool wear or tool breakage
Incorrect tool offsets
Improper machine setup
Material inconsistencies
Programming errors
Surface-finish defects
Components requiring rejection or rework
Manufacturers should define whether reworked parts count as good only after successful rework. The quality rules must be consistent across machines and reporting periods.
How to Calculate CNC OEE: Complete Example
Once Availability, Performance, and Quality have been calculated, they can be combined to determine the overall OEE percentage.
OEE Formula:
OEE (%) = Availability × Performance × Quality
All three values must be expressed as percentages or decimal values consistently.
Consider a CNC machining centre operating under the following conditions during one shift:
| Particulars | Value |
|---|---|
| Planned production time | 480 minutes |
| Downtime | 60 minutes |
| Operating time | 420 minutes |
| Ideal cycle time | 2 minutes |
| Total production | 180 components |
| Good components | 171 |
| Rejected components | 9 |
Step 1: Calculate Availability
Availability = (420 ÷ 480) × 100
Availability = 87.5%
Step 2: Calculate Performance
Performance = (2 × 180 ÷ 420) × 100
Performance = 85.71%
Step 3: Calculate Quality
Quality = (171 ÷ 180) × 100
Quality = 95%
Step 4: Calculate Overall OEE
OEE = 87.5% × 85.71% × 95%
OEE = Approximately 71.25%
<text> </text>
This means the CNC machine achieved approximately 71.25% of its theoretical production effectiveness during the defined planned production period.
The result also indicates that there are opportunities to investigate availability, performance, and quality losses rather than focusing only on total production output.
What Is a Good OEE Percentage for CNC Machines?
A frequently referenced manufacturing benchmark is 85% OEE, sometimes described as a world-class target. However, this should not be treated as a universal requirement for every CNC machine or factory.
OEE depends on production conditions, product mix, machine type, planned production time, cycle-time standards, and quality requirements.
A machine performing complex, low-volume machining jobs may have different operating characteristics from a high-volume automated production line.
Manufacturers should first establish an accurate baseline and then set realistic improvement targets based on their processes.
The following ranges can be used as an illustrative starting point for internal discussions, not as universal industry standards:
| OEE Range | General Interpretation |
|---|---|
| Below 50% | Significant losses may require investigation |
| 50%–65% | Opportunities to improve machine effectiveness |
| 65%–75% | Moderate effectiveness with identifiable improvement areas |
| 75%–85% | Strong performance, with further optimization possible |
| Above 85% | High effectiveness under the defined measurement rules |
The most important consideration is not simply reaching a particular percentage. It is ensuring that OEE is measured consistently and that the underlying production losses are understood.
Common Production Losses That Affect CNC OEE
Understanding the reasons behind a low OEE score is more useful than looking at the percentage alone.
Manufacturers can use the traditional Six Big Losses framework to categorize production losses.
| OEE Component | Common Production Losses | CNC Manufacturing Examples |
|---|---|---|
| Availability | Equipment failure | Spindle faults, axis faults, electrical breakdowns |
| Availability | Setup and adjustment | Job changeovers, machine setup, tool setting |
| Performance | Small stops | Brief interruptions, resets, material handling delays |
| Performance | Reduced speed | Longer cycle times, reduced feed rates, tool wear |
| Quality | Process defects | Dimensional errors, surface-finish problems |
| Quality | Startup losses | Rejected components during initial setup or adjustment |
Equipment Failure Losses
Unexpected machine breakdowns reduce the time available for production.
Recording the frequency and duration of breakdowns helps maintenance teams identify machines that require investigation.
Setup and Adjustment Losses
CNC machines may require setup time when changing jobs, tools, programs, or production requirements.
Manufacturers should define how setup time is treated within their OEE calculation to maintain consistent reporting.
Small Stops
Short interruptions can occur when a machine pauses, resets, or waits for a process-related activity.
Although individual interruptions may appear insignificant, repeated small stops can reduce overall production performance.
Reduced Speed Losses
A CNC machine may operate below its ideal production speed because of machining conditions, tool wear, program settings, or other process limitations.
Comparing actual cycle time with a validated ideal cycle time helps identify these losses.
Quality Defects and Rework
Rejected components reduce the number of good parts produced from the available machining time.
Tracking quality losses alongside machine performance helps manufacturers understand the actual impact of defects on OEE.
How CNC OEE Monitoring Software Works
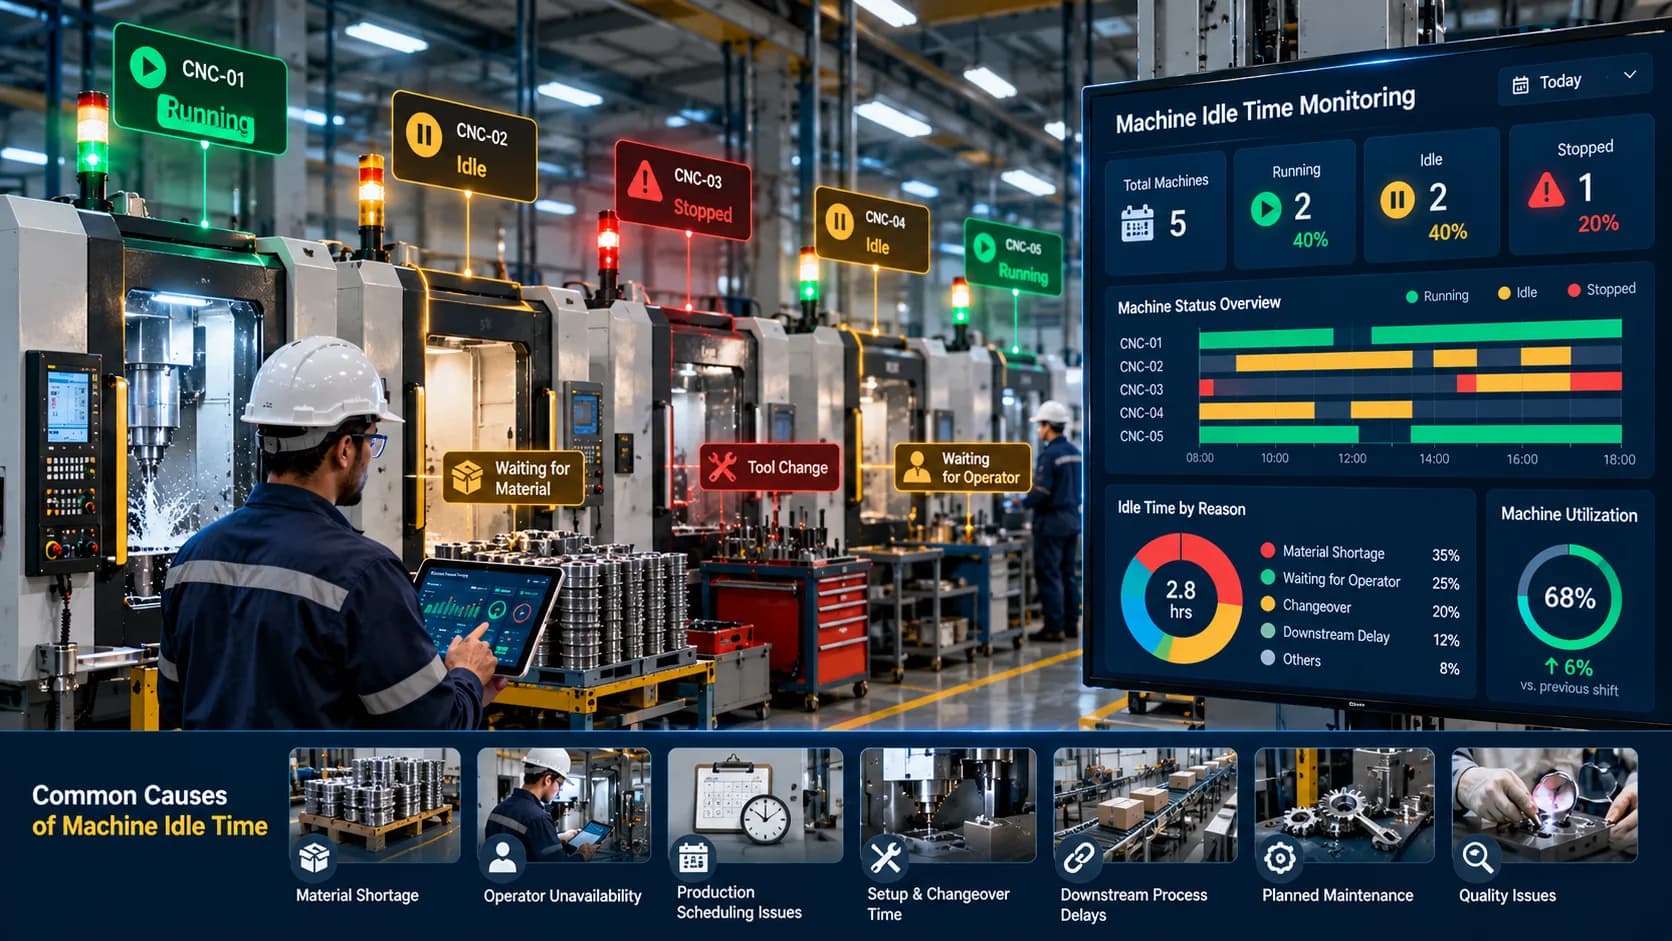
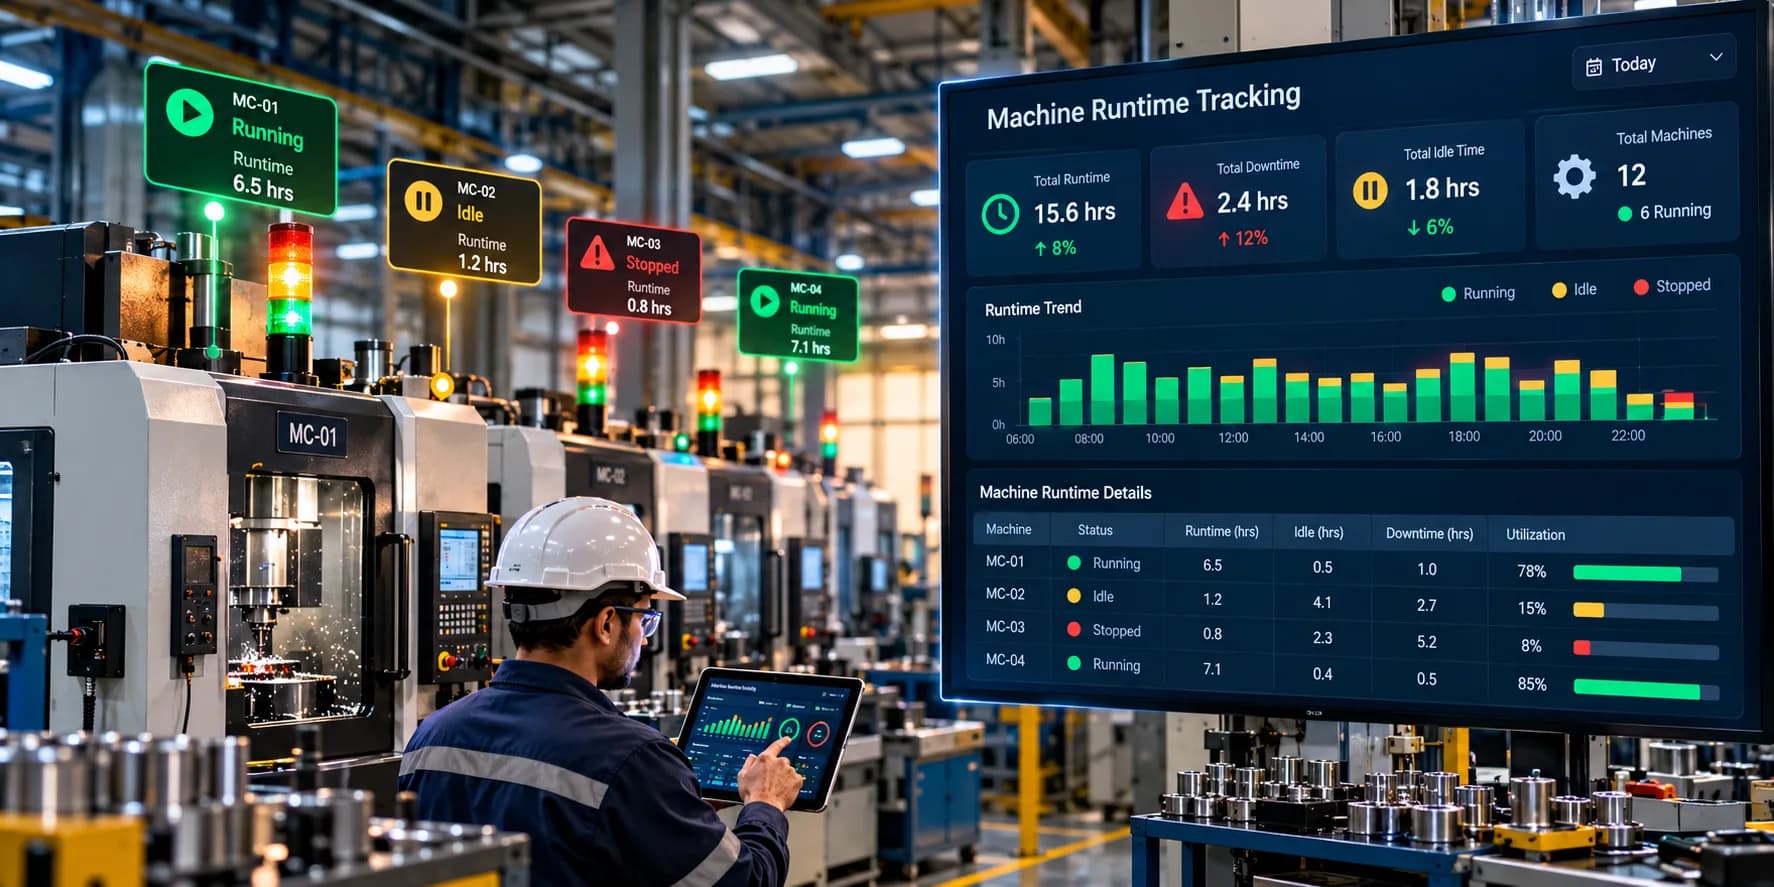
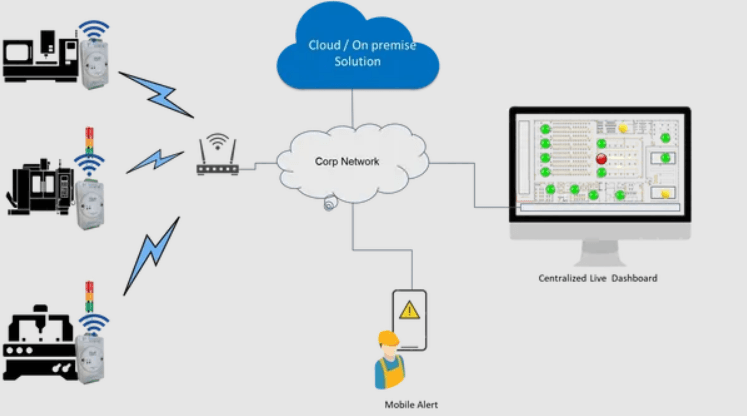
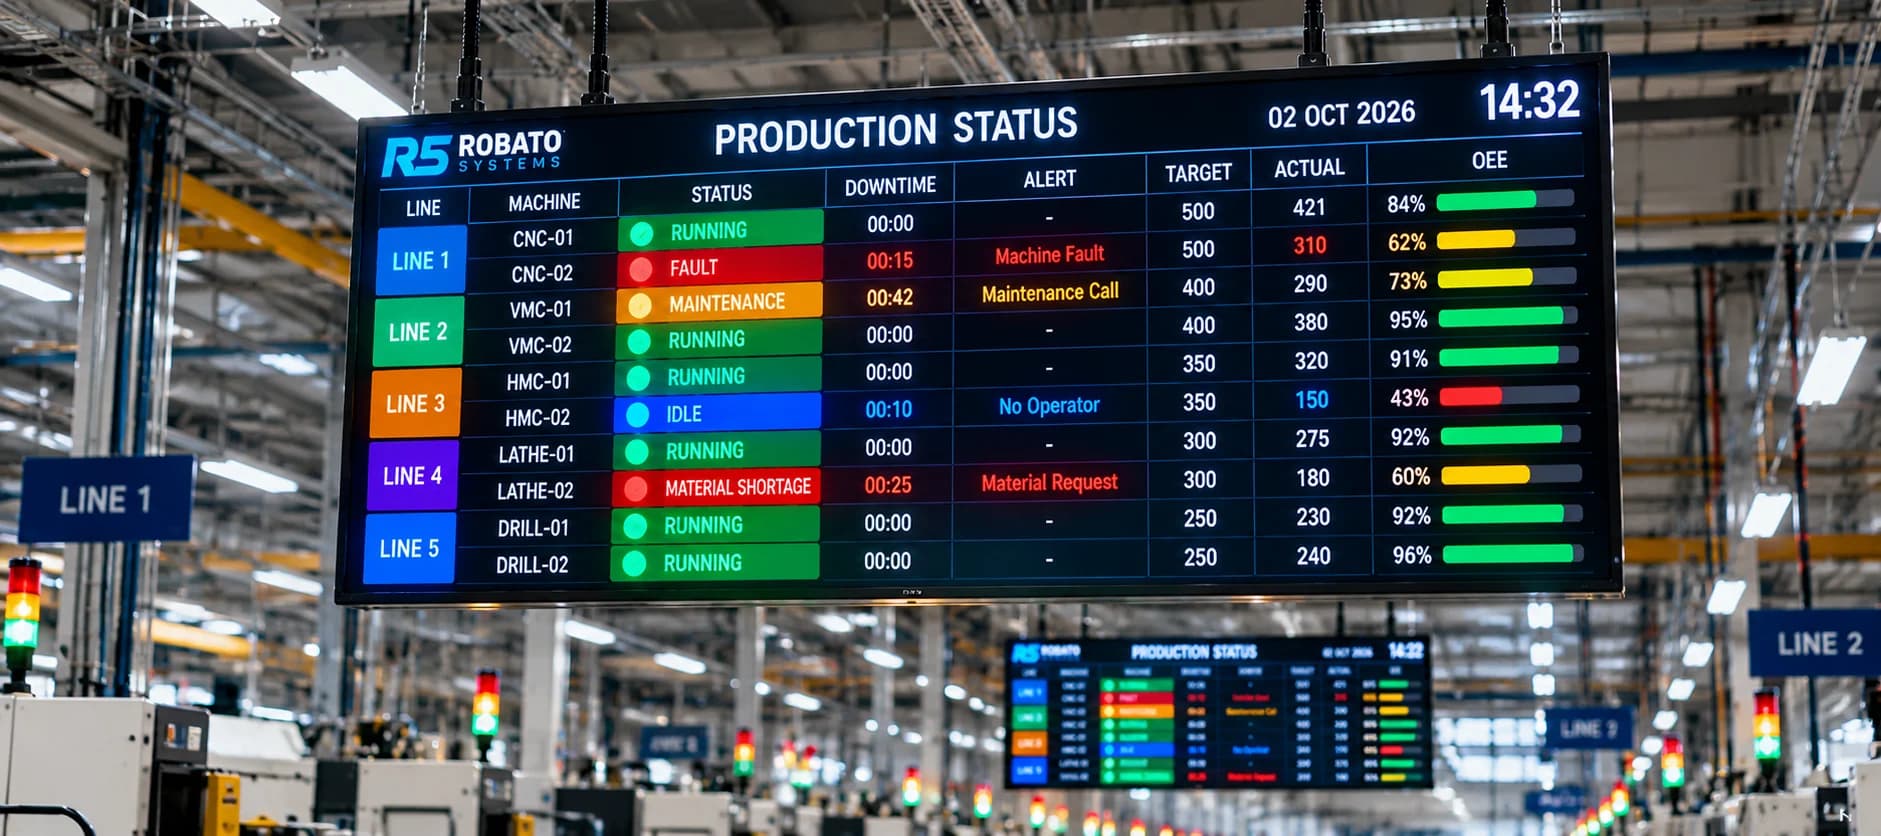
A CNC OEE monitoring system collects data from machines and production processes, calculates the three OEE components, and presents the results through dashboards and reports.
The exact implementation depends on available machine signals, controller compatibility, and the quality information the factory can provide.
1. Machine and Production Data Collection
The system collects information from supported data sources, which may include:
CNC controllers
PLCs
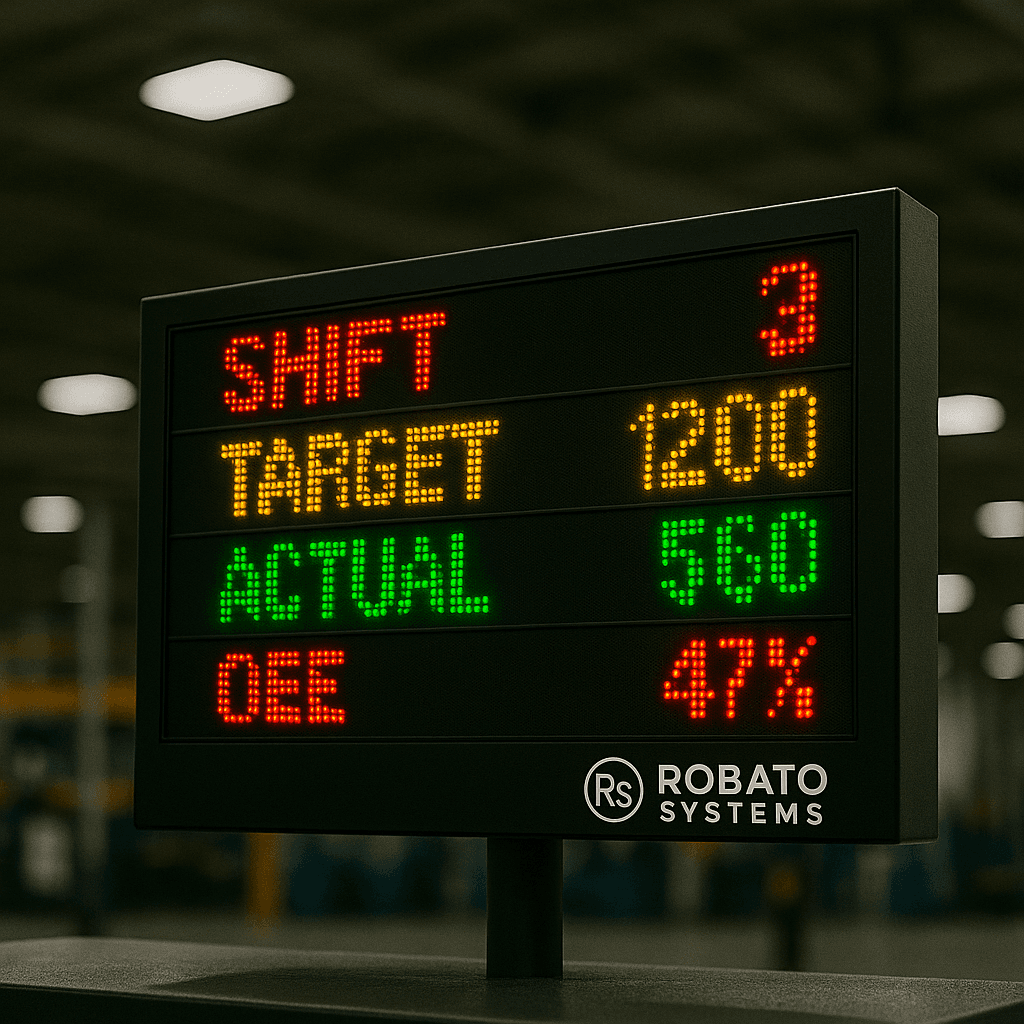
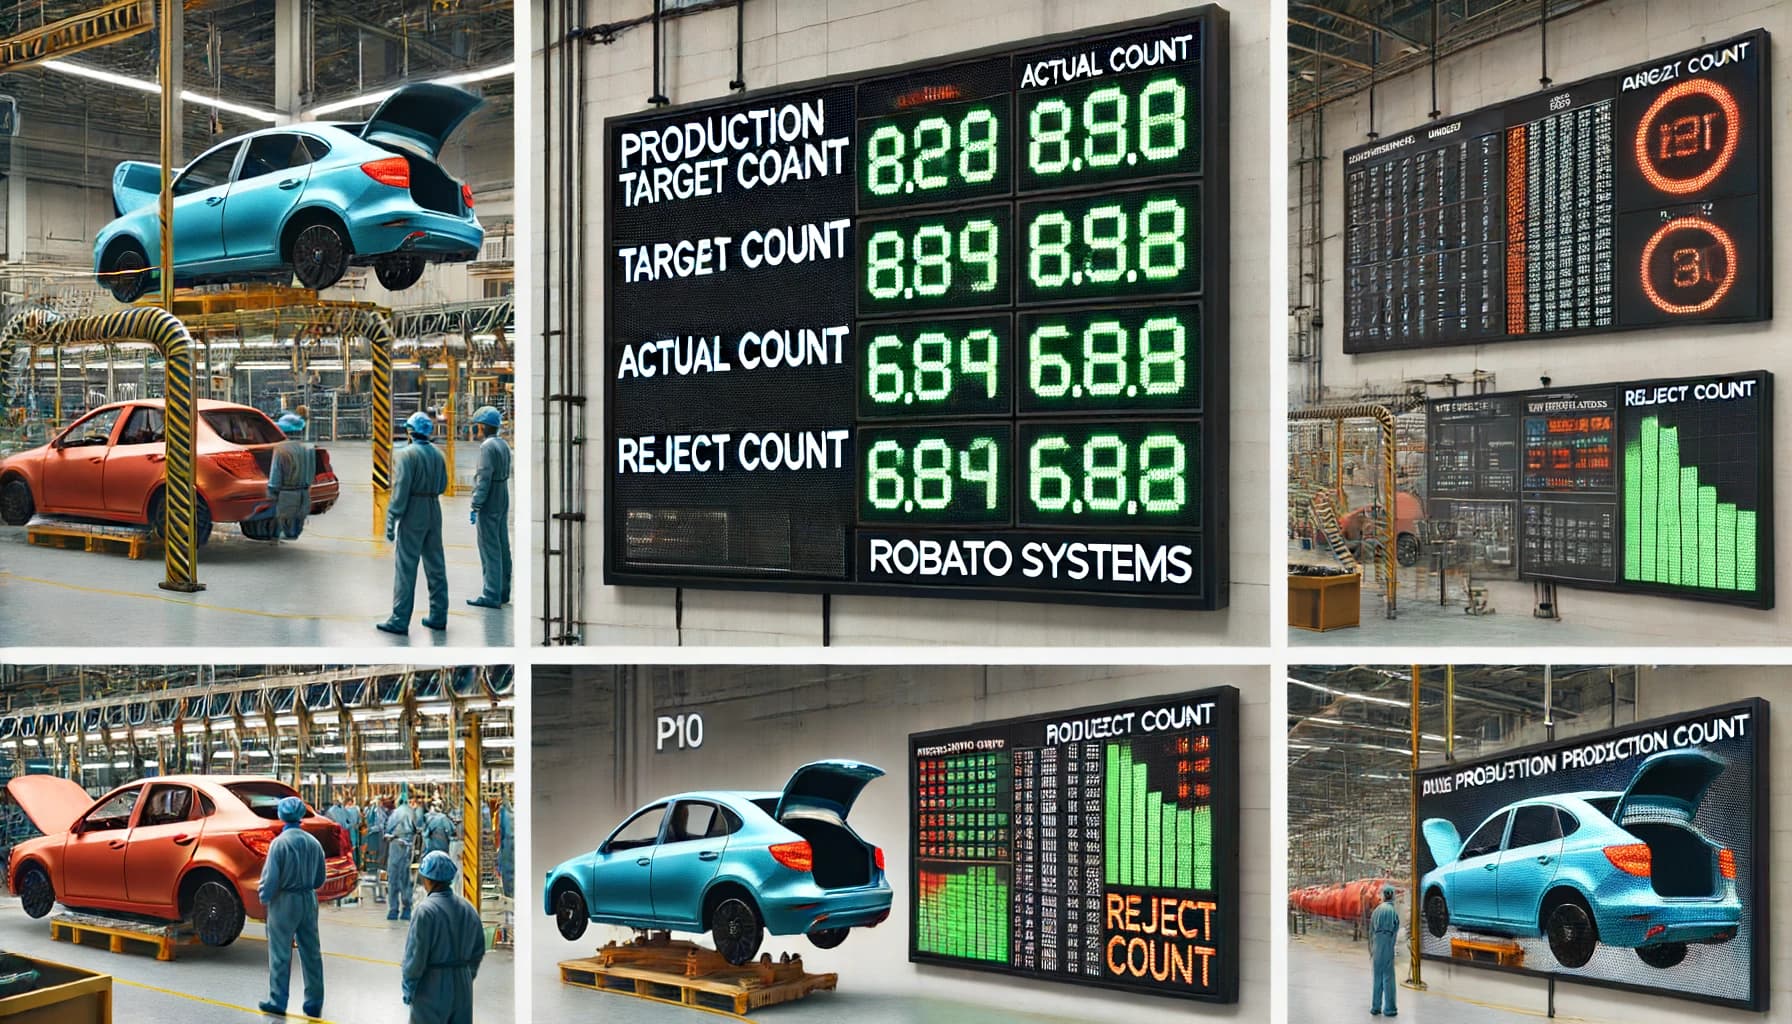
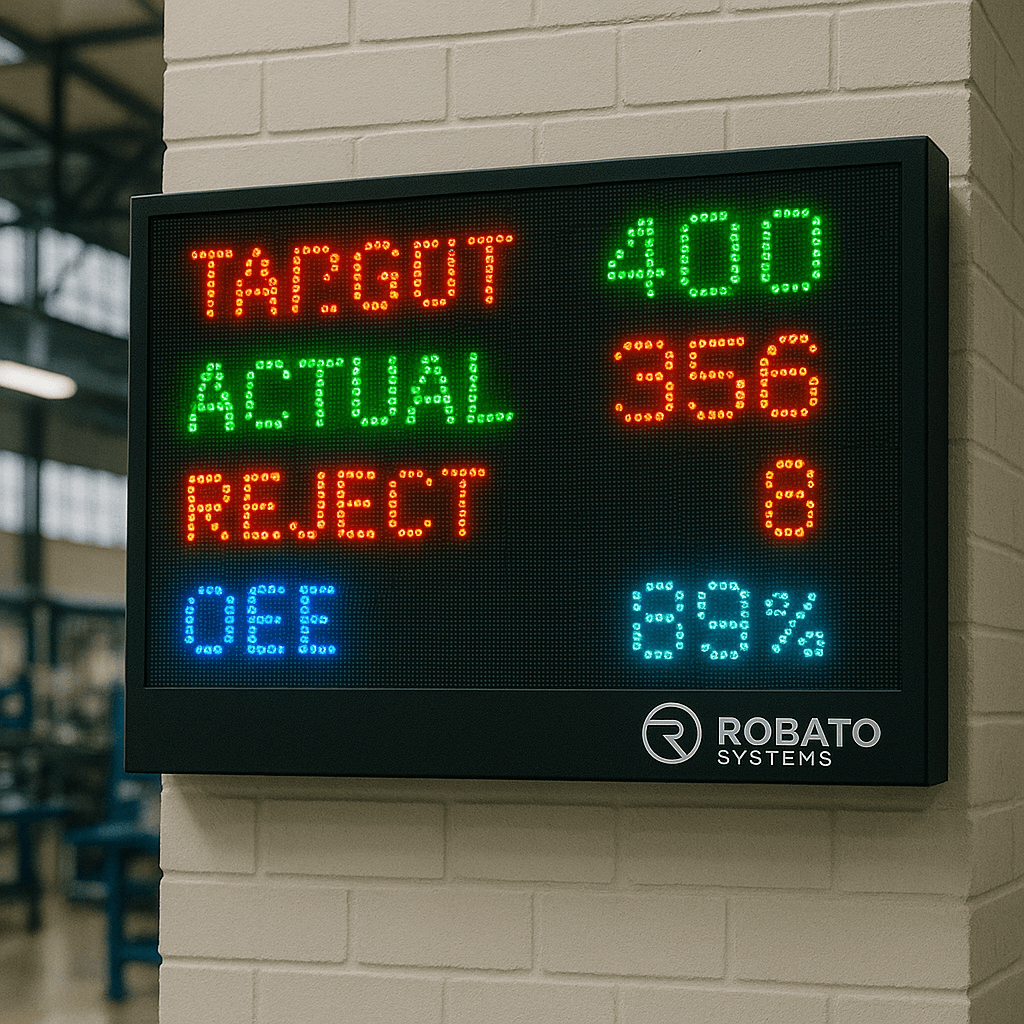
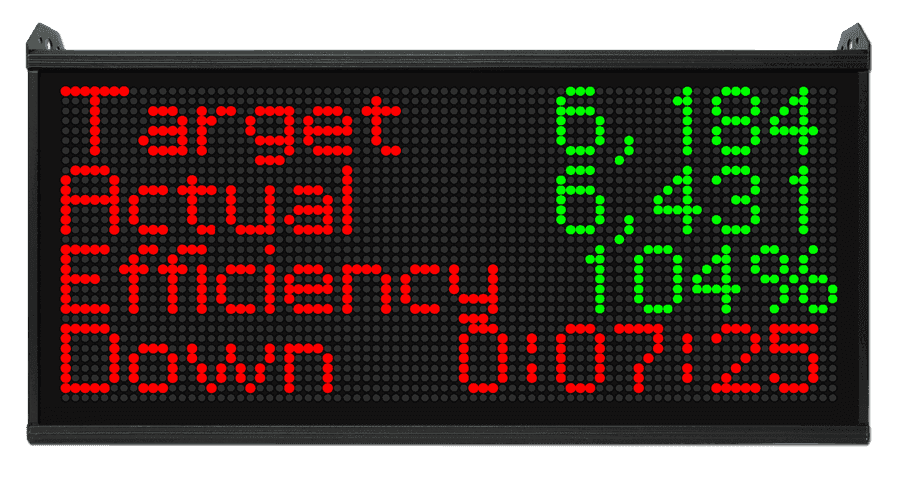
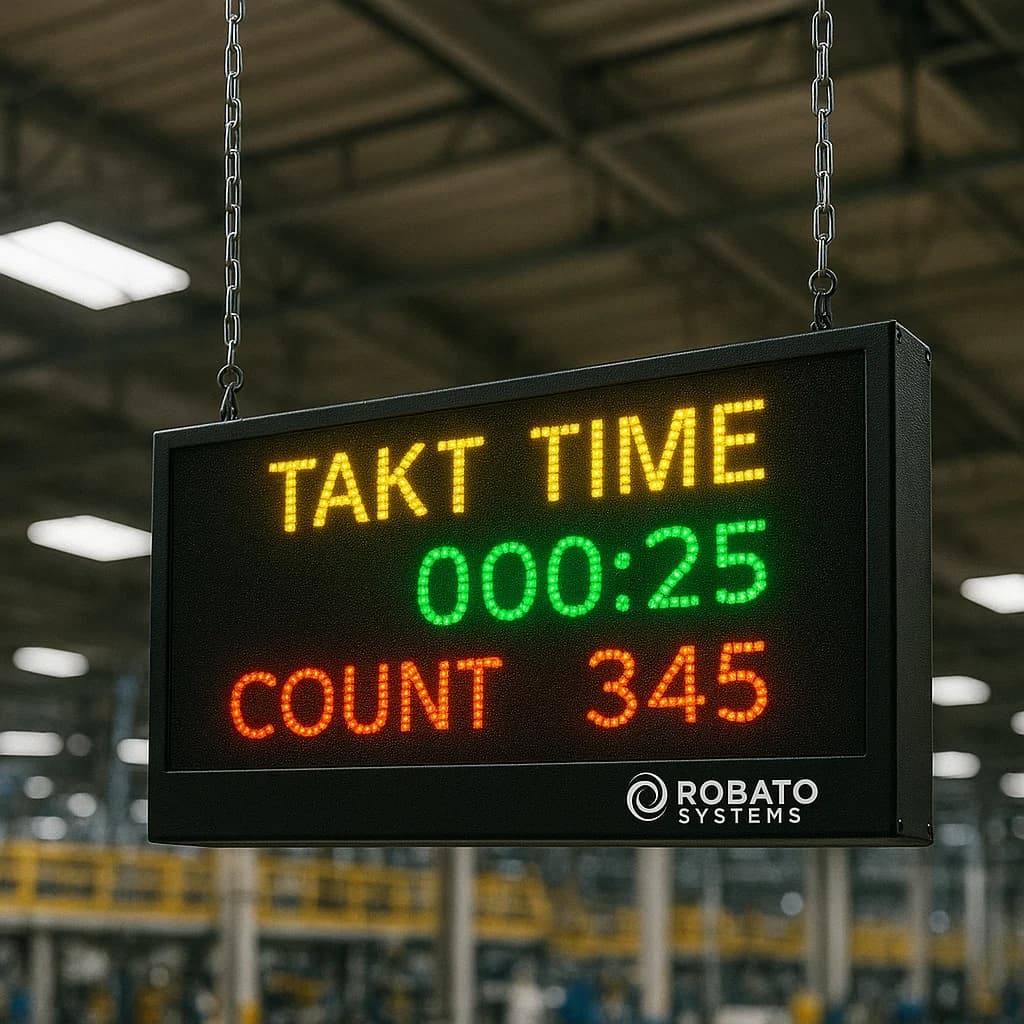
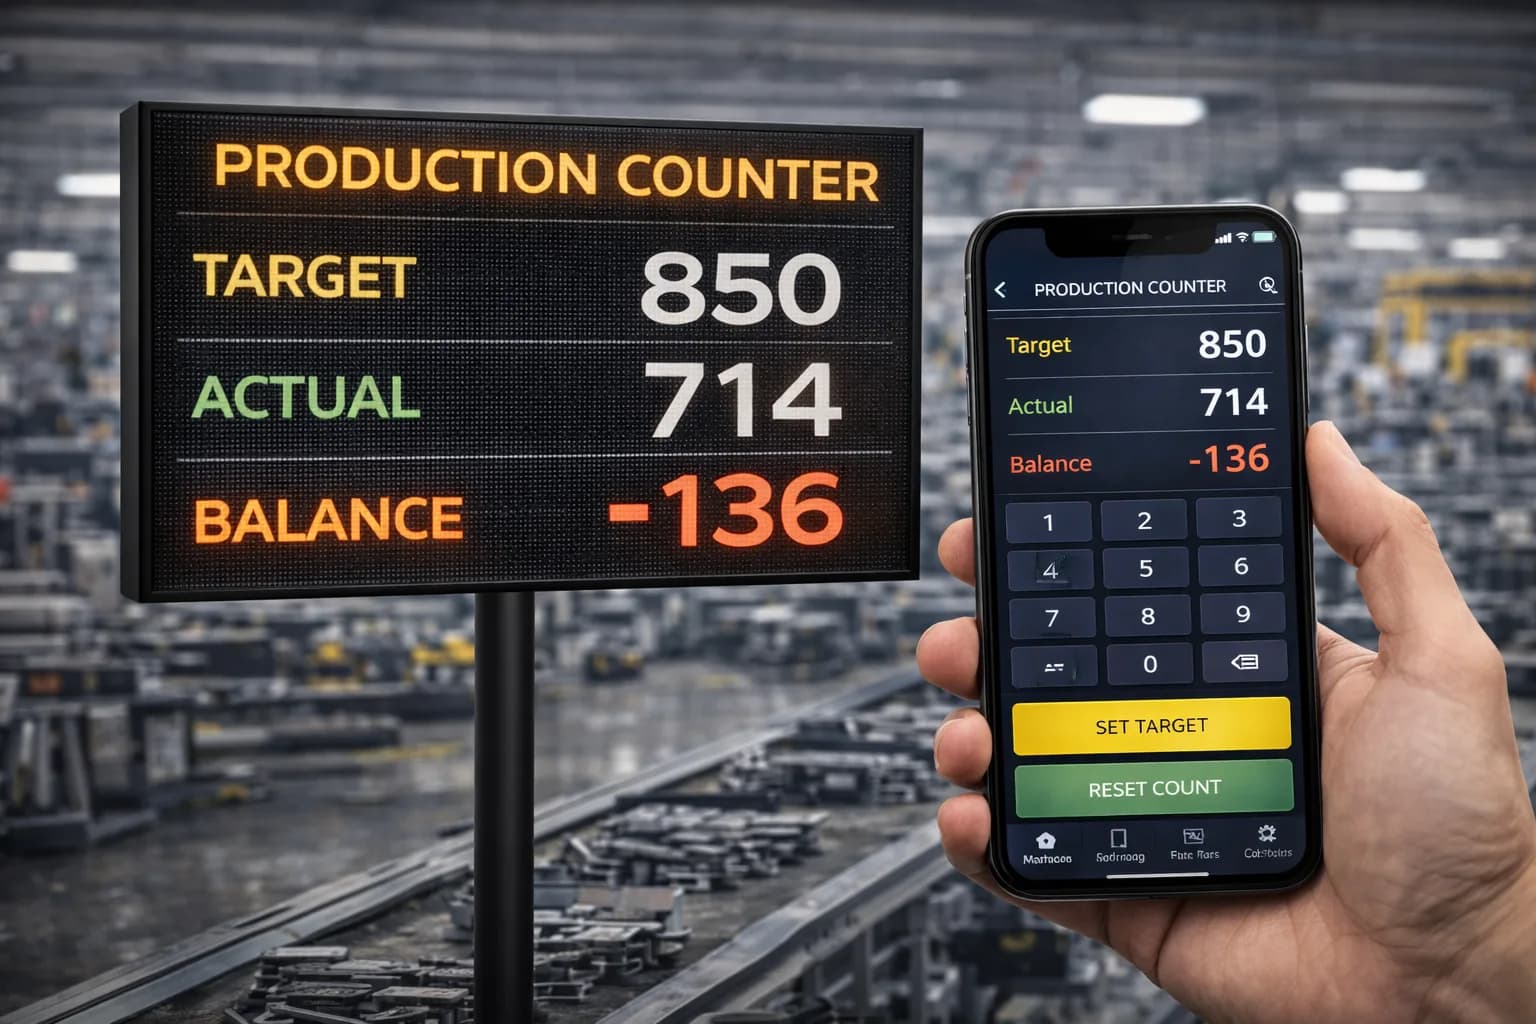
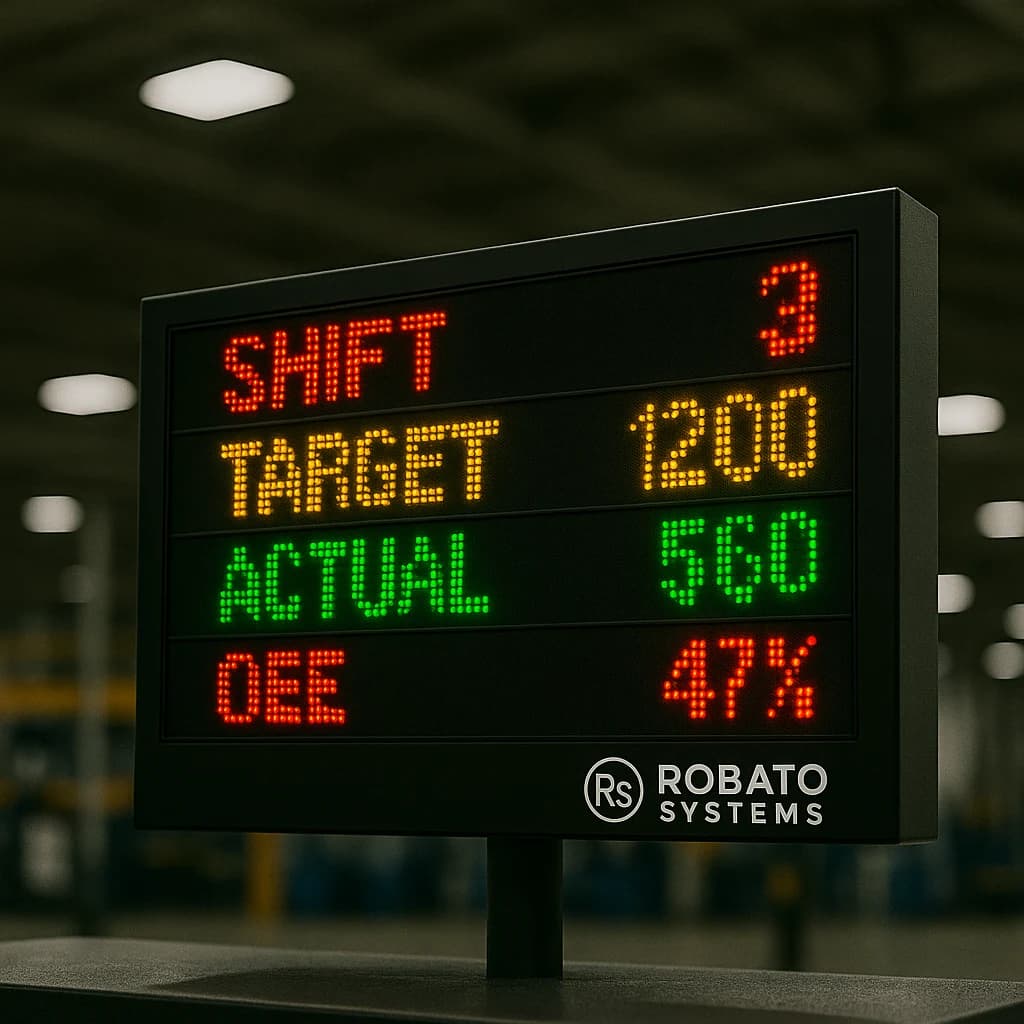
Production counter LED displays
Smart production counters
Machine sensors
Downtime input devices
Operator applications
Quality and rejection records
For example, a machine signal can provide operating status, while a production counter records completed components.
2. Operating-Time and Downtime Recording
The software uses configured production schedules and machine-state signals to calculate planned production time and operating time.
Downtime events may be detected automatically or recorded through operator input, depending on the available integration.
3. Production and Quality Data Collection
Production counts provide the total number of components manufactured.
Quality information identifies the number of good and rejected components. This information may come from operator entries, inspection systems, or supported production applications.
Accurate quality information is essential for calculating the Quality component of OEE.
4. Automatic OEE Calculation
Once the necessary information is available, the software calculates Availability, Performance, and Quality.
It then combines these values to generate an OEE percentage for the selected machine, line, or reporting period.
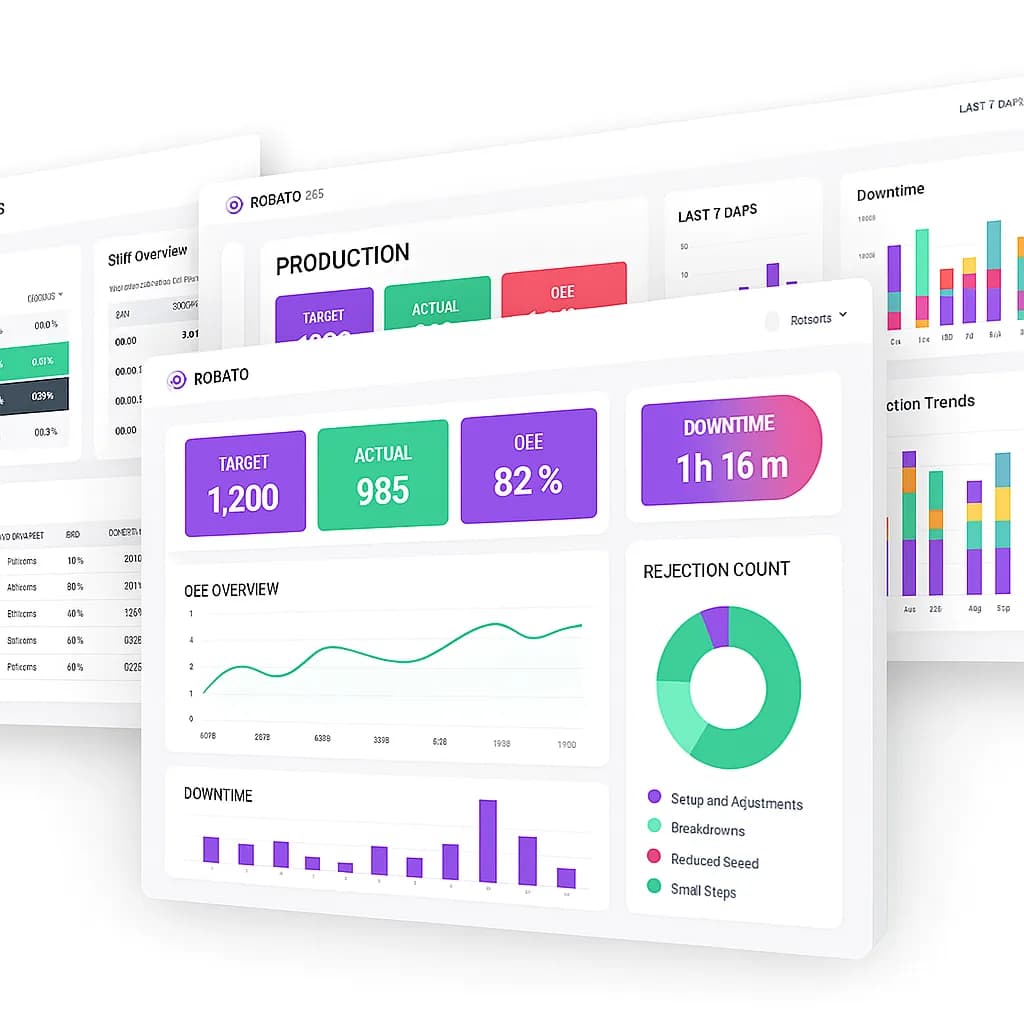
5. Dashboard Visualization and Reporting
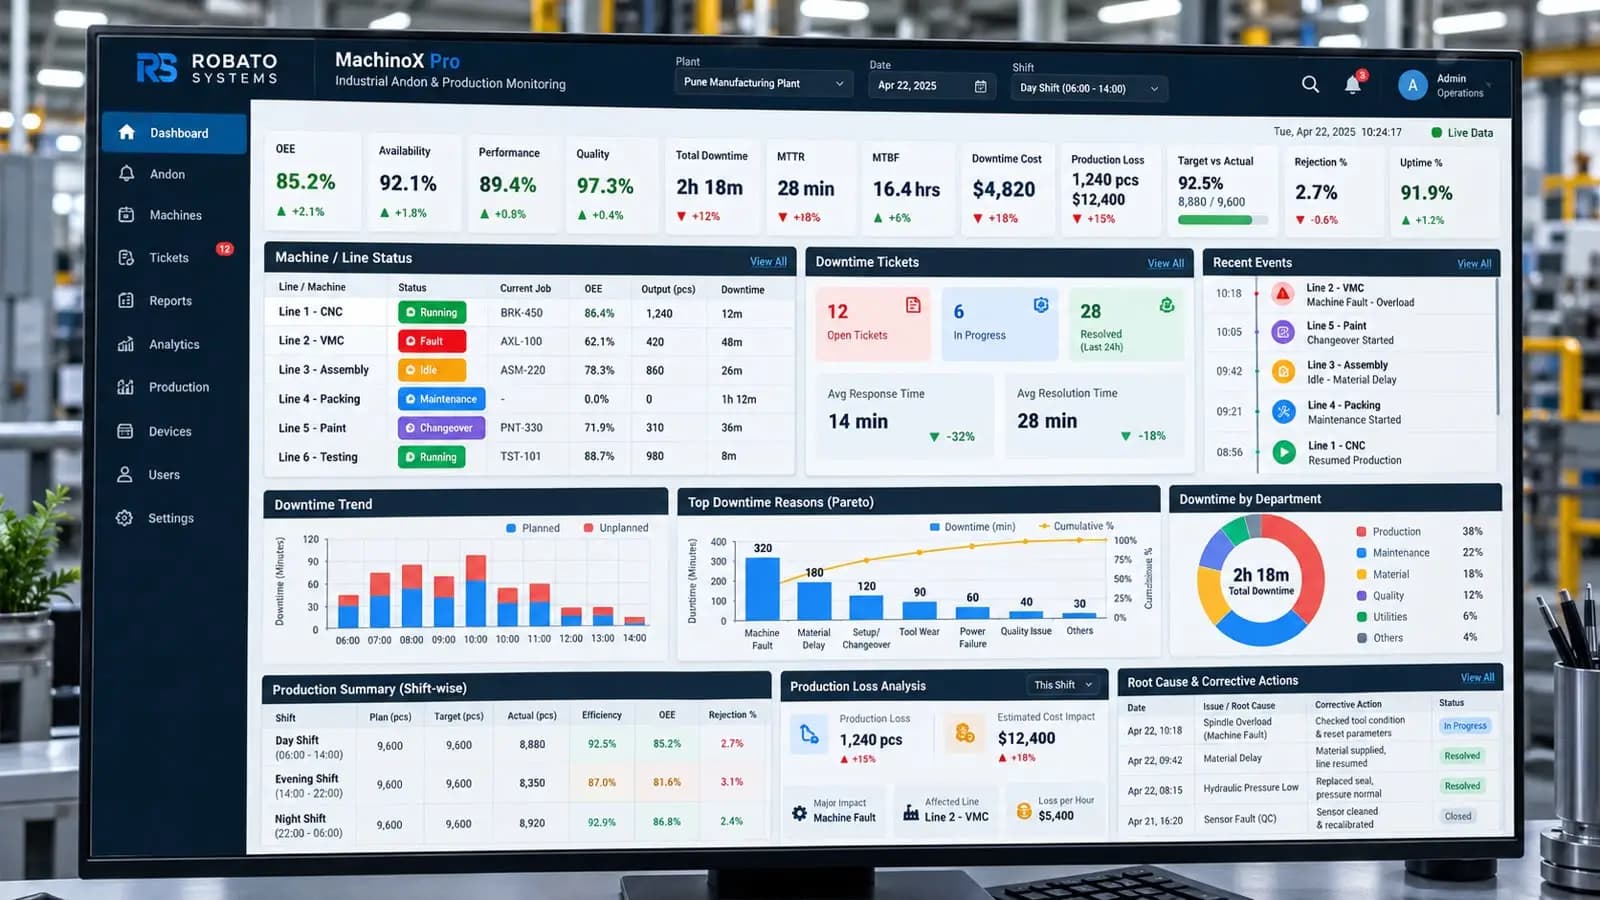
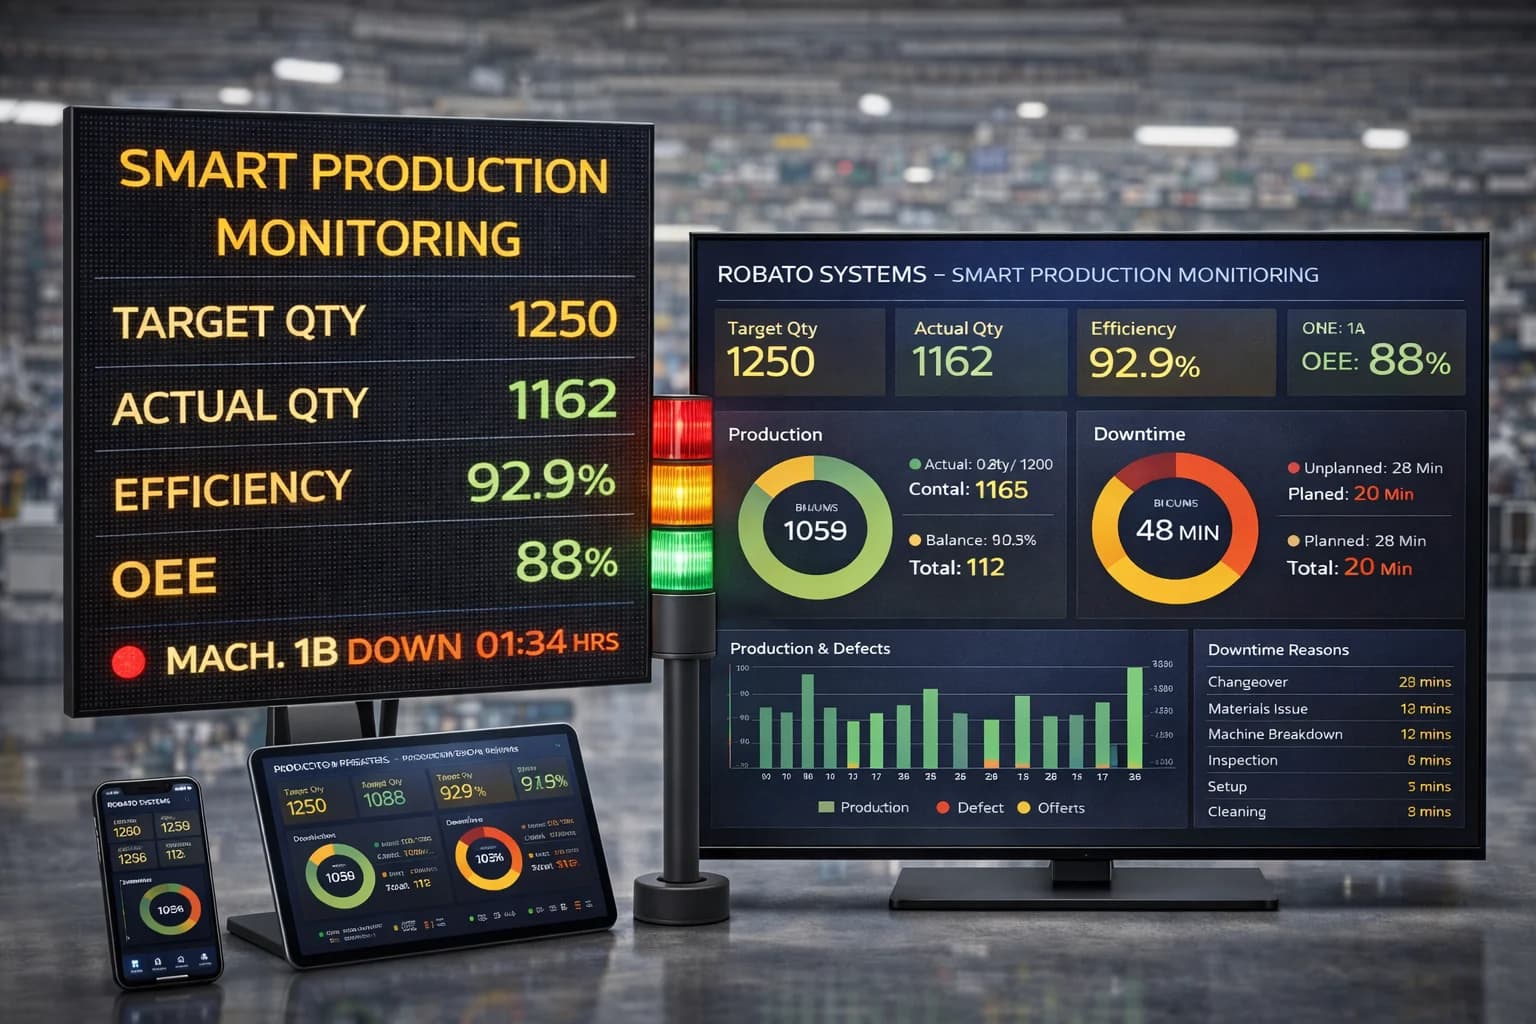
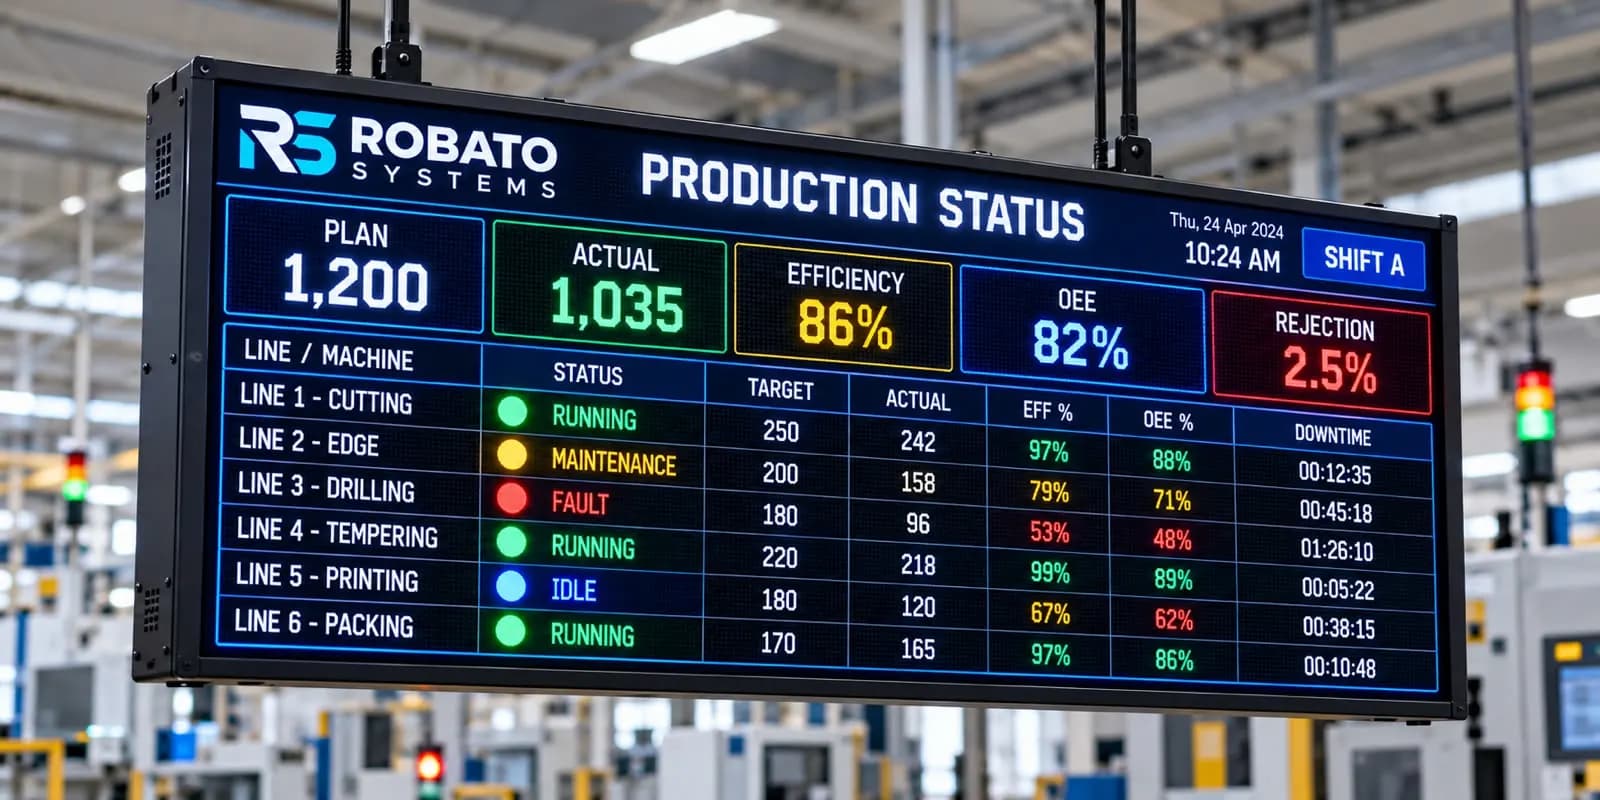
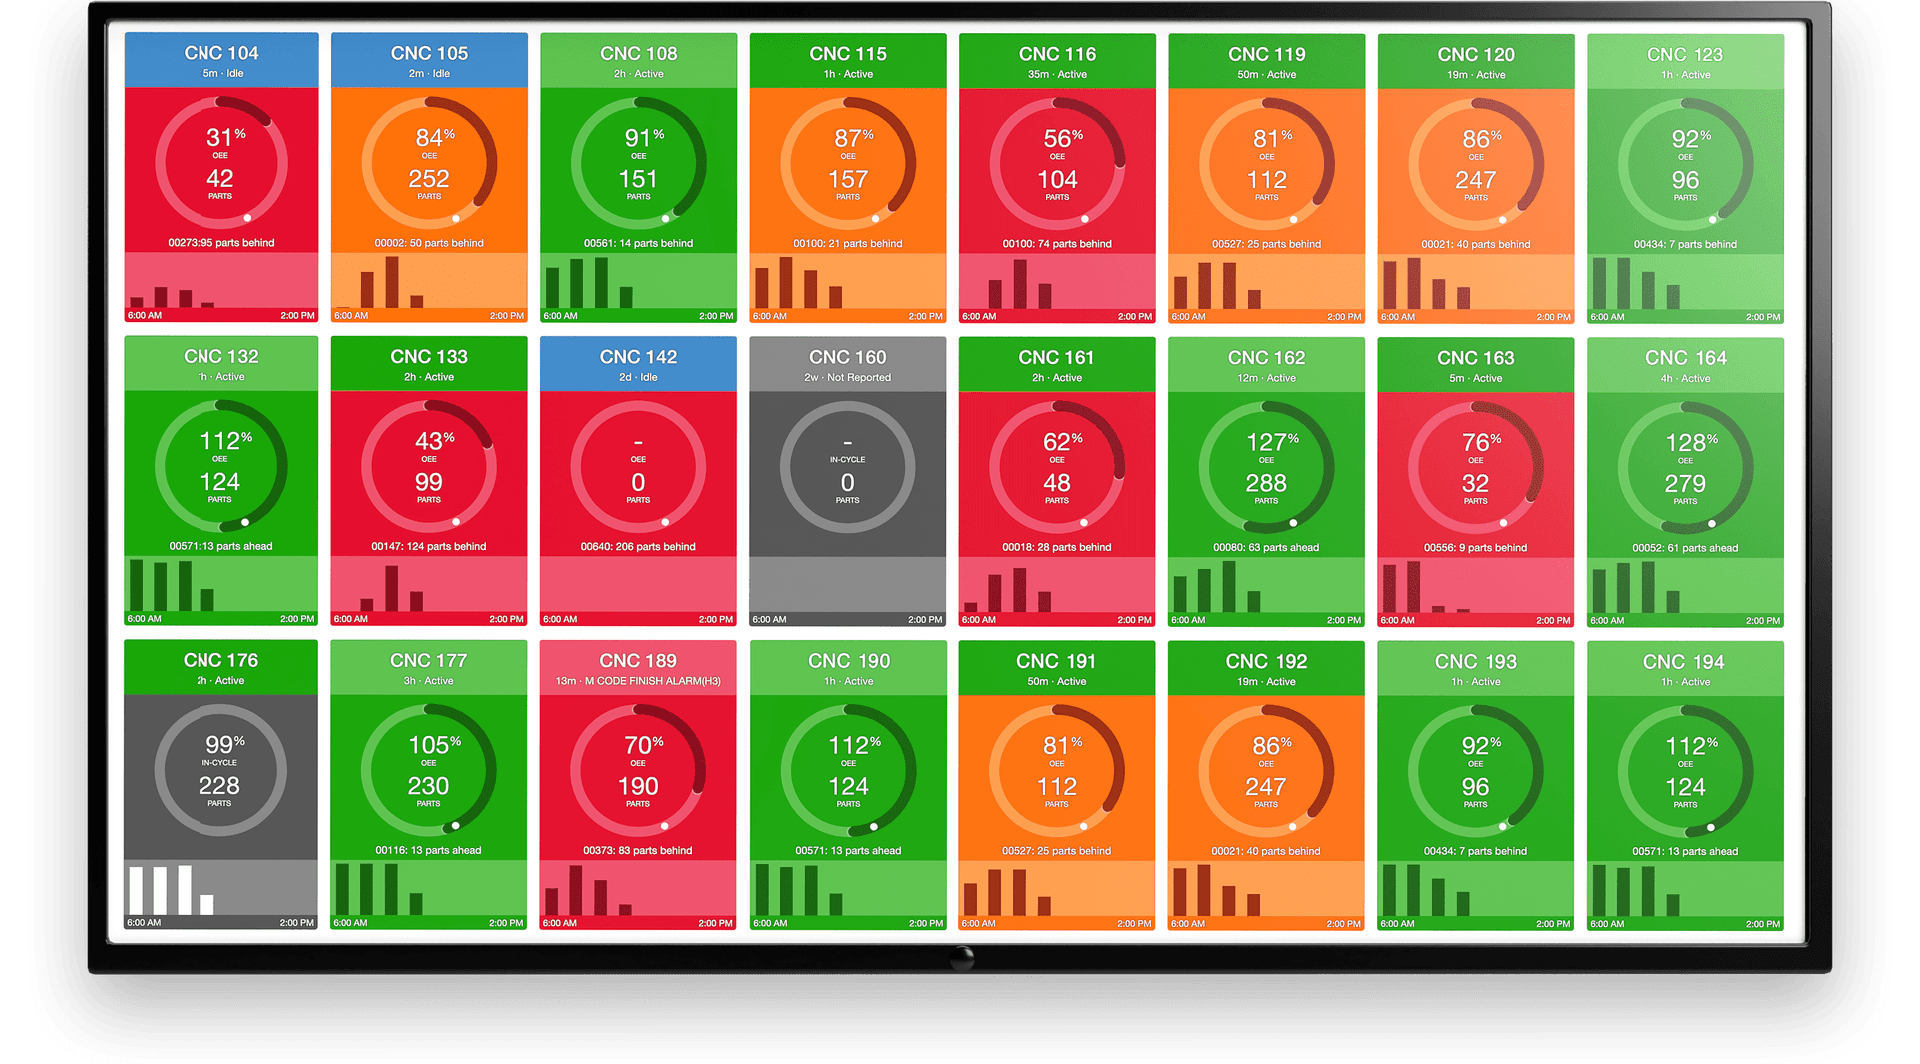
The calculated values are displayed through dashboards and reports.
Users can review OEE trends, compare machines, identify low-performing production areas, and investigate the underlying losses.
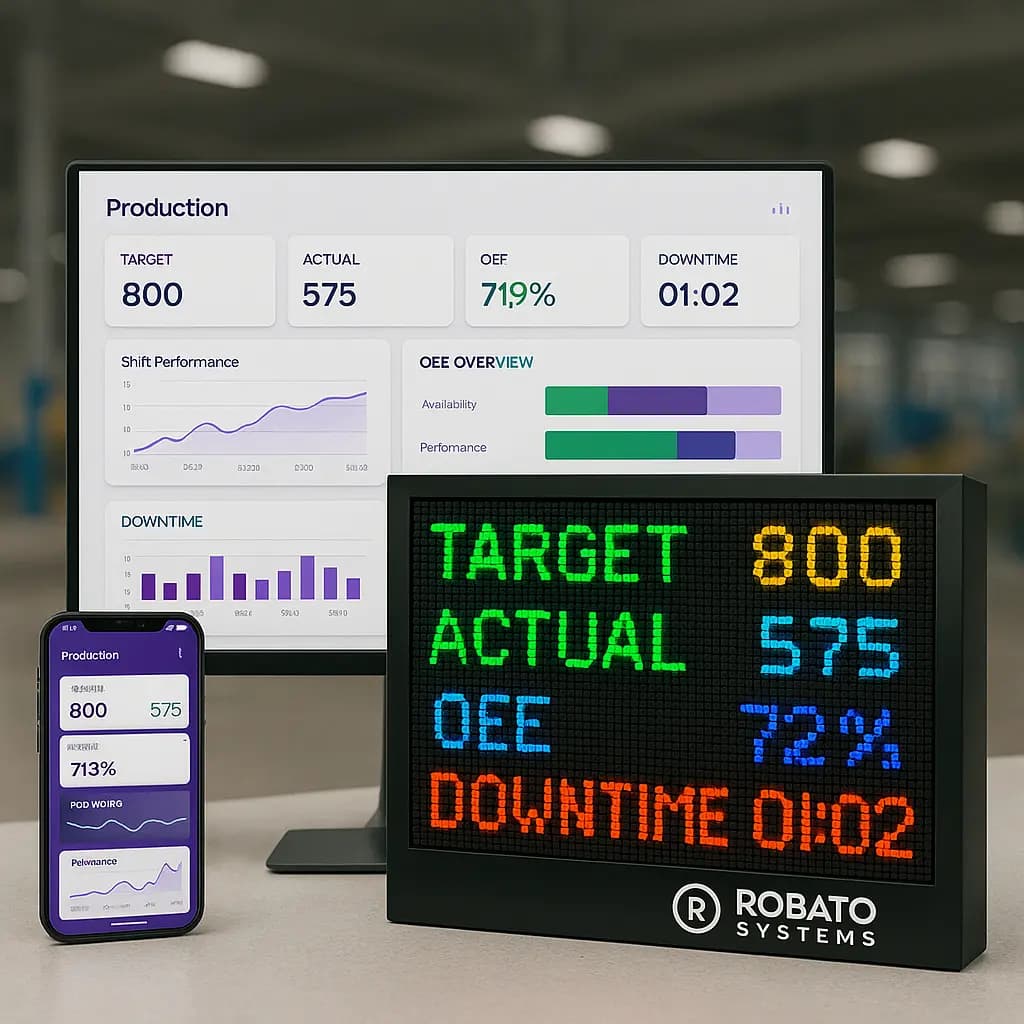
Robato Systems' OEE Monitoring System supports OEE calculation using production counter data, PLC information, downtime inputs, and quality records, with dashboards for machine-level, line-level, and plant-level visibility.
Essential Features of a CNC OEE Monitoring System
When evaluating OEE software for CNC manufacturing, manufacturers should focus on the capabilities needed to collect accurate data and turn it into actionable information.
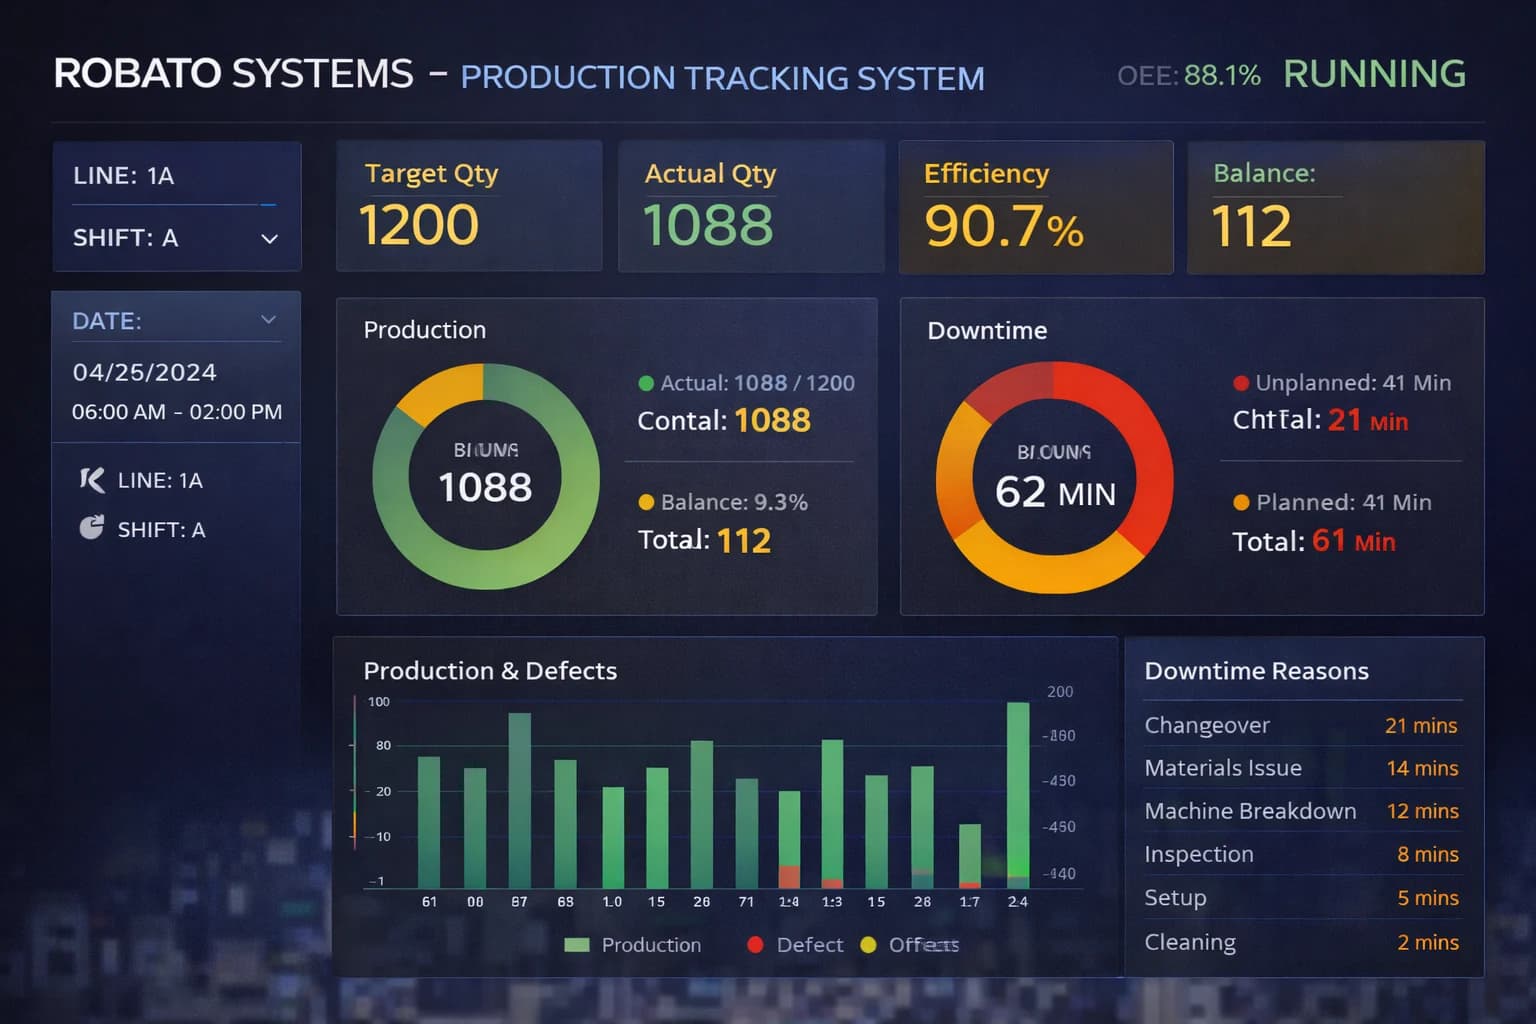
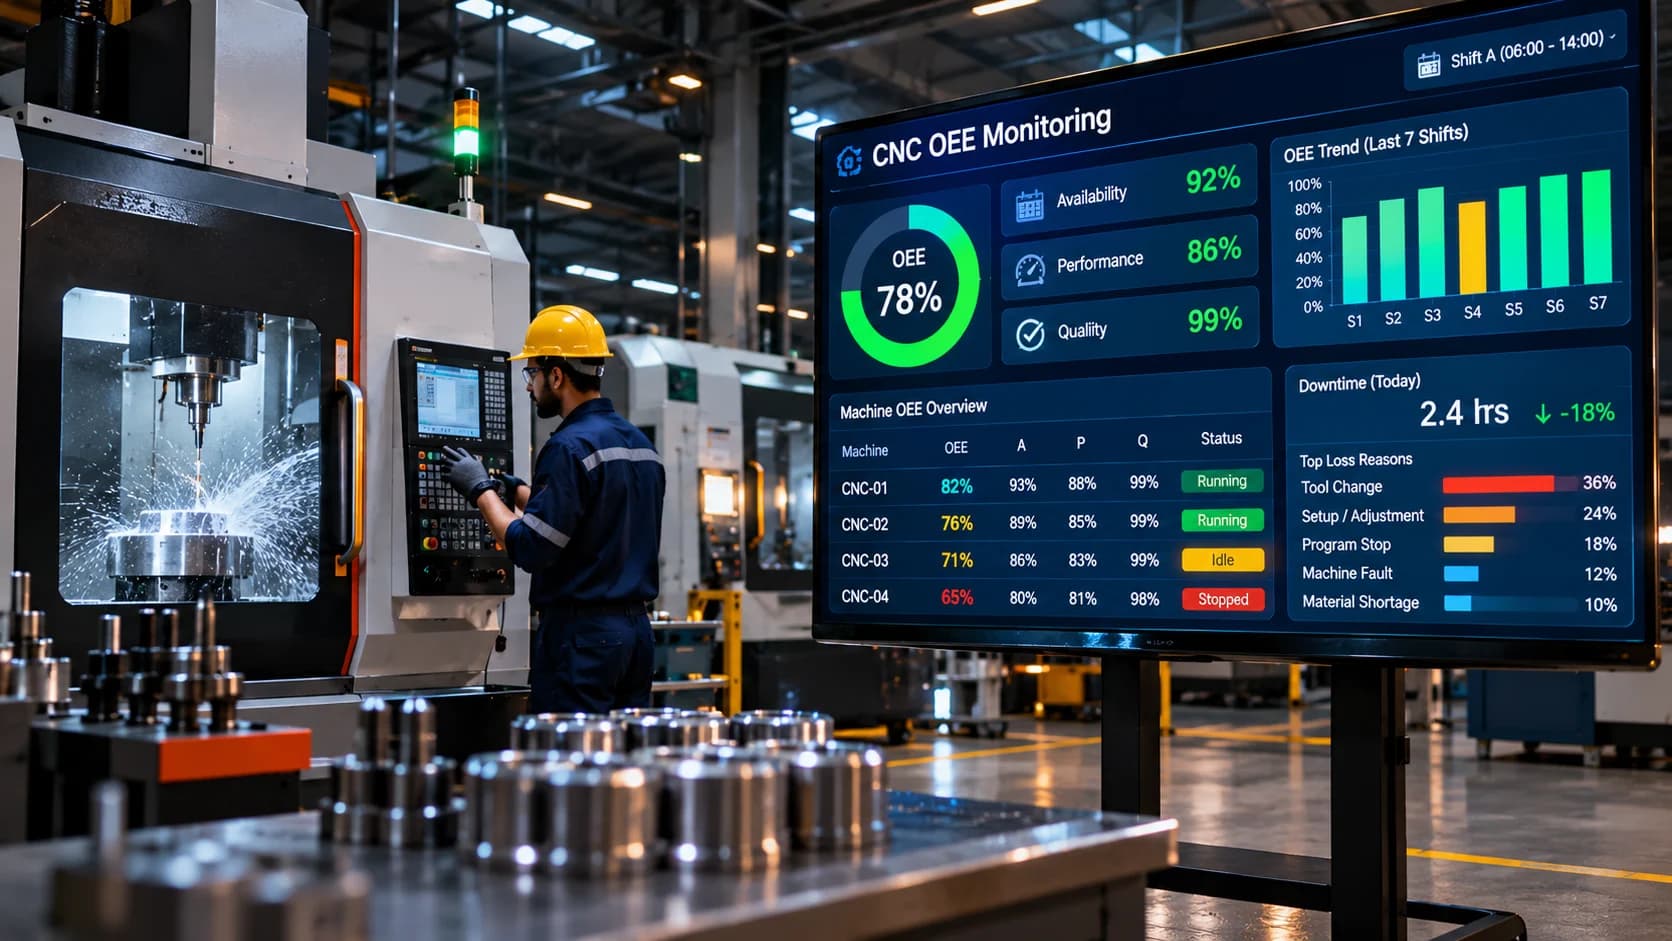
1. Real-Time OEE Dashboard
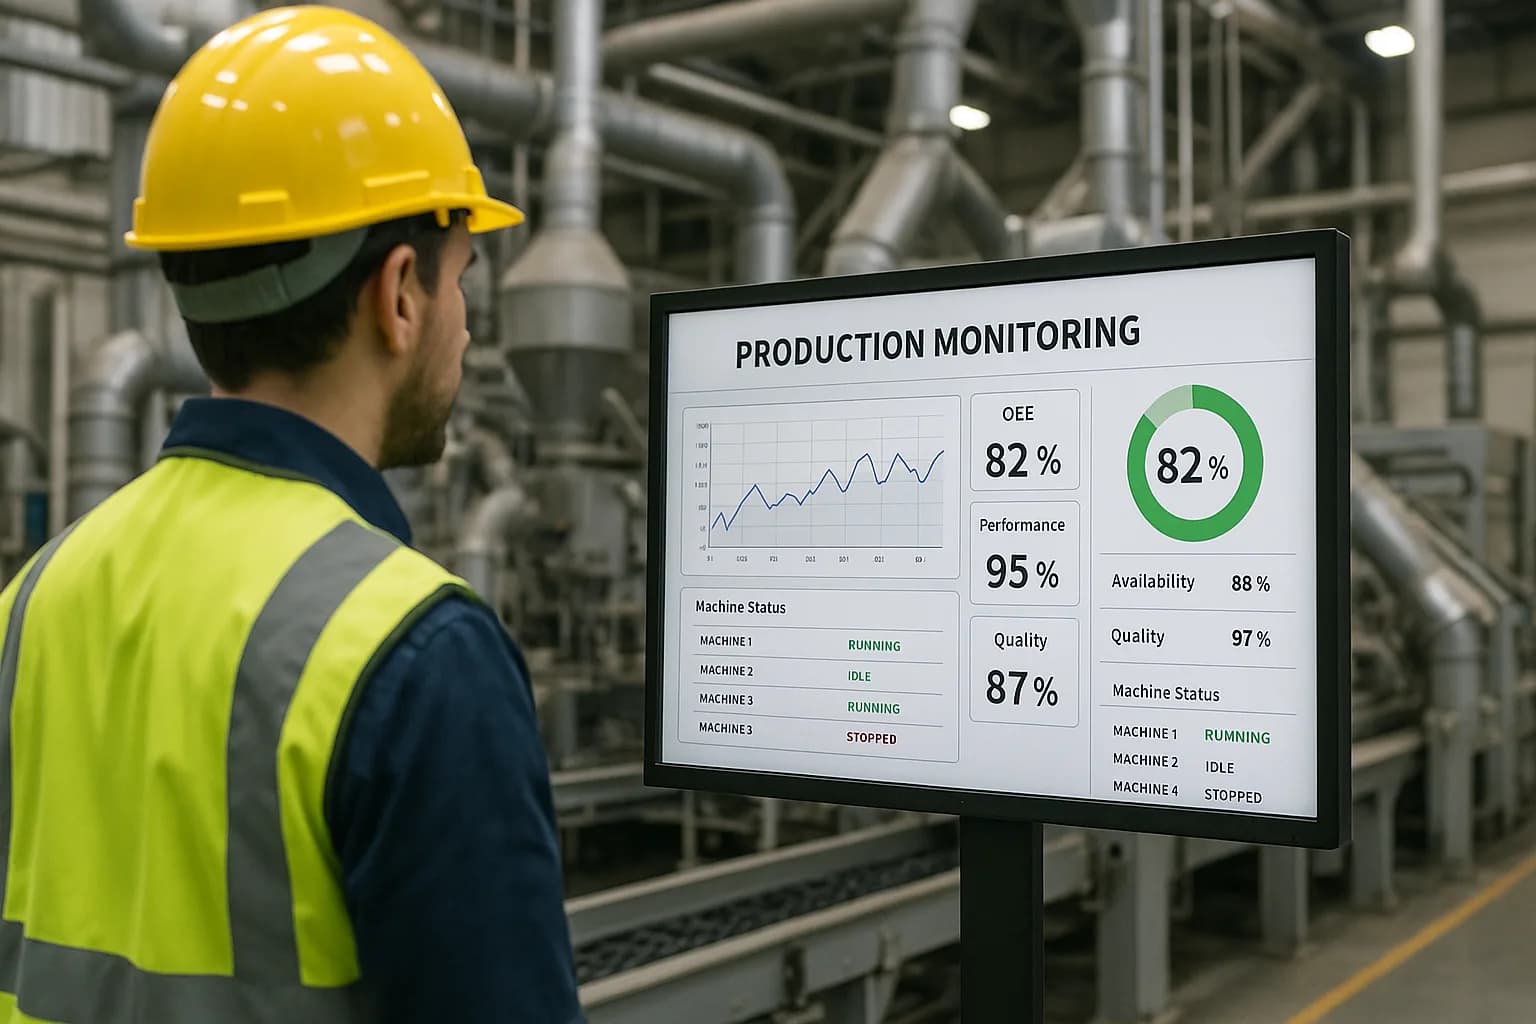
A centralized dashboard should display the OEE percentage and its three components: Availability, Performance, and Quality.
Useful dashboard views include:
Machine-wise OEE
Production-line OEE
Plant-level OEE
Shift-wise performance
Historical OEE trends
Availability, Performance, and Quality breakdowns
This helps managers understand not only the overall score but also which component contributes most to production losses.
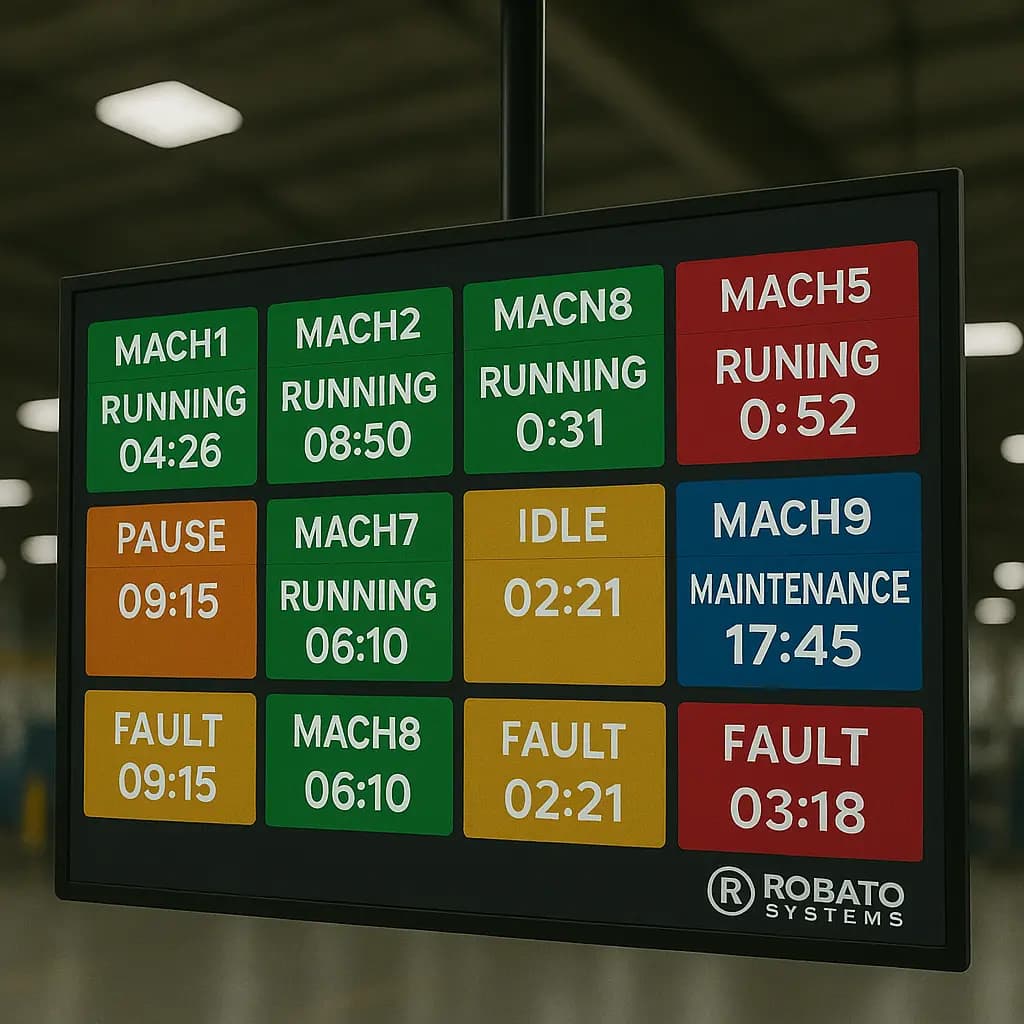
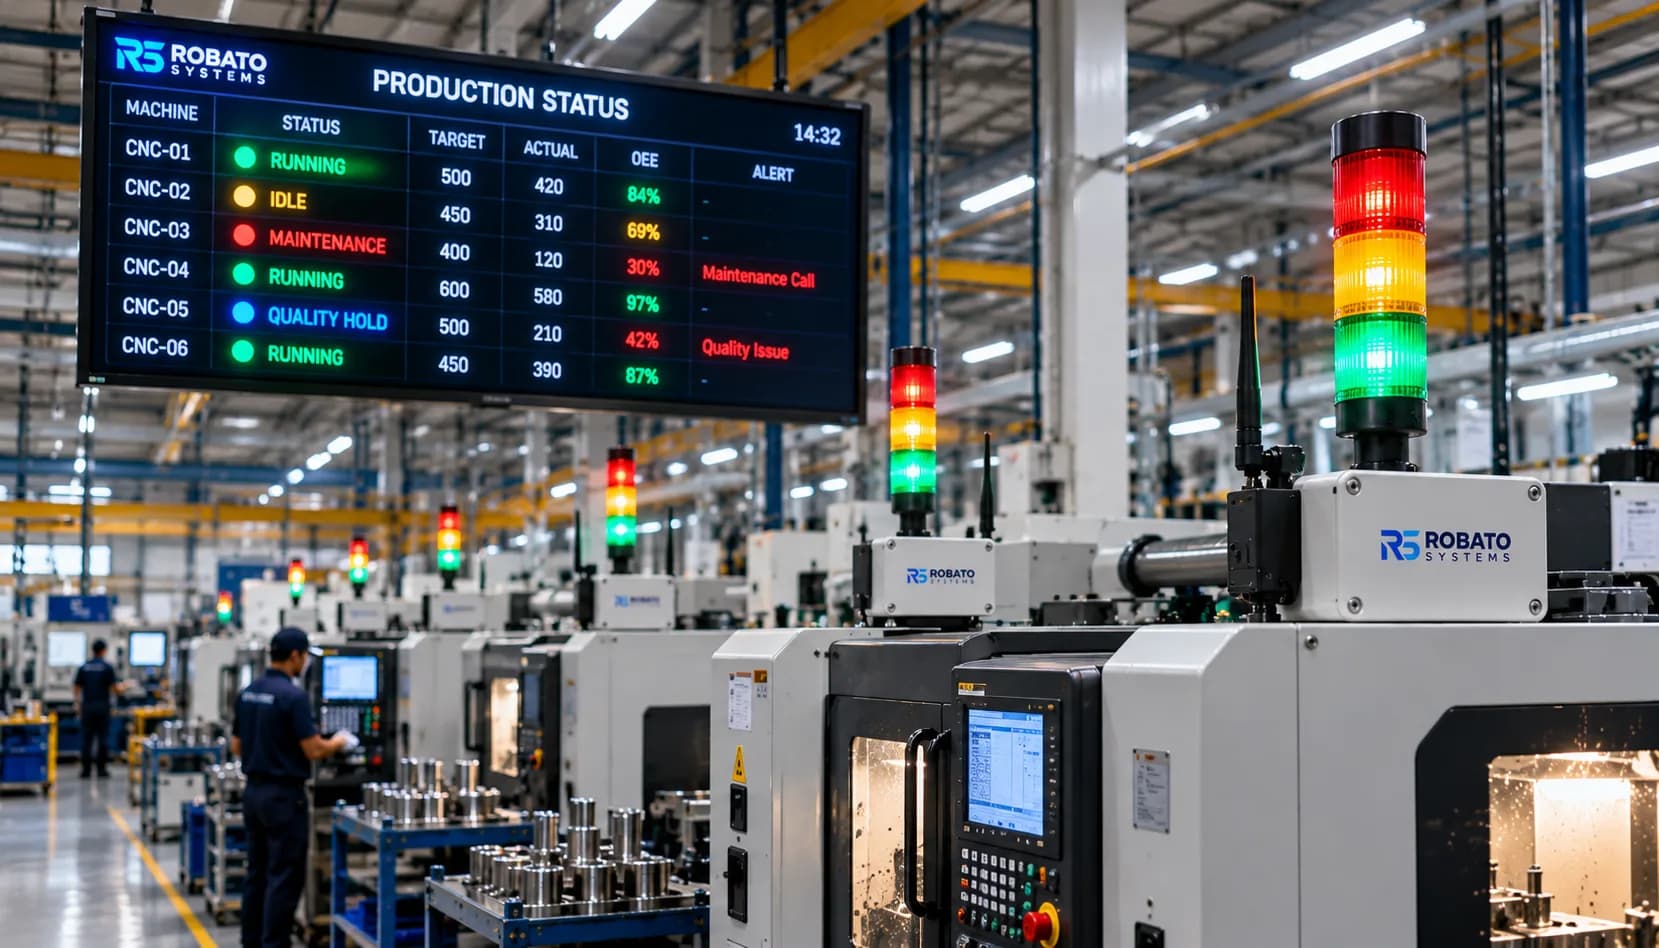
2. Automatic Machine Status Monitoring
Automatic status monitoring reduces dependence on manually checking whether a machine is running or stopped.
The system can use compatible PLC signals, controller data, or external sensors to identify machine states.
Status definitions should be validated against actual machine operation.
3. Downtime Monitoring and Reason Capture
OEE analysis requires accurate downtime information.
A suitable system should record downtime events and support reason classification, either automatically or through operator input.
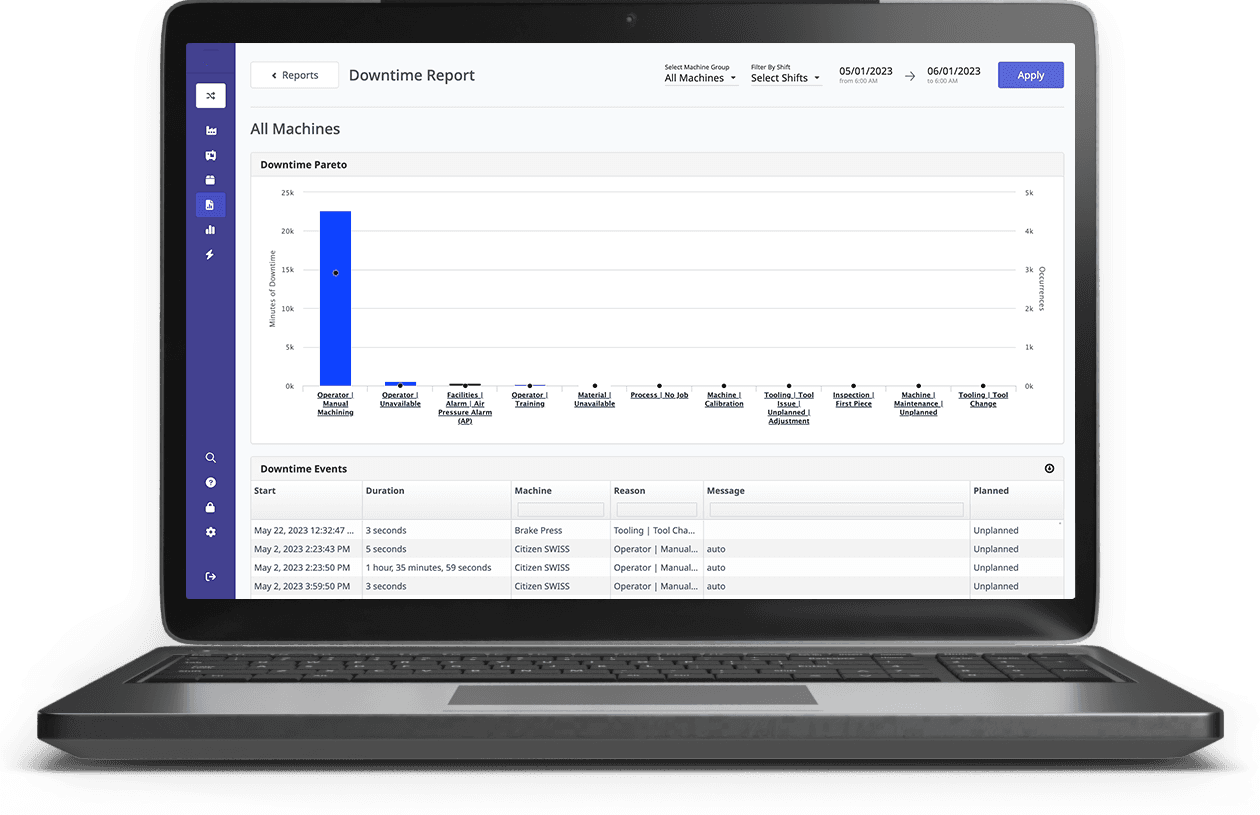
Manufacturers should be able to review machine-wise downtime, event duration, and recurring stoppage categories.
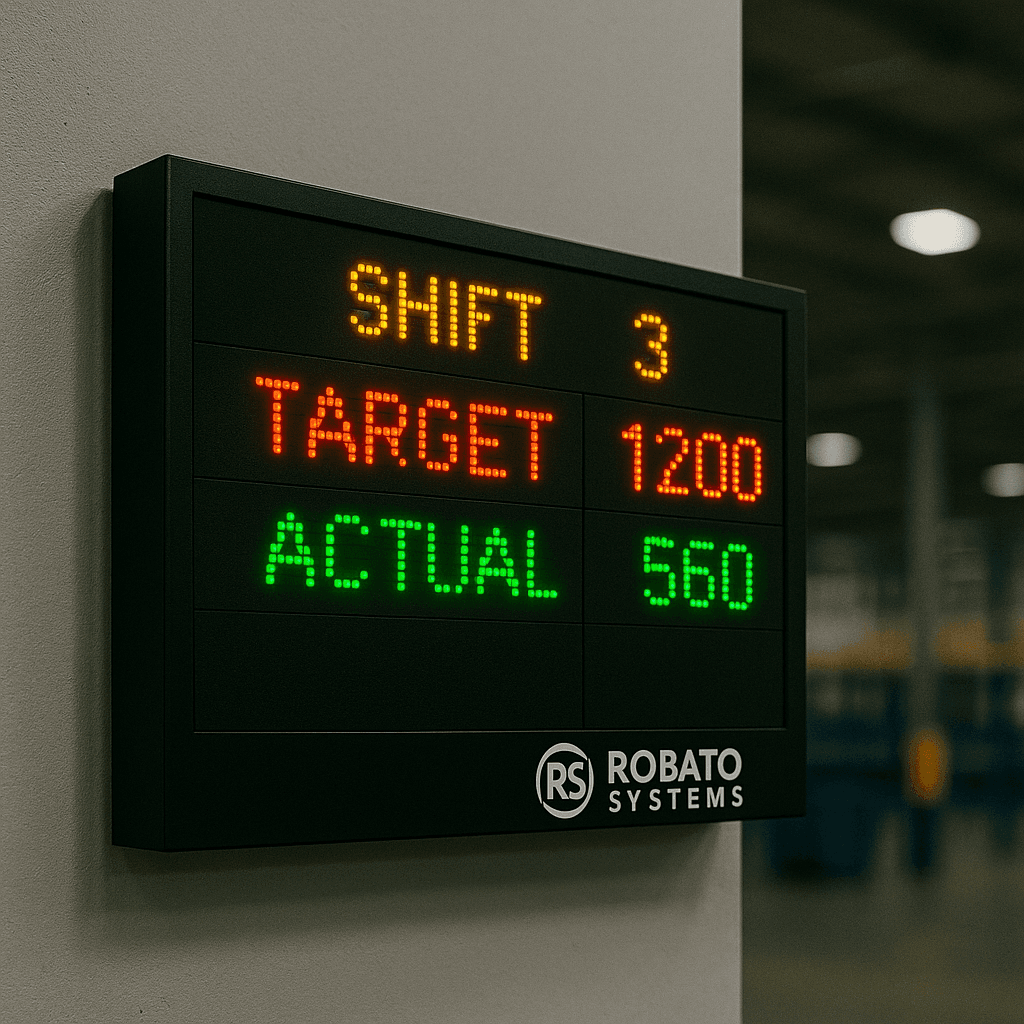
4. Production Target vs. Actual Tracking
Production target tracking compares actual output with planned production.
This helps teams understand whether a machine is meeting its production expectations and whether output losses may be affecting Performance.
5. Quality and Rejection Tracking
Quality data is essential for calculating the third component of OEE.
The monitoring platform should provide a reliable method to record total production, good parts, rejected parts, and rework according to the factory's quality rules.
6. Shift and Operator Performance Reports
Shift-wise reports help manufacturers compare production effectiveness across operating periods.
Depending on configuration, the system may also associate production records with operators or teams.
Such comparisons should account for job mix, machine conditions, and differences in production assignments.
7. Alerts and Notifications
Configured alerts can help teams identify important production conditions, such as low OEE, excessive downtime, or increasing rejection rates.
Notifications should be prioritized so users receive information that supports timely action rather than unnecessary alerts.
8. Cloud and On-Premises Deployment
Different factories have different data-security, connectivity, and infrastructure requirements.
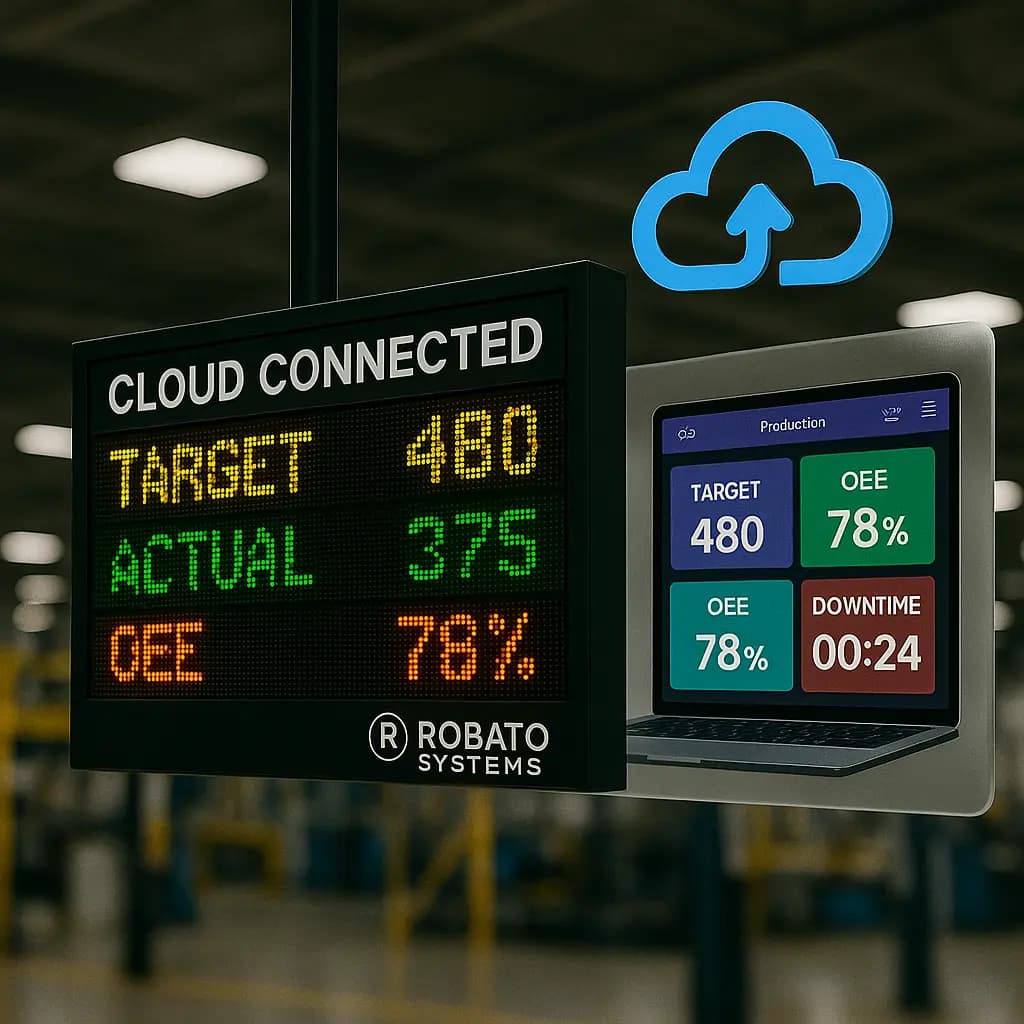
A cloud production monitoring system can support remote access to production information and centralized visibility across multiple locations.
An on-premises deployment may be more suitable for factories that prefer to maintain monitoring infrastructure within their own environment.
The appropriate architecture depends on security policies, network availability, integration requirements, and operational needs.
Benefits of CNC OEE Monitoring
Better Understanding of Machine Effectiveness
OEE provides a structured measurement of machine effectiveness by combining availability, performance, and quality.
This helps manufacturers identify whether production losses are primarily related to downtime, slow operating speed, or defective output.
Improved Downtime Analysis
Availability information helps teams understand how much planned production time is being lost.
When combined with downtime reasons, it can support maintenance investigations and help prioritize recurring equipment problems.
Improved Production Performance
Performance monitoring highlights the difference between actual production and the output expected at the ideal cycle time.
This helps engineers investigate slow cycles, minor stops, and process variations.
Better Quality Visibility
Tracking good and rejected components alongside total production helps manufacturers understand the impact of quality losses.
It also provides a consistent basis for evaluating quality-related improvement activities.
Data-Driven Production Decisions
OEE dashboards and historical reports provide a shared view of machine effectiveness.
Production managers can use this information to review performance, prioritize improvements, and evaluate whether corrective actions are working.
Improved Capacity Planning
Understanding actual machine effectiveness can help manufacturers make more realistic decisions about production schedules and available capacity.
Historical OEE data should be considered alongside job complexity, demand, maintenance requirements, and production constraints.
CNC OEE Monitoring vs. CNC Machine Monitoring
CNC machine monitoring and CNC OEE monitoring are closely related, but they do not measure exactly the same thing.
CNC machine monitoring focuses on collecting machine operating information such as running status, alarms, cycle activity, and downtime.
CNC OEE monitoring uses production, operating-time, and quality information to calculate an overall effectiveness measurement.
| Comparison | CNC Machine Monitoring | CNC OEE Monitoring |
|---|---|---|
| Main purpose | Monitor machine operation and activity | Measure overall equipment effectiveness |
| Typical information | Running status, alarms, cycles, downtime | Availability, Performance, Quality |
| Production data | May include machine production counts | Requires total and good production counts |
| Quality information | Not always included | Required for accurate OEE |
| Main output | Machine status, events, and reports | OEE percentage and loss analysis |
Machine monitoring can provide important data for OEE calculations, but additional production and quality information may be required.
How to Implement CNC OEE Monitoring in a Factory
A successful OEE implementation requires consistent definitions, reliable data collection, and participation from production, maintenance, and quality teams.
Step 1: Identify the Machines to Monitor
Start by selecting the CNC machines or production lines that are most important to your manufacturing objectives.
Consider machines with frequent stoppages, high production demand, limited performance visibility, or recurring quality issues.
Step 2: Define Planned Production Time
Establish how planned production time will be calculated.
Define which periods are included in the OEE calculation and how scheduled breaks, planned maintenance, setup, and changeovers will be handled.
Consistency is essential when comparing machines and shifts.
Step 3: Establish Ideal Cycle Times
Define the expected cycle time for each relevant machine and production job.
Use validated production standards rather than arbitrary targets. Where different parts require different cycle times, configure the appropriate standards for each job.
Step 4: Configure Machine Connectivity
Assess CNC controller compatibility and determine how machine status and cycle information will be collected.
Depending on the equipment, data may be obtained through PLCs, controller interfaces, sensors, or gateways.
Step 5: Configure Production and Quality Data
Establish how total production, good parts, rejected parts, and rework will be recorded.
Validate the production counting and quality-entry methods against actual manufacturing records.
Step 6: Configure OEE Dashboards
Set up machine-wise, shift-wise, and production-line dashboards.
Ensure that users can review Availability, Performance, Quality, and the losses contributing to the OEE result.
Step 7: Run a Pilot and Validate Results
Start with a limited number of machines.
Compare the system's calculations with independently verified production and downtime records. Investigate differences and correct the configuration before wider deployment.
Step 8: Review Losses and Improve Continuously
Use the results to identify the most significant production losses.
Assign improvement actions to the relevant teams and review the effect of those actions in subsequent reporting periods.
Common Challenges in CNC OEE Monitoring
Inaccurate Machine Data
Incorrect controller signals, sensor placement, or machine-state configuration can produce misleading operating-time records.
Recommended approach: Validate signals against actual machine operation and establish regular data-quality checks.
Incorrect Ideal Cycle Times
Using unrealistic cycle-time standards can make Performance appear artificially high or low.
Recommended approach: Establish validated cycle times for each relevant part and machining process.
Incomplete Quality Information
If rejected components are not recorded consistently, the Quality calculation may be inaccurate.
Recommended approach: Establish a clear process for recording good parts, rejected parts, and reworked components.
Inconsistent Downtime Definitions
Different teams may classify the same event differently, leading to inconsistent Availability calculations.
Recommended approach: Define downtime categories and planned production time rules before starting OEE reporting.
Resistance to New Monitoring Processes
Operators may be unfamiliar with digital monitoring or concerned about additional data-entry responsibilities.
Recommended approach: Involve operators in the implementation, explain how the information will be used, and keep manual input requirements practical.
Focusing Only on the OEE Percentage
A single OEE value does not explain the reason behind a production loss.
Recommended approach: Review Availability, Performance, Quality, and their underlying events separately. Use the results to identify specific improvement opportunities.
How to Choose the Right CNC OEE Monitoring Software
Before selecting an OEE platform, manufacturers should evaluate its technical capabilities and suitability for their production environment.
1. CNC Controller Compatibility
Confirm that the software can collect information from the CNC controllers, PLCs, sensors, and other data sources used in the factory.
2. Accurate OEE Calculations
Check how the platform calculates Availability, Performance, and Quality.
Confirm that users can configure planned production time, ideal cycle times, production counts, and quality rules appropriately.
3. Automated Data Collection
Evaluate whether machine status, cycle information, and production counts can be collected automatically through compatible interfaces.
Understand which information still requires operator input.
4. Downtime Analysis
Check whether the system records stoppage events and supports useful downtime categories, historical reports, and reason analysis.
5. Quality Tracking
Confirm how good parts, rejected parts, and rework are recorded and incorporated into OEE calculations.
6. Dashboard and Reporting Capabilities
Evaluate whether the software provides machine-level, line-level, and plant-level views, along with shift-wise reports and historical trends.
7. Scalability and Integration
Consider whether the system can support additional machines, production lines, facilities, and integrations with existing manufacturing applications.
8. Deployment and Data Security
Review cloud, on-premises, and hybrid deployment options. Assess access controls, data storage, network requirements, and backup arrangements.
9. Implementation and Support
Evaluate the provider's experience with industrial connectivity, OEE configuration, operator training, and ongoing technical support.
A pilot installation is a practical way to confirm that the software can calculate OEE accurately using actual factory data.
Frequently Asked Questions
1. What is CNC OEE monitoring?
CNC OEE monitoring is the process of measuring the Overall Equipment Effectiveness of CNC machines using Availability, Performance, and Quality data. It helps manufacturers identify production losses and evaluate machine effectiveness.
2. What is the formula for CNC OEE?
The formula is:
OEE = Availability × Performance × Quality
All three components are calculated as percentages. Their product gives the overall OEE percentage.
3. What is a good OEE percentage for CNC machines?
An OEE of 85% is a commonly referenced manufacturing benchmark, but it is not a universal requirement. Manufacturers should establish a reliable baseline and set realistic improvement targets based on their production conditions.
4. What data is required to calculate CNC OEE?
The main requirements are planned production time, operating time, ideal cycle time, total production count, and good production count. Consistent downtime and quality records are also important.
5. Can CNC OEE be calculated automatically?
Yes, when the monitoring system has access to reliable machine, production, and quality data. Some information may still require operator input, depending on the machine and integration.
6. What is the difference between Availability and Performance?
Availability measures how much of planned production time the machine actually operates. Performance measures how closely its actual production speed matches the expected speed during operating time.
7. Does OEE include rejected components?
Yes. Rejected components are included in total production but not in good production. They reduce the Quality component of OEE.
8. Can multiple CNC machines be monitored through one OEE dashboard?
Yes. A suitable OEE monitoring platform can consolidate information from compatible machines and display OEE at machine, line, and plant levels.
9. How often should CNC OEE be reviewed?
OEE can be monitored during production through live dashboards and reviewed at the end of each shift, day, or reporting period. The appropriate review frequency depends on operational requirements and the quality of available data.
10. Can CNC OEE monitoring help improve productivity?
It can help identify downtime, speed losses, and quality problems that affect production effectiveness. Productivity improvements depend on how manufacturers investigate these losses and implement corrective actions.
Conclusion
CNC OEE monitoring gives manufacturers a structured way to understand how effectively their CNC machines are being used. By measuring Availability, Performance, and Quality together, manufacturers can identify production losses that may remain hidden when reviewing machine status or output alone.
Accurate OEE reporting depends on reliable machine data, realistic cycle-time standards, consistent downtime definitions, and complete quality records.
Rather than focusing only on achieving a particular OEE percentage, manufacturers should use the measurement to identify the biggest sources of production loss and prioritize practical improvements.
Looking to measure and improve CNC machine effectiveness? Explore Robato Systems' OEE monitoring capabilities to understand how connected production counters, PLC data, downtime records, quality information, and centralized dashboards can support better manufacturing decisions. Start by evaluating your current production data and identifying the machines where improved performance visibility can make the greatest difference.