Introduction
Manufacturing operations depend on the reliable and efficient use of machines. When equipment spends too much time idle, experiences frequent downtime, operates below its expected capacity, or produces inconsistent output, production efficiency can decline without being immediately visible.
Machine Efficiency Monitoring provides manufacturers with a structured way to observe machine activity, measure operational performance, and identify where production time or capacity is being lost.
Instead of depending entirely on manual observations and end-of-shift reports, businesses can use connected machine data to understand when equipment is running, idle, stopped, or producing. This information can then be analyzed through dashboards and reports to identify recurring patterns and support operational improvements.
This guide explains what machine efficiency monitoring means, how it works, which metrics are important, its benefits, implementation considerations, and how manufacturers can use it to improve equipment performance.
What Is Machine Efficiency Monitoring?
Machine efficiency monitoring is the process of continuously or periodically collecting and analyzing data about how effectively manufacturing equipment is being used.
The monitoring process can include information such as:
Machine running status
Machine runtime
Machine idle time
Planned and unplanned downtime
Production cycles
Production output
Equipment utilization
Operating trends
Production interruptions
The purpose is not simply to determine whether a machine is switched on or off. Effective monitoring provides context around machine activity so production teams can understand how available operating time is being used.
For example, if a machine is scheduled to operate for eight hours but produces for only six hours, monitoring can help identify what happened during the remaining two hours.
Why Is Machine Efficiency Monitoring Important?
Manufacturing losses are not always obvious.
A few minutes of delay on one machine may appear insignificant. However, repeated delays across several machines and multiple shifts can represent a substantial amount of lost production time.
Common causes include:
Unplanned breakdowns
Material shortages
Tool changes
Changeovers
Operator availability
Quality problems
Maintenance activities
Process interruptions
Waiting for upstream or downstream processes
Without reliable machine data, teams may know that production targets were missed but have difficulty determining why.
Machine efficiency monitoring helps bridge this information gap by creating a measurable record of machine activity.
How Does Machine Efficiency Monitoring Work?
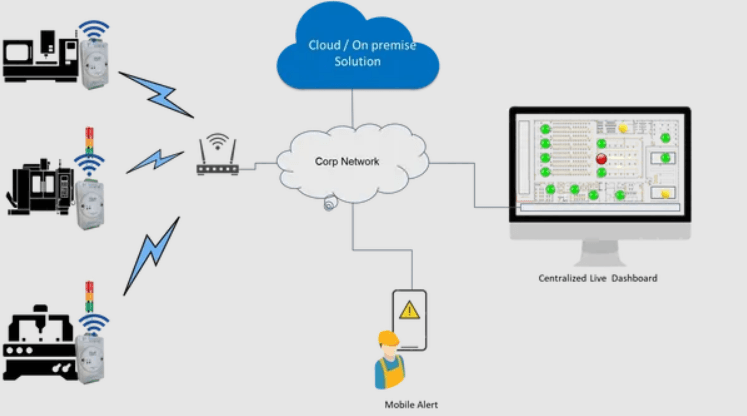
A typical machine efficiency monitoring system involves several stages.
1. Collect Machine Data
The first step is collecting information from the equipment.
Depending on the machine and factory infrastructure, data may come from:
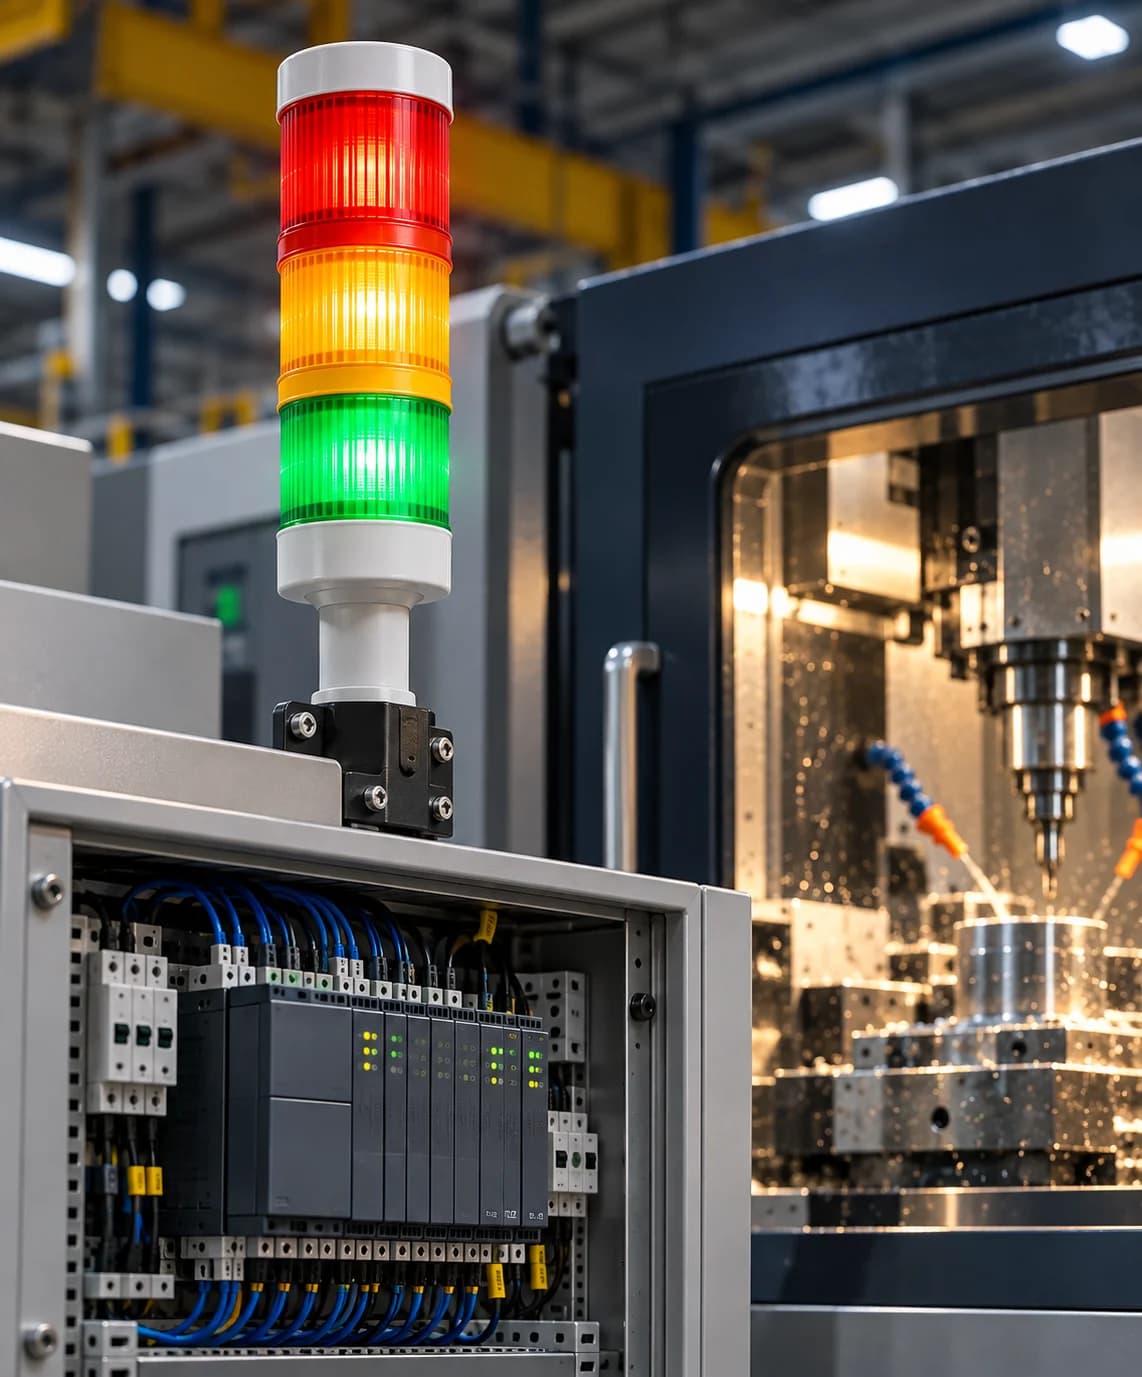
PLCs
CNC controllers
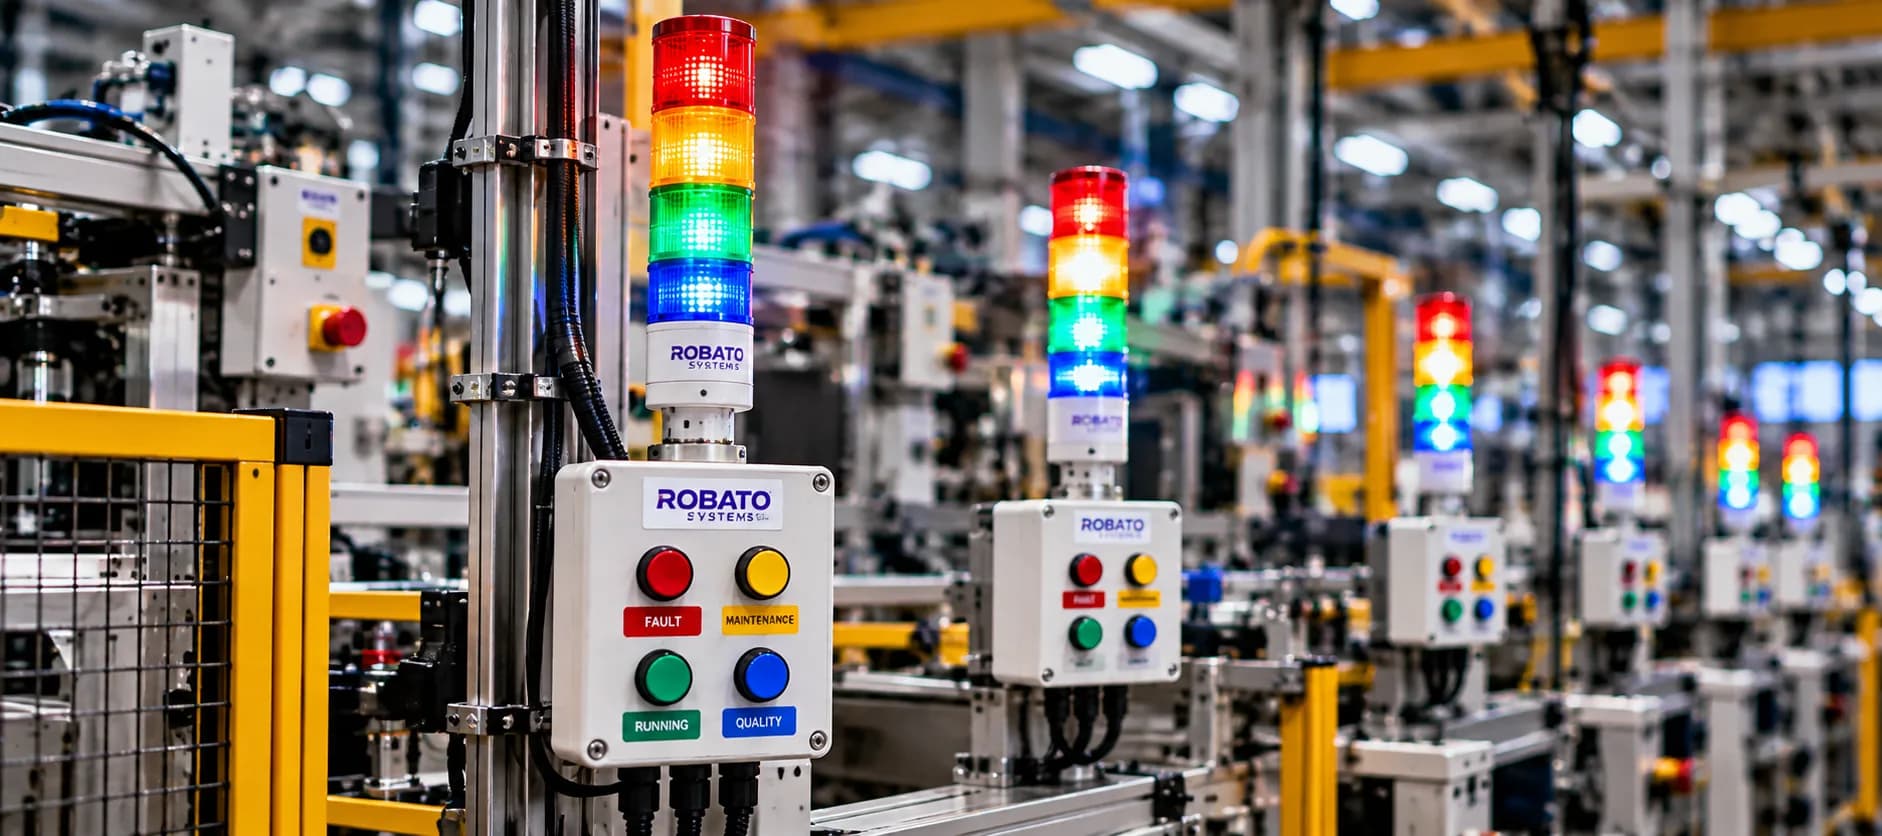
Industrial sensors
Machine controllers
IoT gateways
Industrial communication interfaces
Existing production systems
The exact method depends on the age, manufacturer, and connectivity capabilities of the equipment.
2. Identify Machine States
Raw signals need to be interpreted into meaningful machine states.
For example, a monitoring system may classify equipment as:
Running
Idle
Stopped
Maintenance
Fault
Production
These classifications allow the software to distinguish between different types of machine activity.
3. Process the Data
The collected information is processed and organized into usable production metrics.
This can include calculating runtime, downtime, idle duration, utilization, production cycles, and other operational indicators.
4. Display the Information
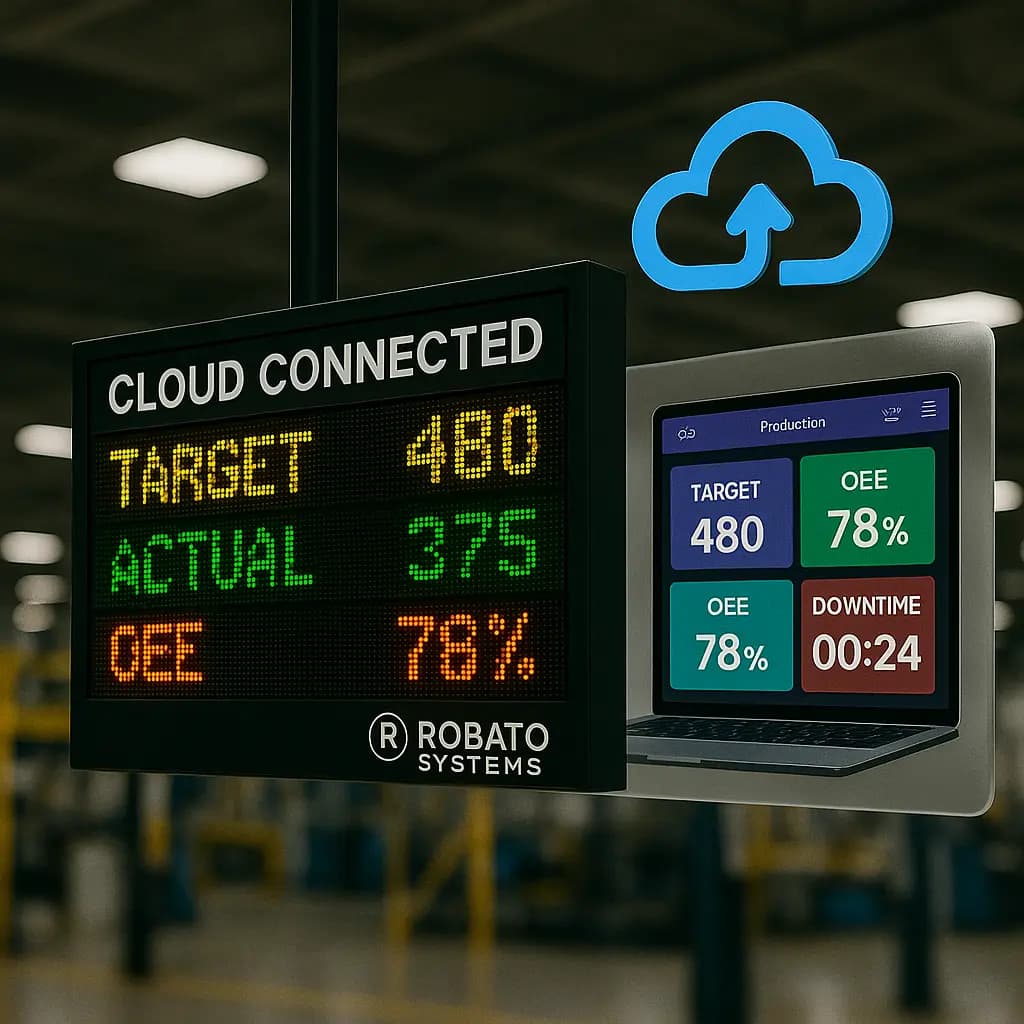
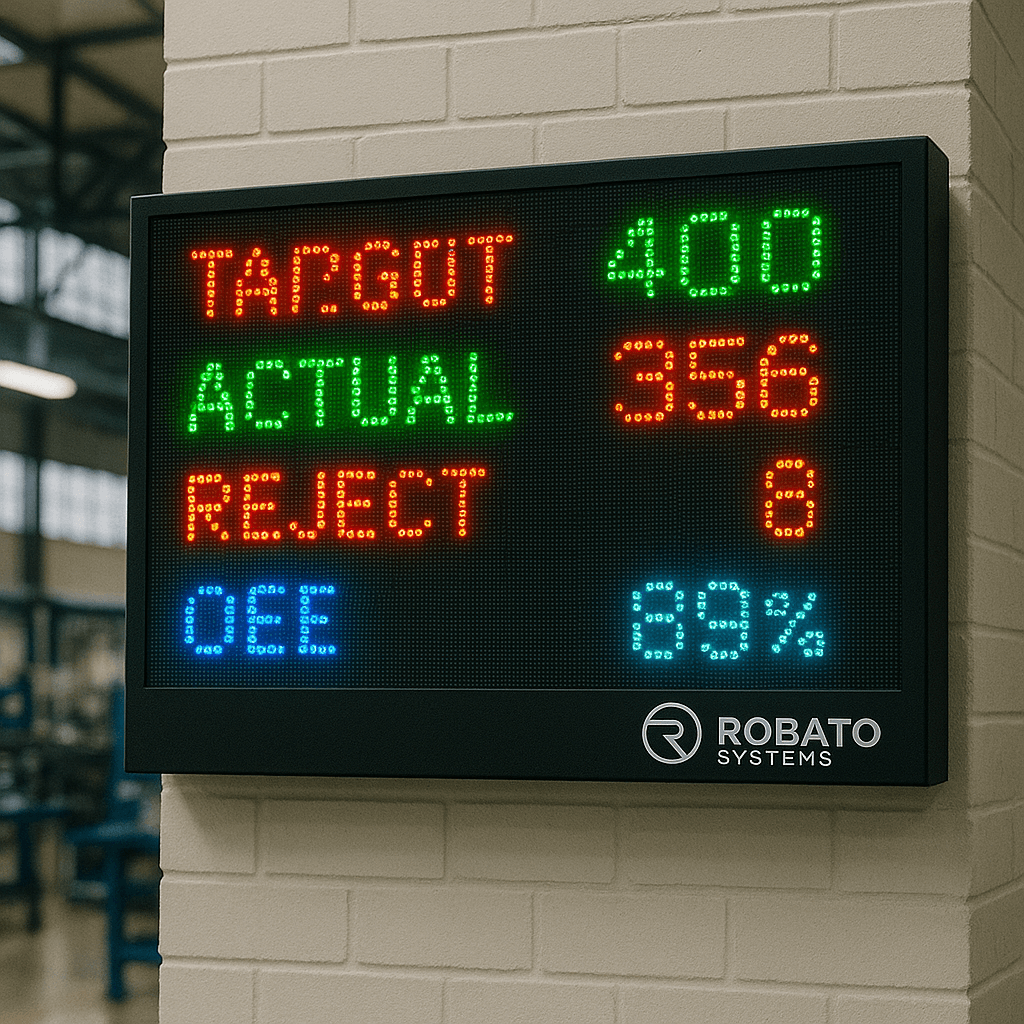
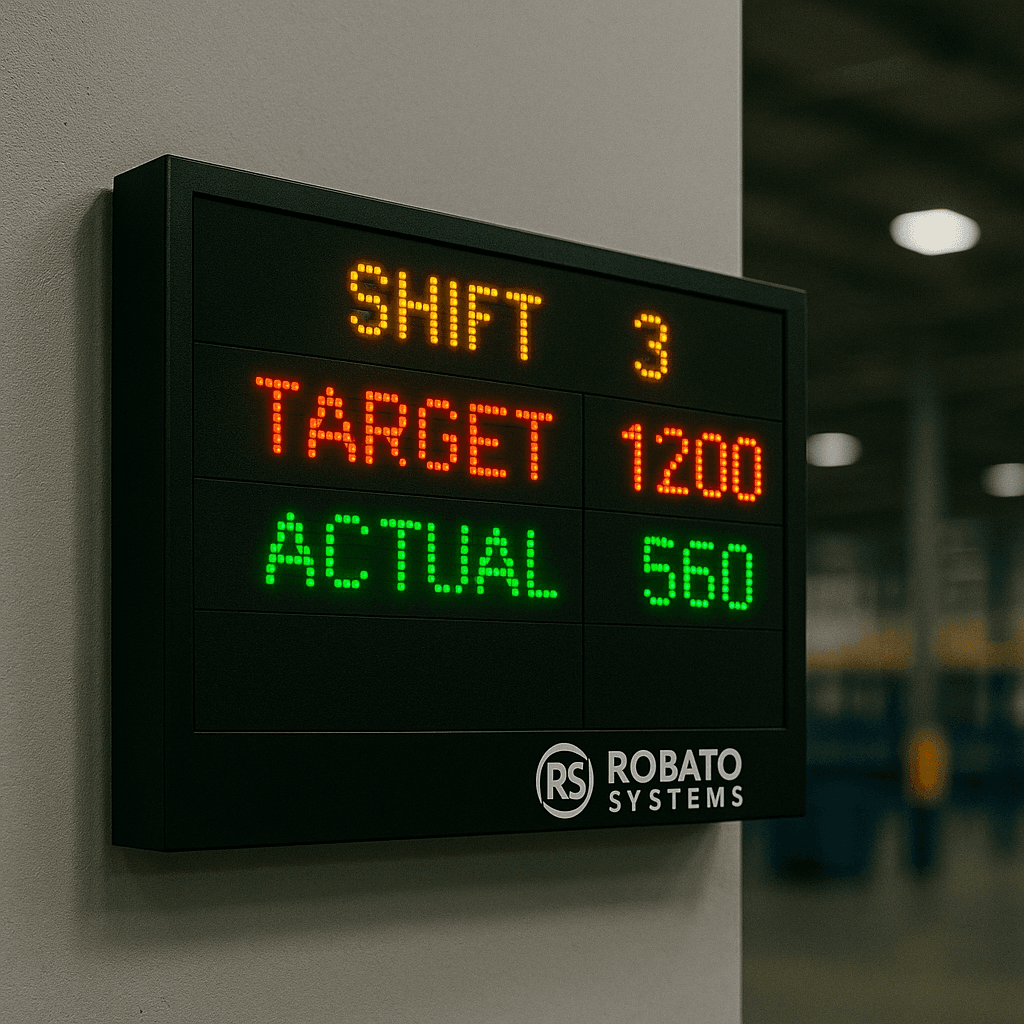
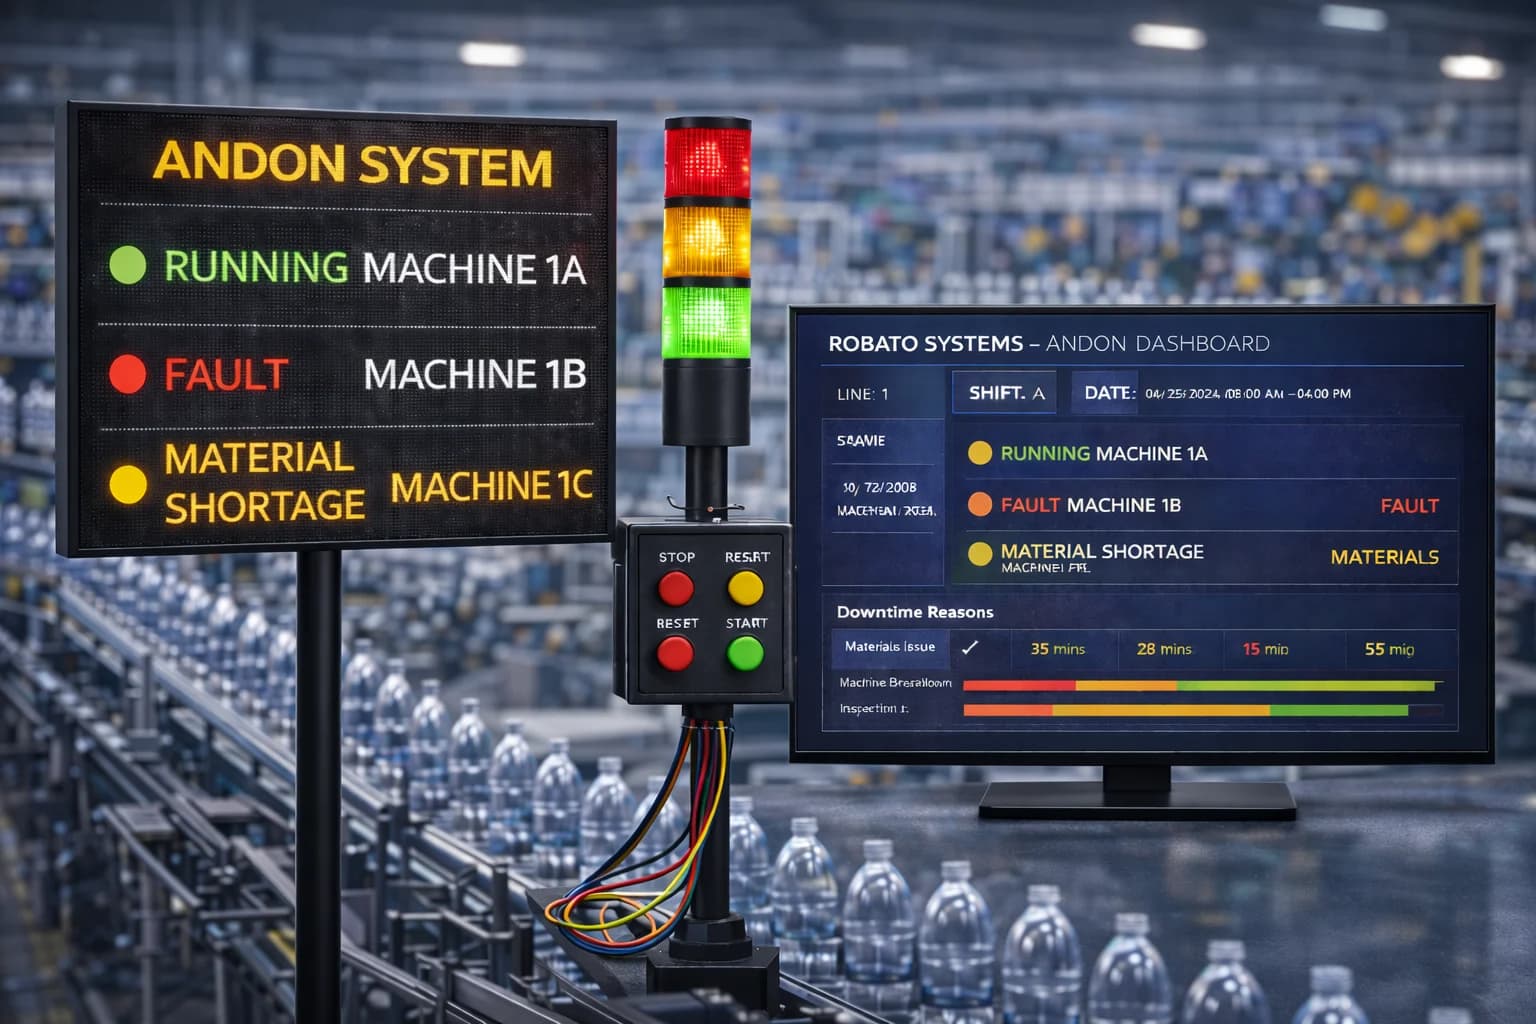
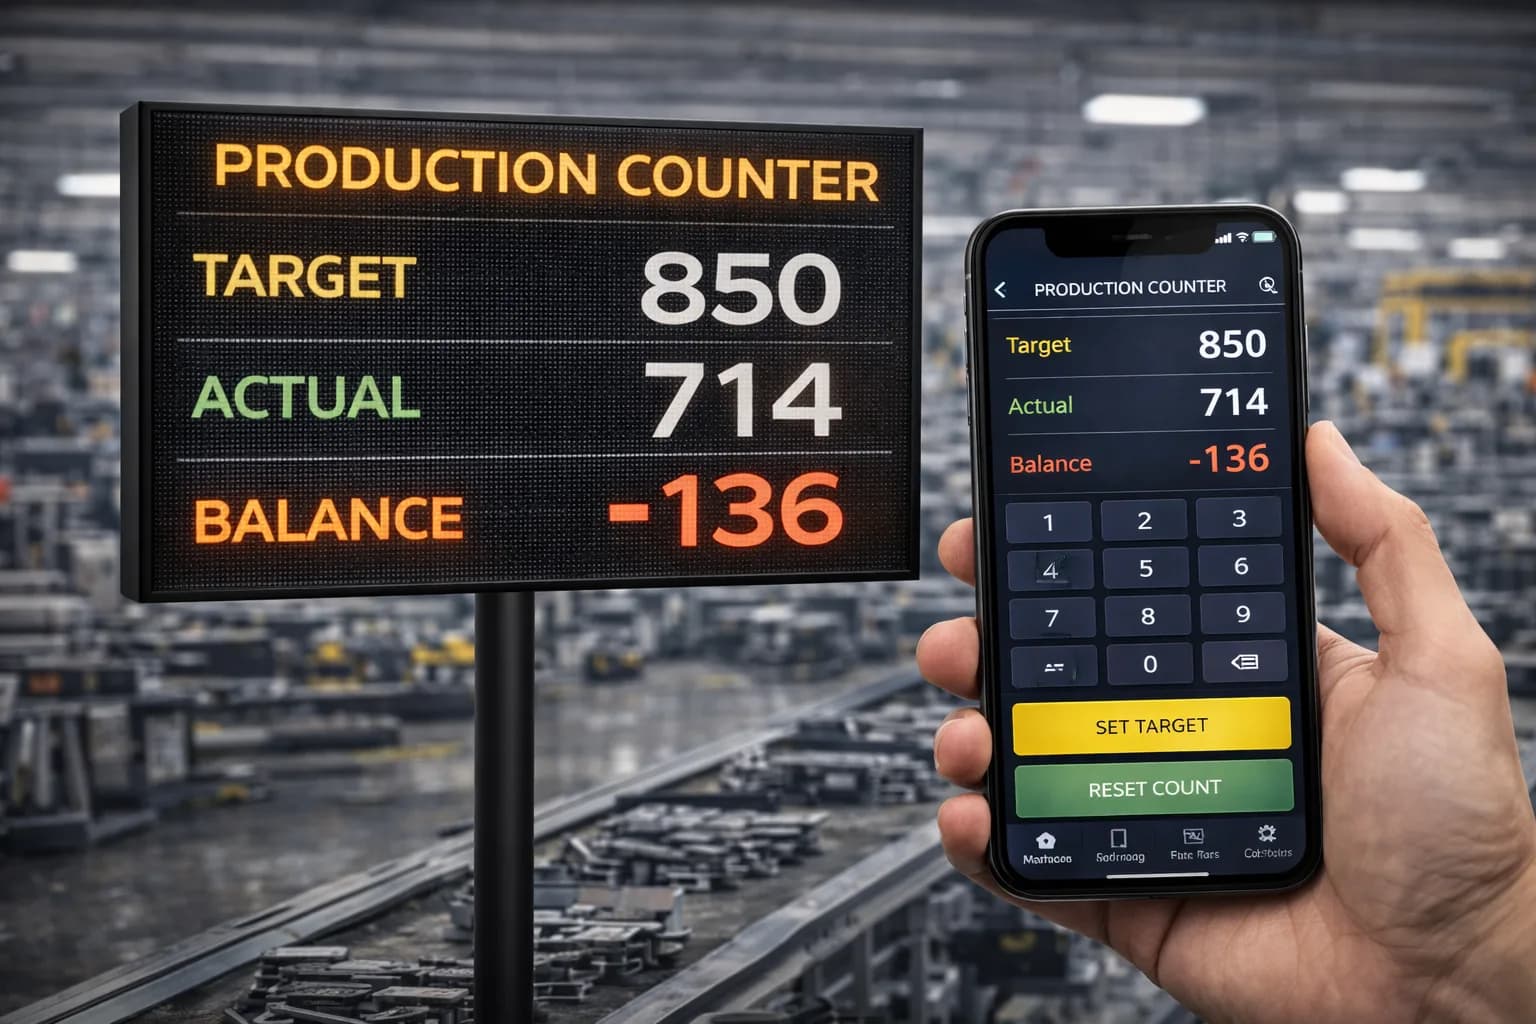
The processed data is presented through dashboards, reports, or monitoring screens.
A production supervisor may want to see current machine status, while a plant manager may be more interested in daily or weekly efficiency trends.
5. Analyze and Improve
The final step is using the information to identify operational problems.
For example, if one machine consistently shows extended idle periods during a particular shift, management can investigate the reason rather than simply accepting the lower output.
What Data Is Used for Machine Efficiency Monitoring?
The data required depends on the monitoring objectives and available machine interfaces.
Machine Status
Machine status indicates the current operating condition of equipment.
Typical states include running, idle, stopped, fault, or maintenance.
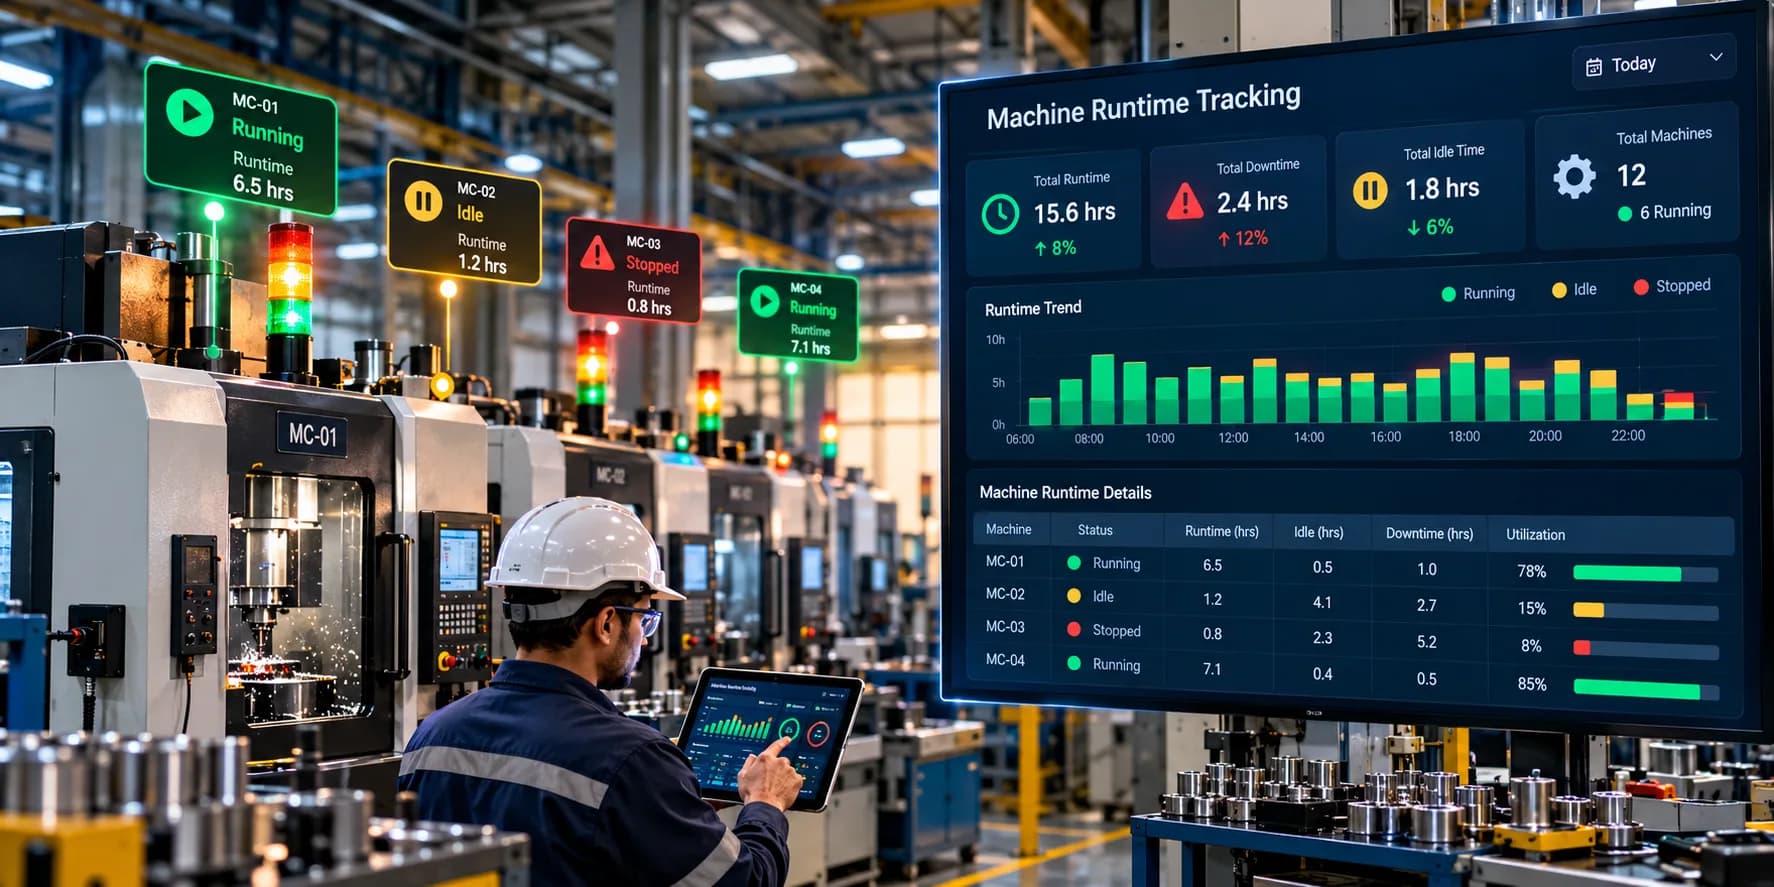
Runtime
Runtime represents the period during which equipment is actively operating.
Monitoring runtime helps teams understand actual machine usage.
Downtime
Downtime measures periods when the machine is unavailable or not producing.
Downtime can be further classified into planned and unplanned events.
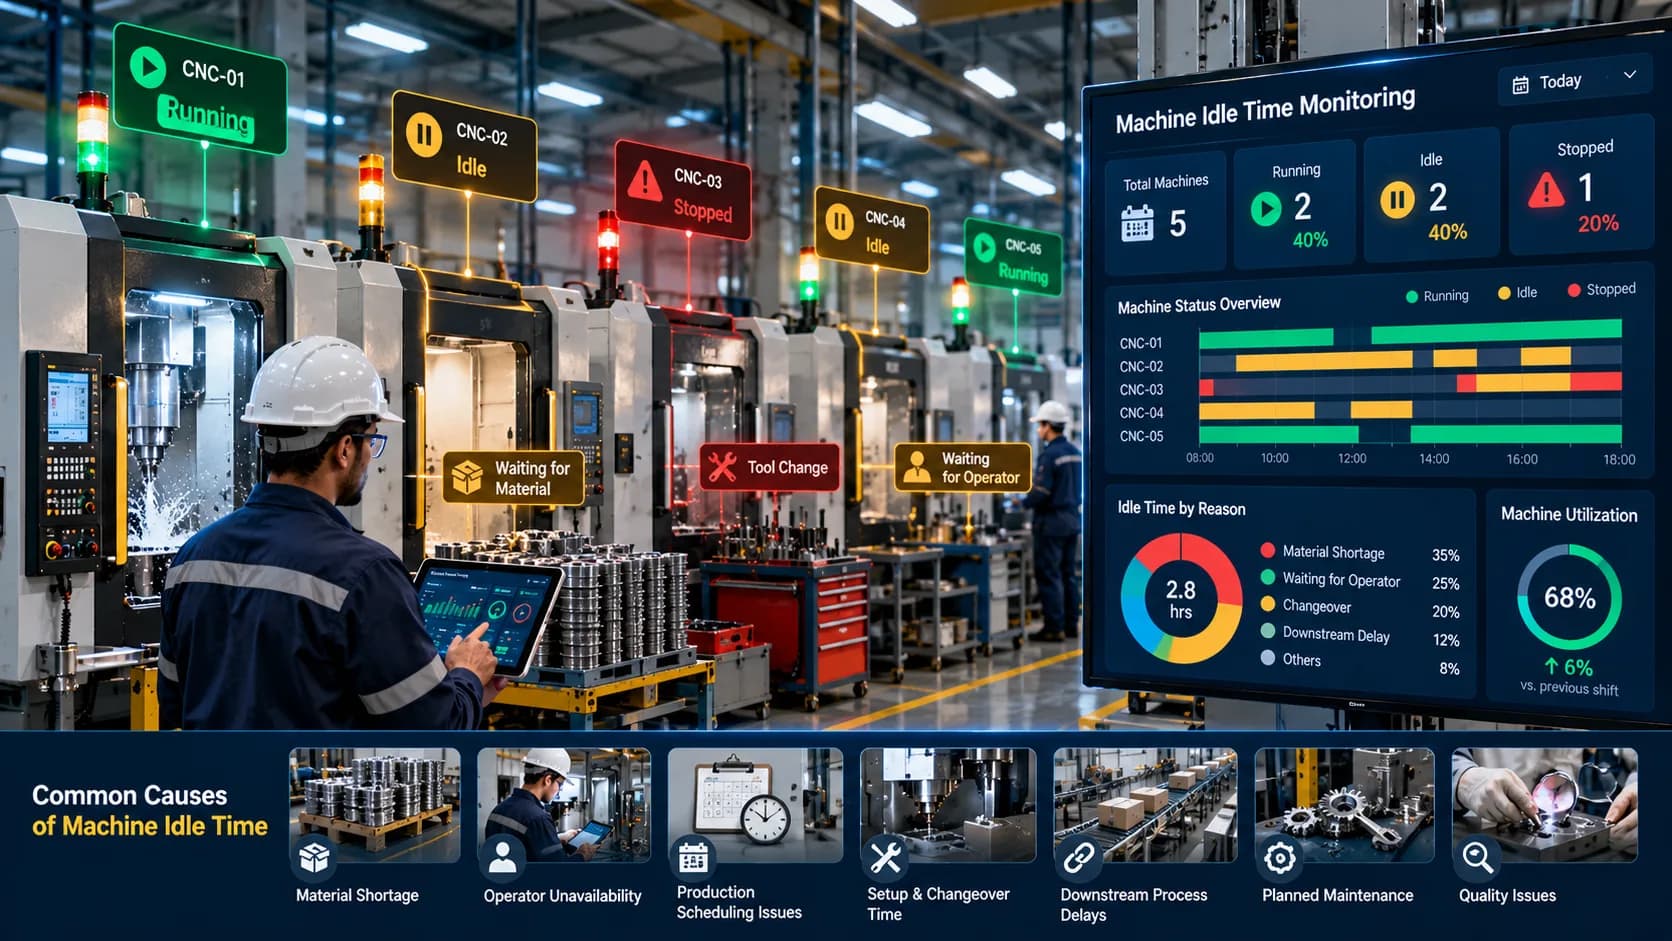
Idle Time
Idle time represents periods when a machine is available but is not actively producing.
Repeated idle periods can indicate scheduling, material, operator, or process-related issues.
Production Count
Where available, production counts provide information about how many units or cycles the machine has completed.
Cycle Time
Cycle time measures how long a machine takes to complete a production cycle.
Monitoring cycle time can help identify changes in production performance.
Key Machine Efficiency Monitoring Metrics
A monitoring system becomes more useful when it tracks metrics that are relevant to production objectives.
Machine Utilization
Machine utilization helps determine how much of the available equipment capacity is being used.
For example, consistently low utilization may indicate scheduling problems, excess capacity, material constraints, or process bottlenecks.
Machine Runtime
Runtime shows how long equipment has actively operated during a defined period.
Comparing runtime across shifts can reveal differences in machine usage.
Machine Downtime
Downtime shows how much production time was lost because equipment was unavailable or stopped.
Analyzing downtime trends can help identify recurring operational issues.
Idle Time
Idle time highlights periods when equipment is available but not producing.
Reducing unnecessary idle time can improve the use of existing machine capacity.
Production Output
Production output measures the quantity produced during a particular period.
Output becomes more meaningful when evaluated alongside runtime and machine utilization.
Cycle Time
Cycle-time monitoring helps production teams understand whether equipment is operating at expected production speeds.
Availability
Availability indicates whether equipment is ready for production when it is scheduled to be used.
Machine Efficiency Monitoring vs. Machine Performance Monitoring
The terms are closely related, but they can have different scopes.
Machine efficiency monitoring generally focuses on how effectively available machine time and capacity are being used.
Machine performance monitoring can have a broader focus on the operating behavior and production performance of equipment.
For example:
| Machine Efficiency Monitoring | Machine Performance Monitoring |
|---|---|
| Focuses on efficient use of available time | Focuses on equipment operating performance |
| Runtime | Production speed |
| Idle time | Cycle time |
| Downtime | Output |
| Utilization | Performance trends |
| Capacity usage | Operational behavior |
In practice, organizations may use both approaches together because machine efficiency and performance are closely connected.
Benefits of Machine Efficiency Monitoring
1. Improved Production Visibility
Managers can see what is happening on the factory floor without relying entirely on manually prepared reports.
2. Faster Identification of Production Losses
Monitoring makes it easier to identify downtime, idle periods, and recurring interruptions.
3. Better Equipment Utilization
Organizations can determine which machines are heavily used and which machines have unused capacity.
4. More Reliable Production Data
Automated monitoring can provide a consistent source of machine activity information.
5. Improved Shift Analysis
Machine data can be compared across shifts to identify differences in utilization, downtime, and output.
6. Better Capacity Planning
Historical equipment usage can provide useful information when planning future production requirements.
7. Support for Continuous Improvement
Production teams can use historical data to measure whether process changes actually improve machine efficiency.
How Machine Efficiency Monitoring Helps Reduce Downtime
Downtime is one of the most important areas that manufacturers can investigate using machine monitoring.
Consider a machine that stops several times during every shift.
Without monitoring, a supervisor may only know that the daily production target was missed.
With machine efficiency monitoring, the organization can identify:
When the machine stopped
How long it remained stopped
How frequently the stops occurred
Whether the pattern repeats
Which shift experienced the issue
Whether downtime was planned or unplanned
This information creates a more reliable starting point for investigating the underlying cause.
Monitoring itself does not automatically eliminate downtime. Its value comes from making production losses measurable and easier to investigate.
How Machine Efficiency Monitoring Helps Improve Utilization
A machine can be available but still not be effectively utilized.
For example, equipment may remain idle because:
Materials have not arrived
Operators are unavailable
Production orders are delayed
Another process is creating a bottleneck
Changeovers take longer than expected
Maintenance is pending
Production scheduling is inefficient
By analyzing idle periods and machine availability, production teams can investigate why available capacity is not being used.
Real-Time vs. Historical Machine Monitoring
Both real-time and historical monitoring provide different types of value.
Real-Time Monitoring
Real-time monitoring helps supervisors understand the current condition of equipment.
It can support faster responses to:
Machine stoppages
Extended idle periods
Production interruptions
Unexpected operating conditions
Historical Monitoring
Historical monitoring helps identify trends over longer periods.
Teams can analyze:
Daily performance
Weekly trends
Monthly utilization
Shift comparisons
Recurring downtime
Production patterns
A comprehensive monitoring strategy often uses both.
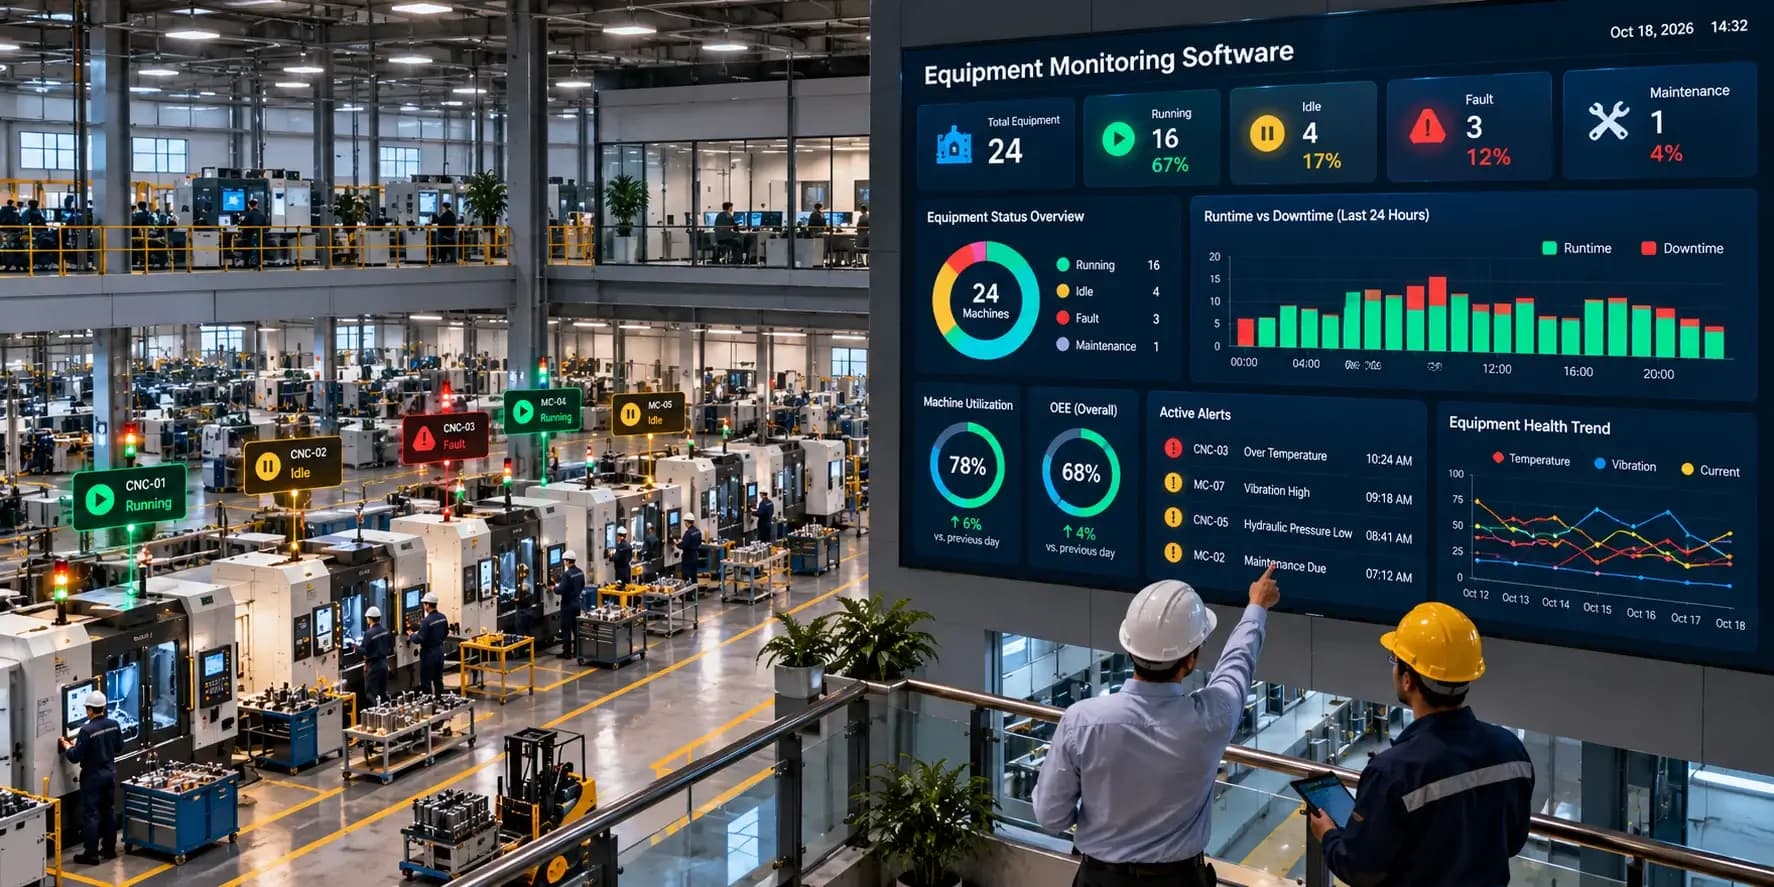
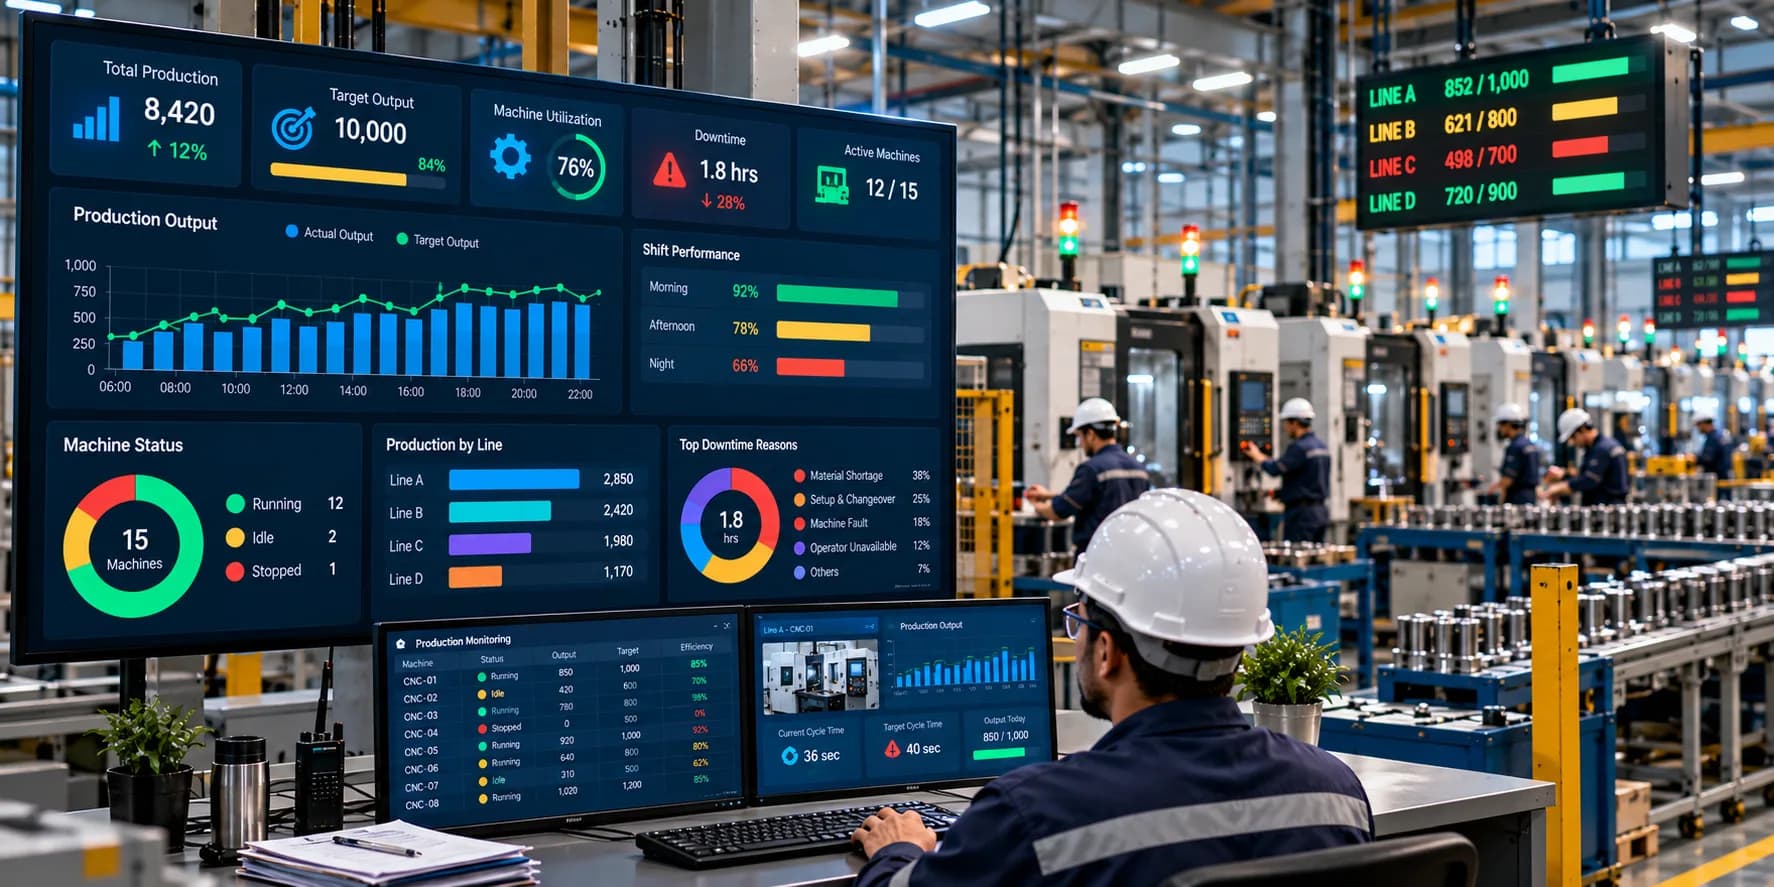
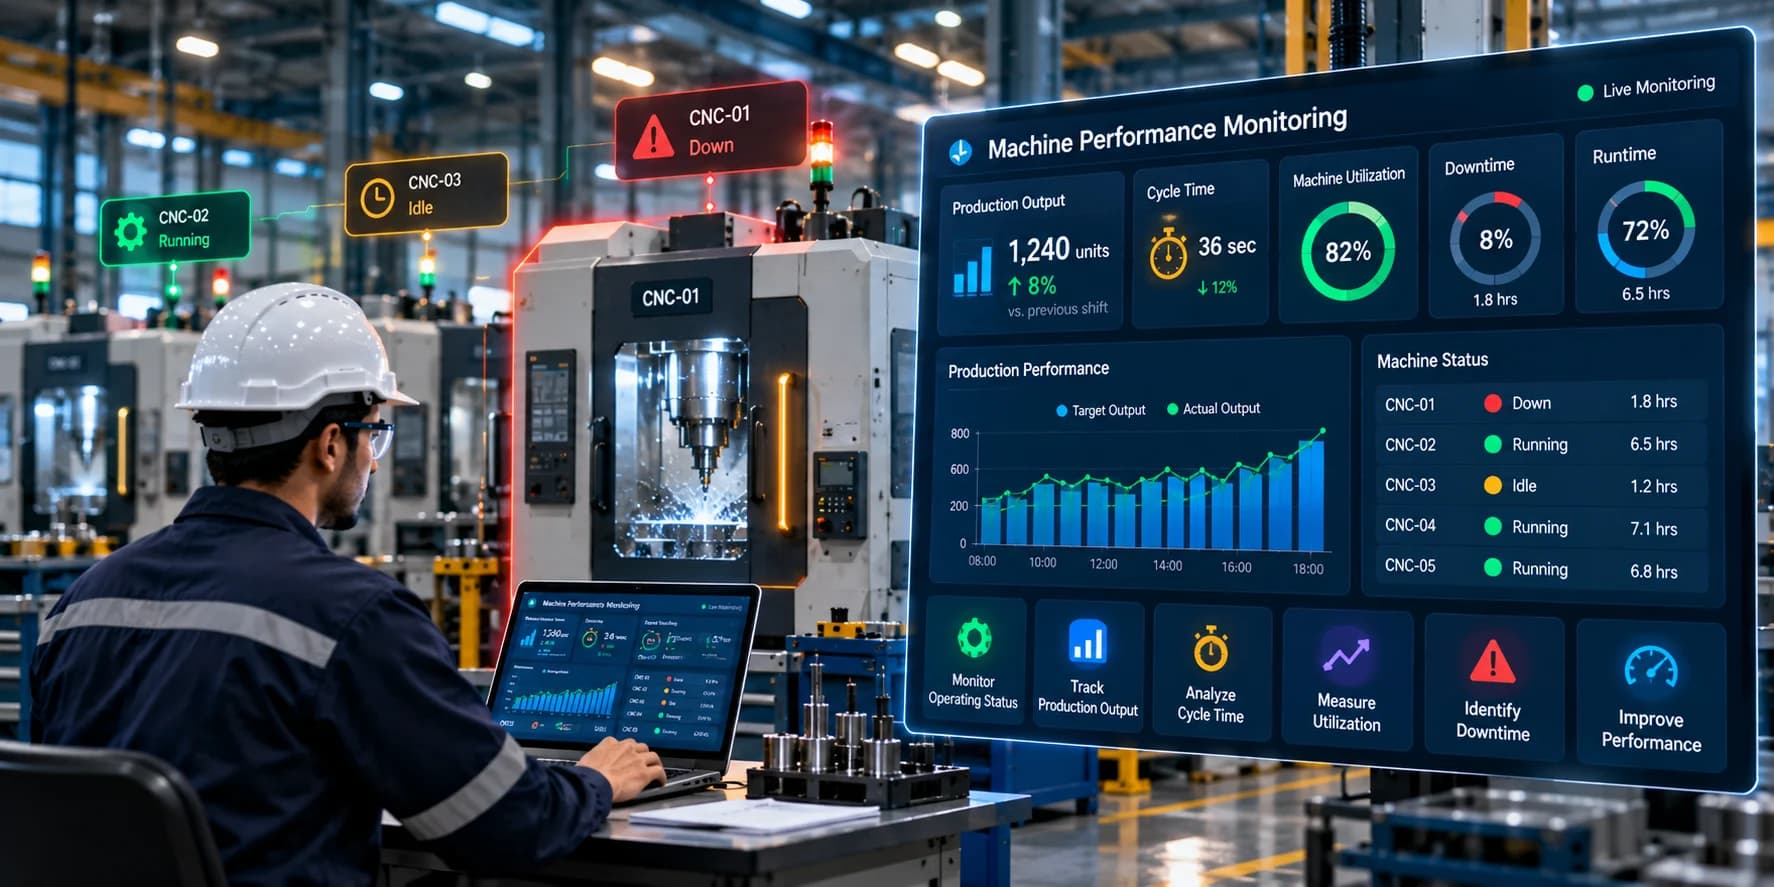
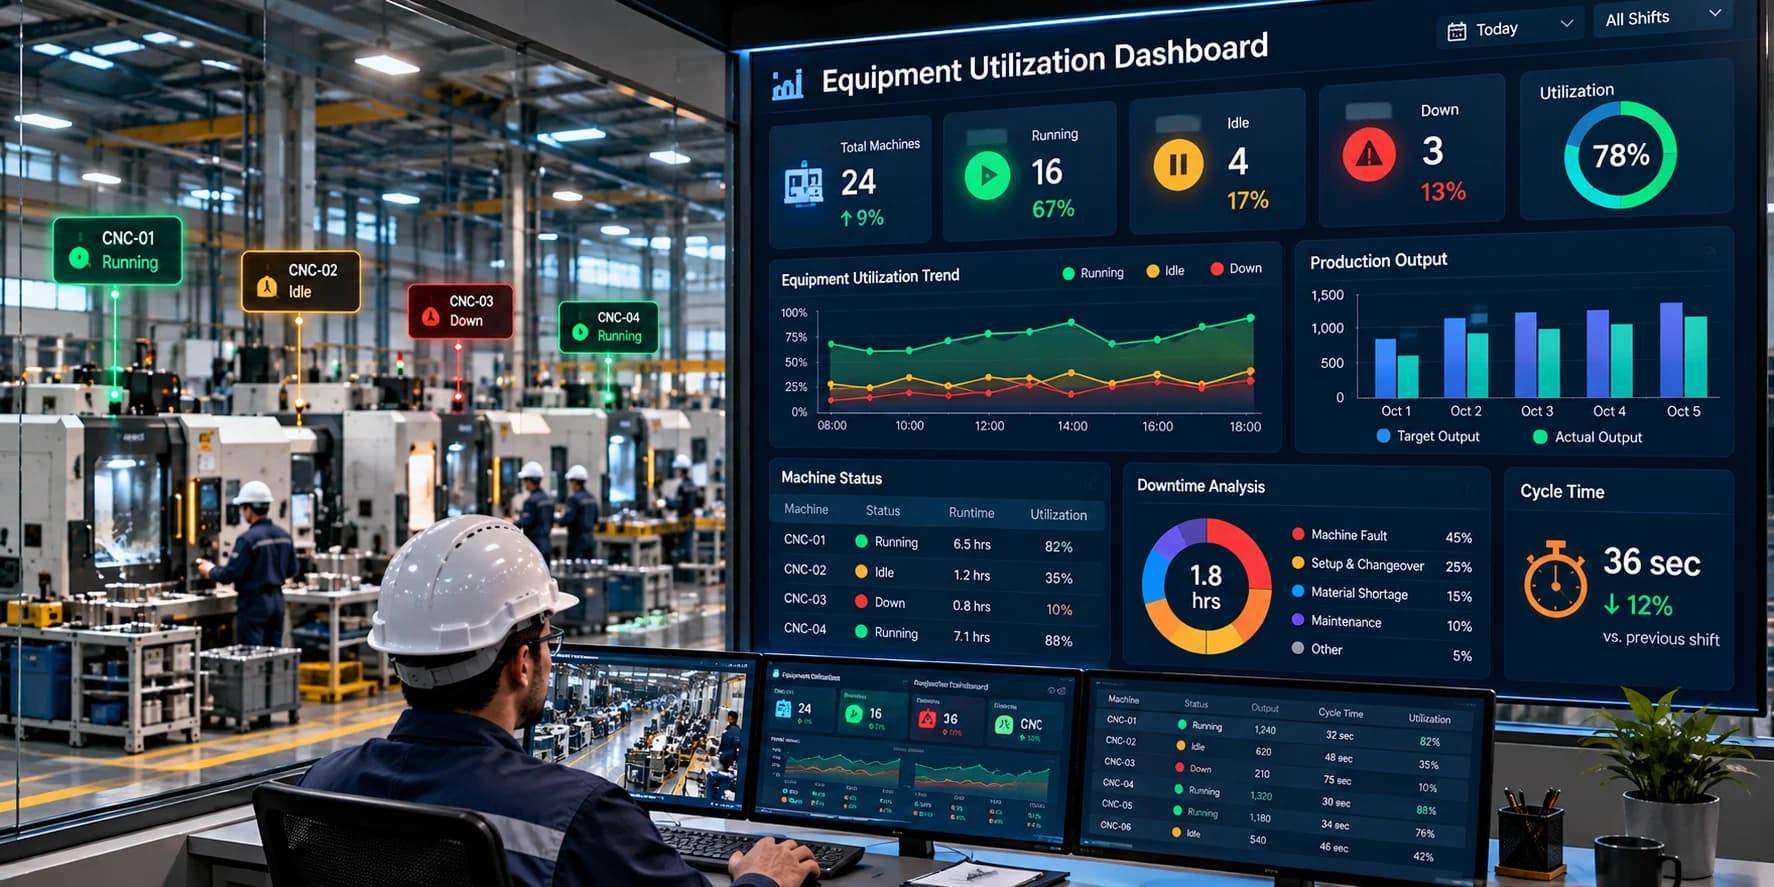
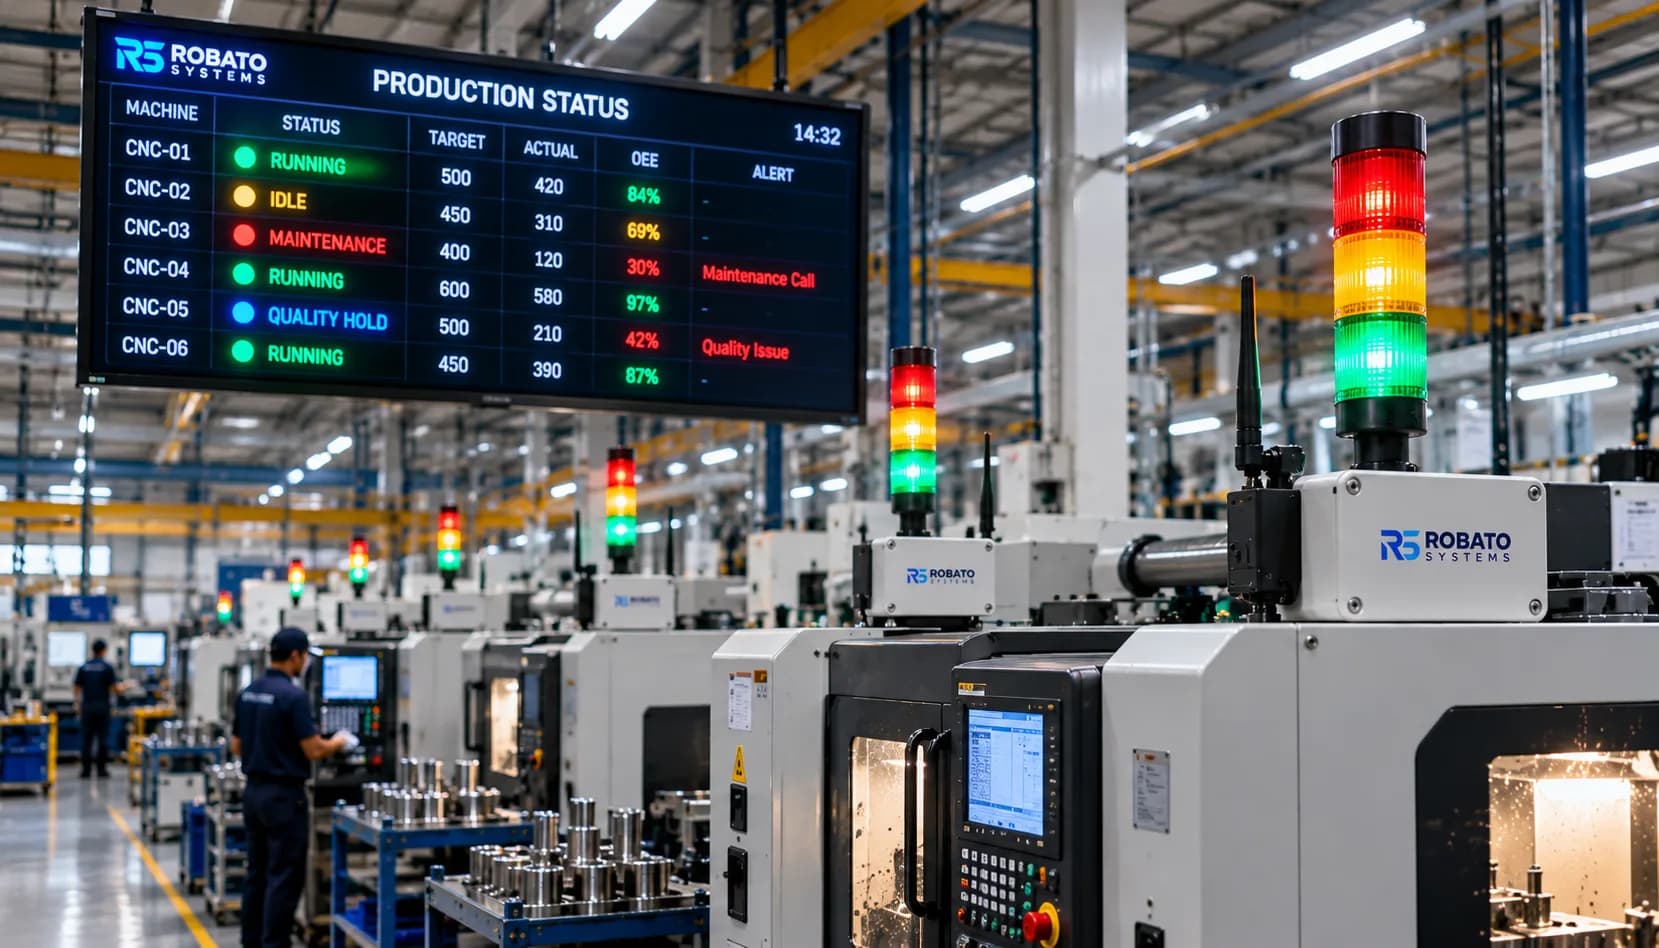
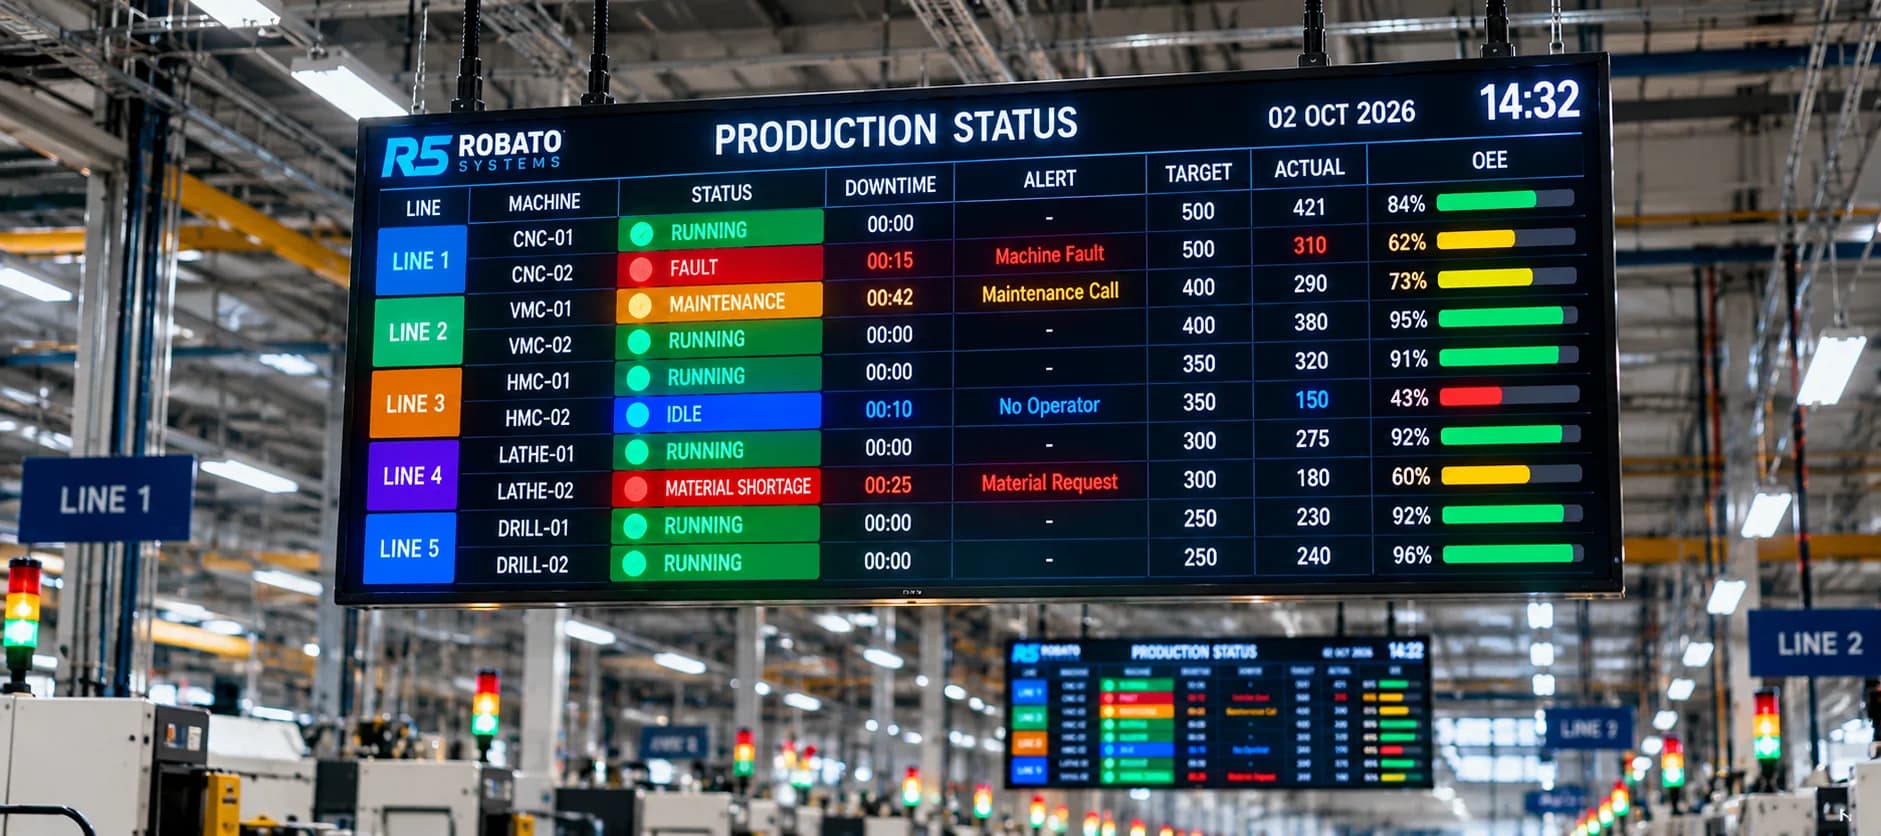
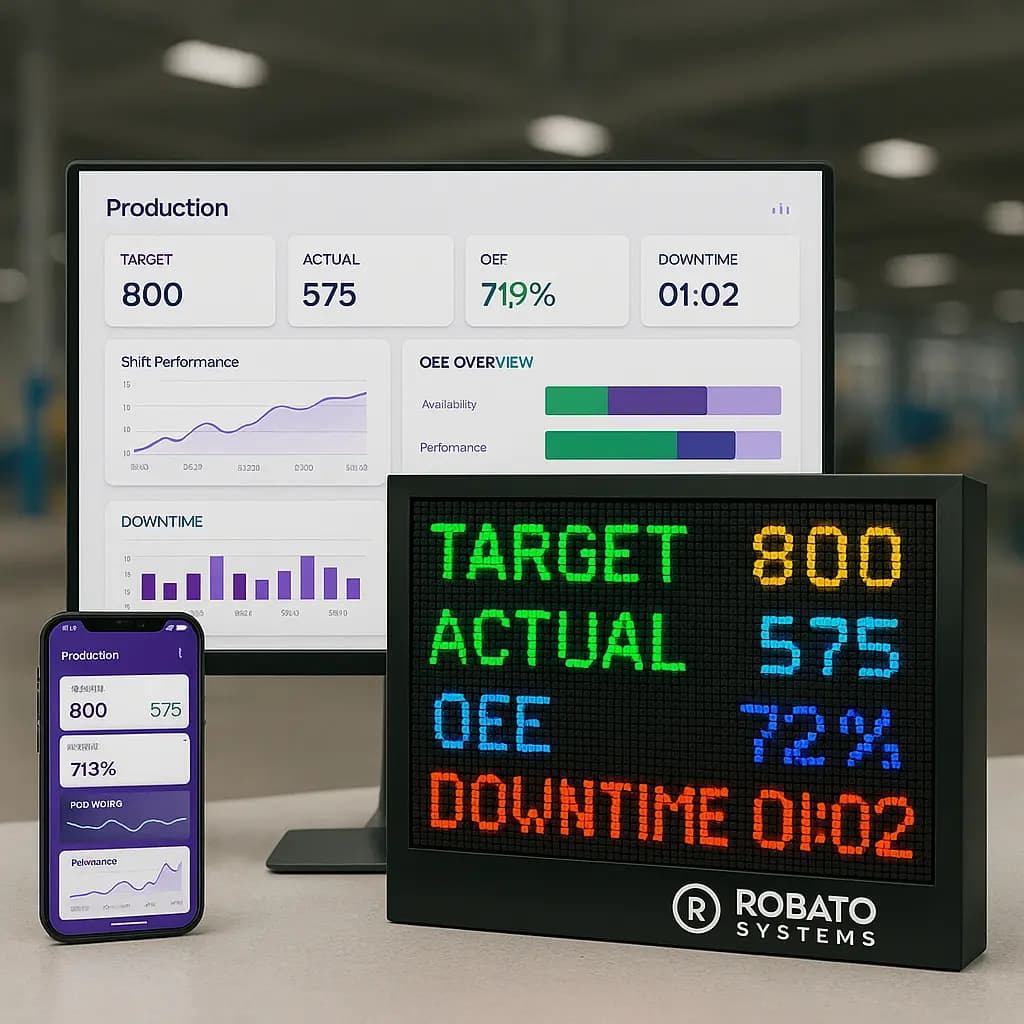
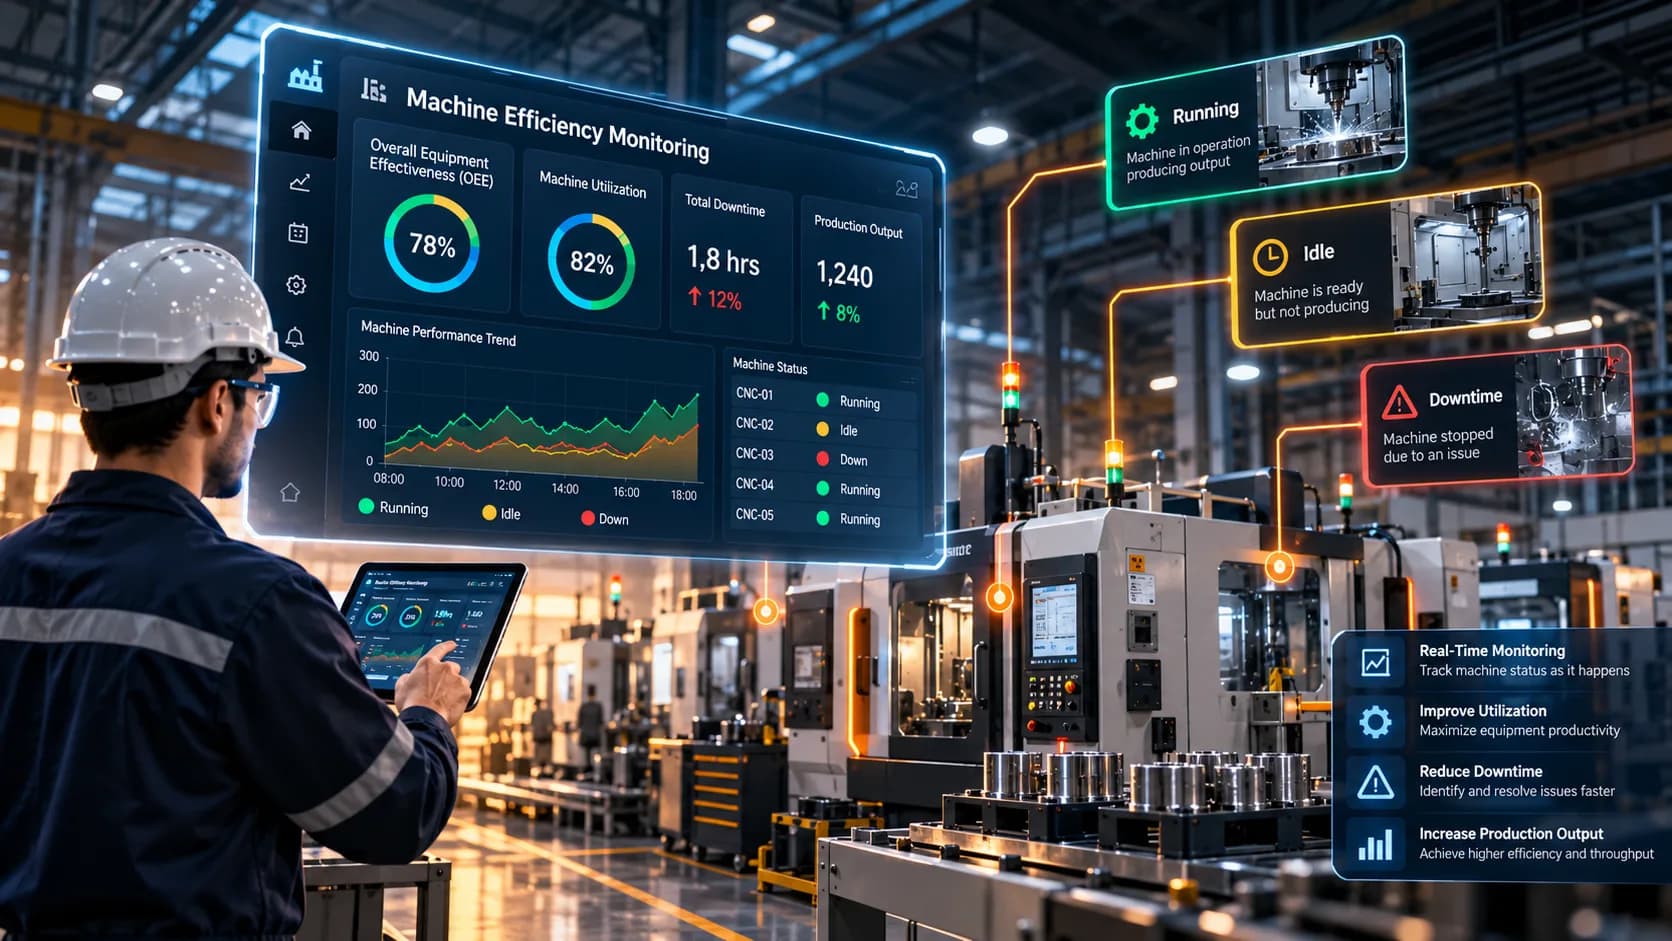
Machine Efficiency Monitoring Dashboards
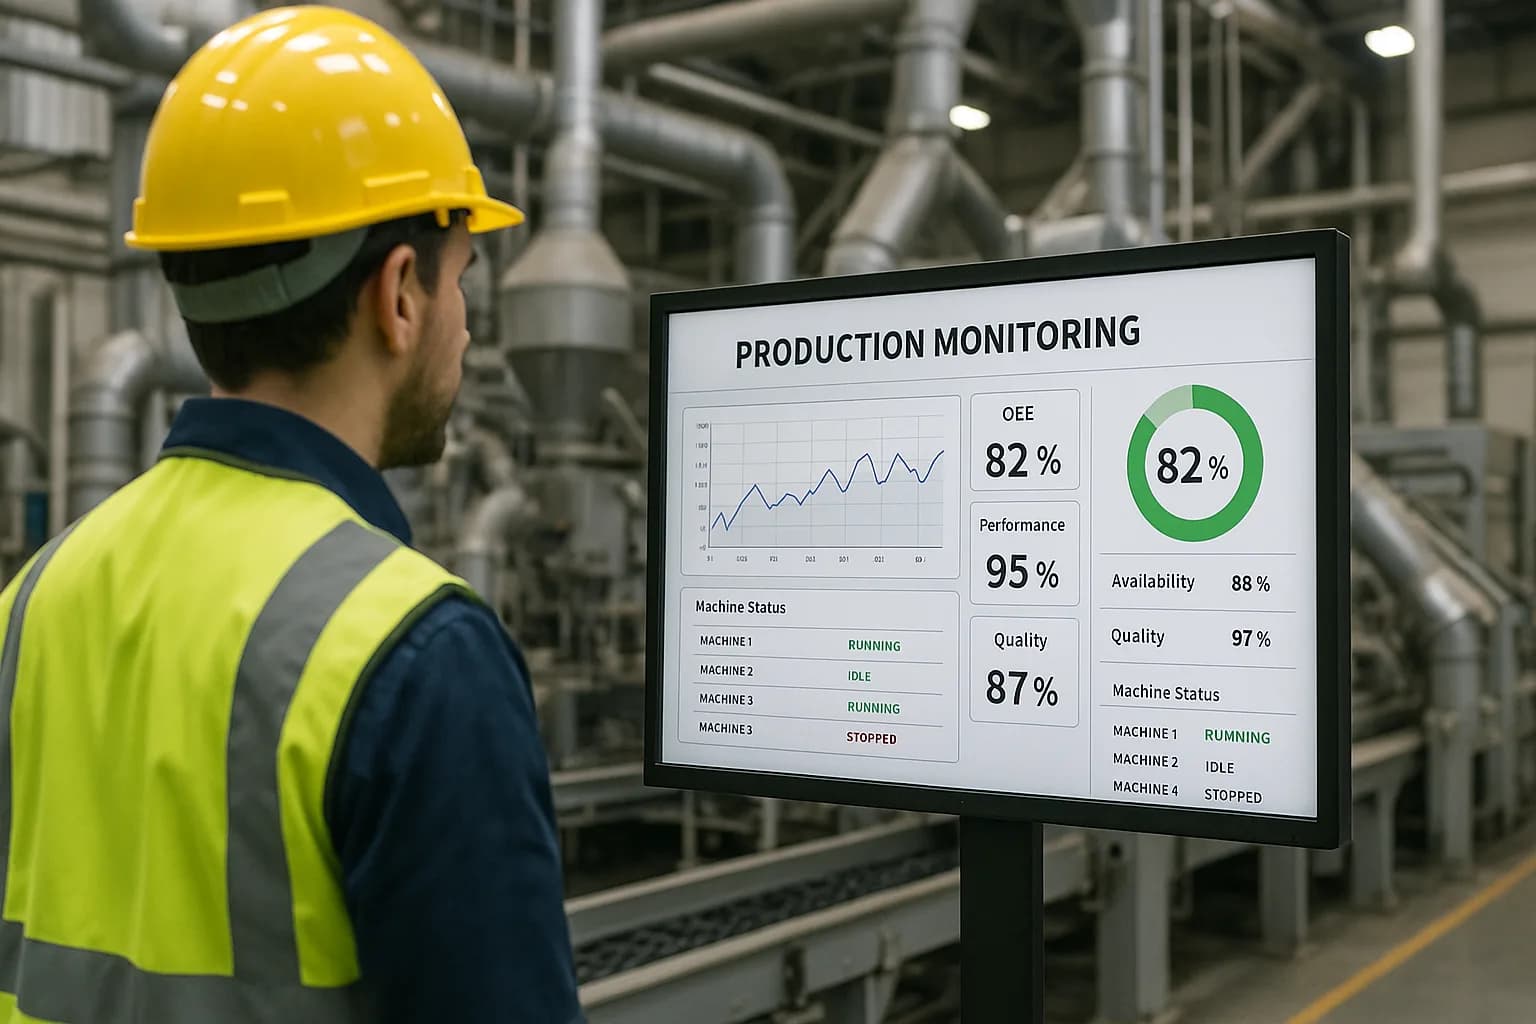
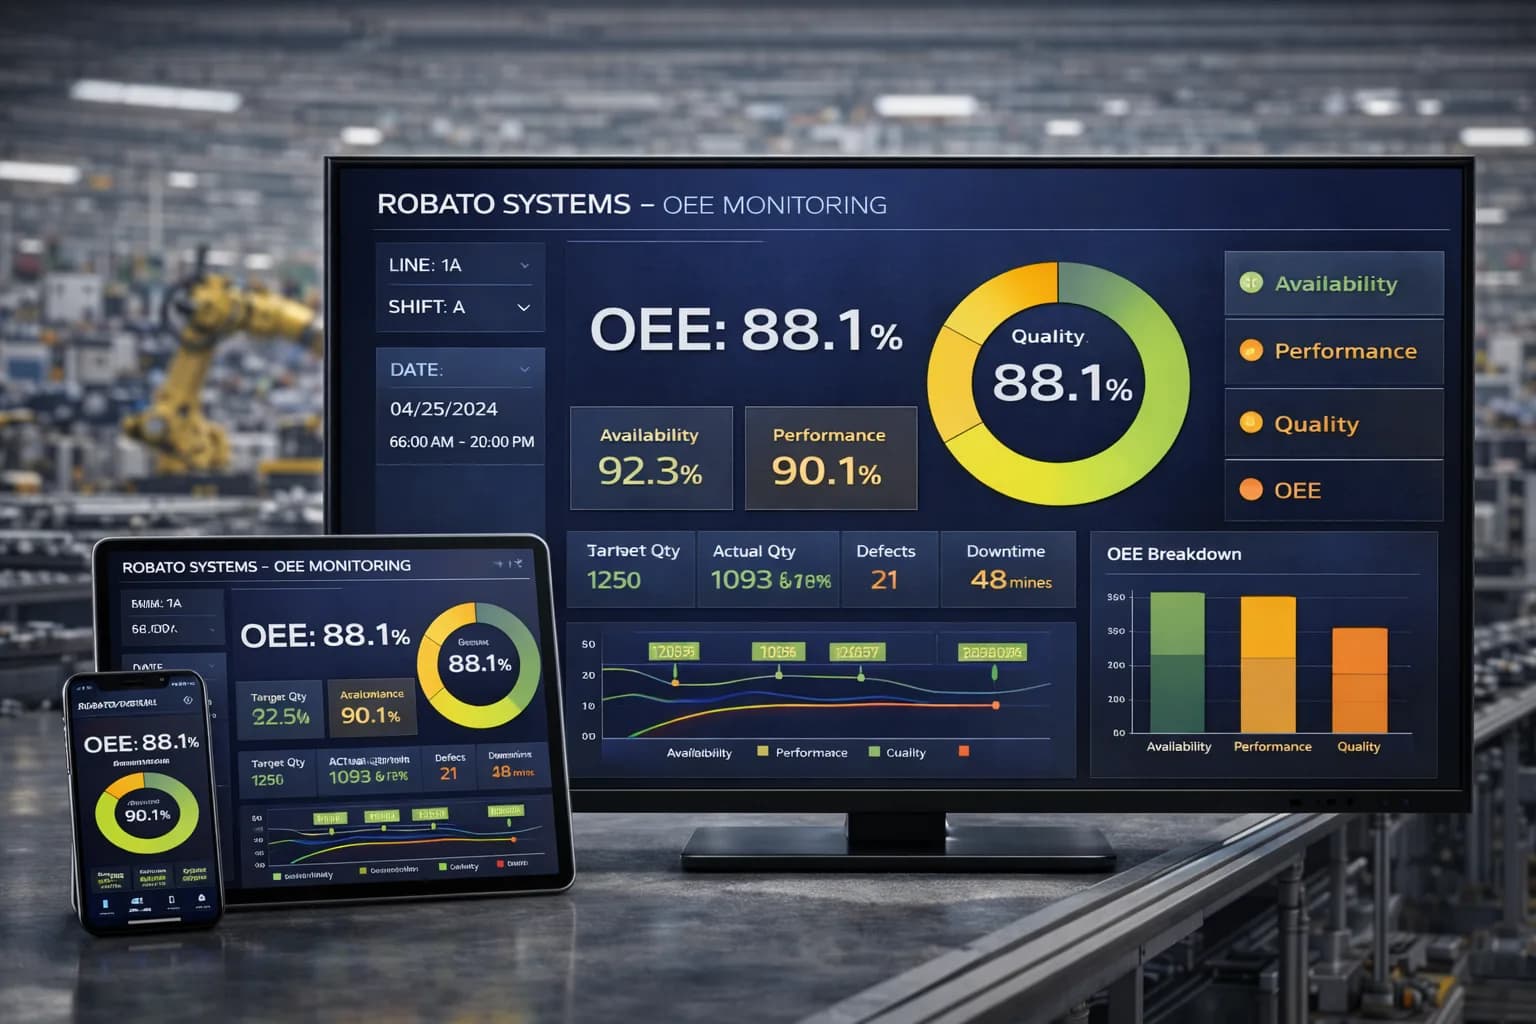
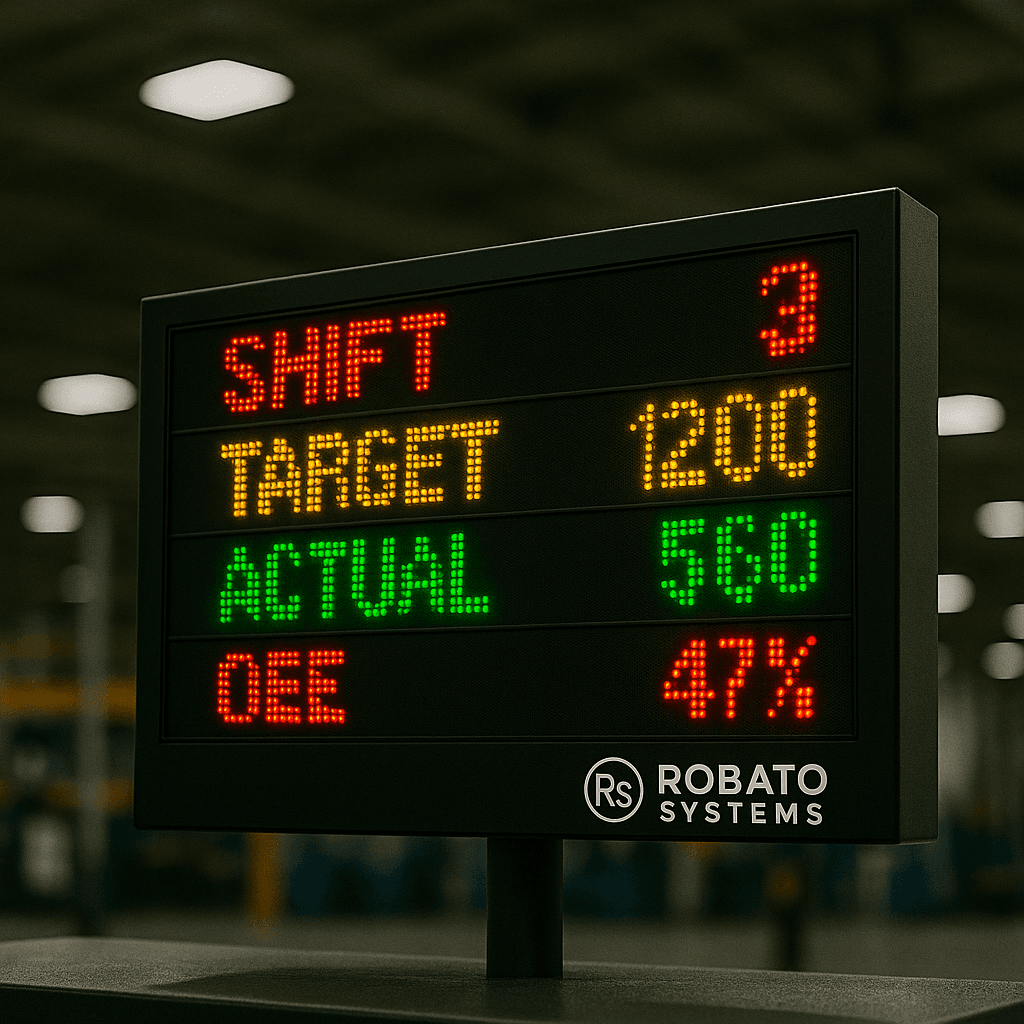
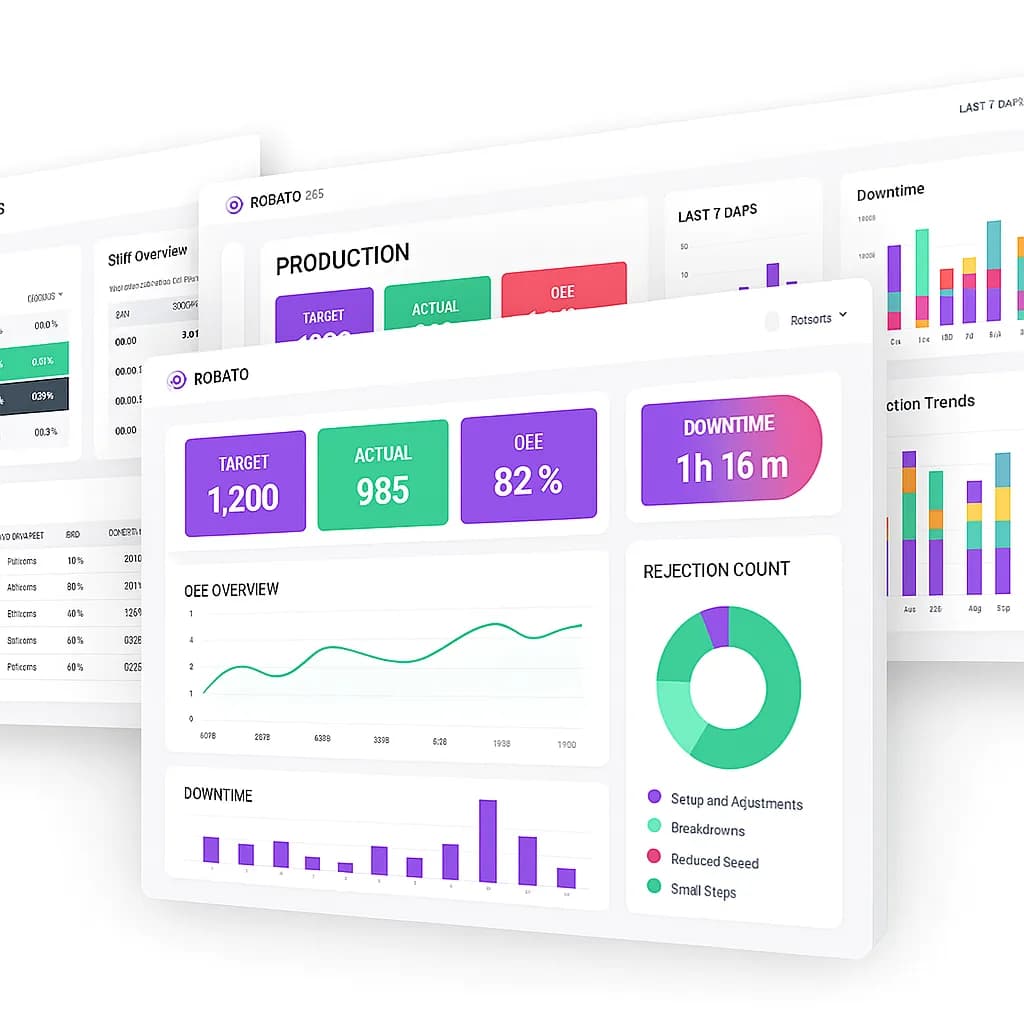
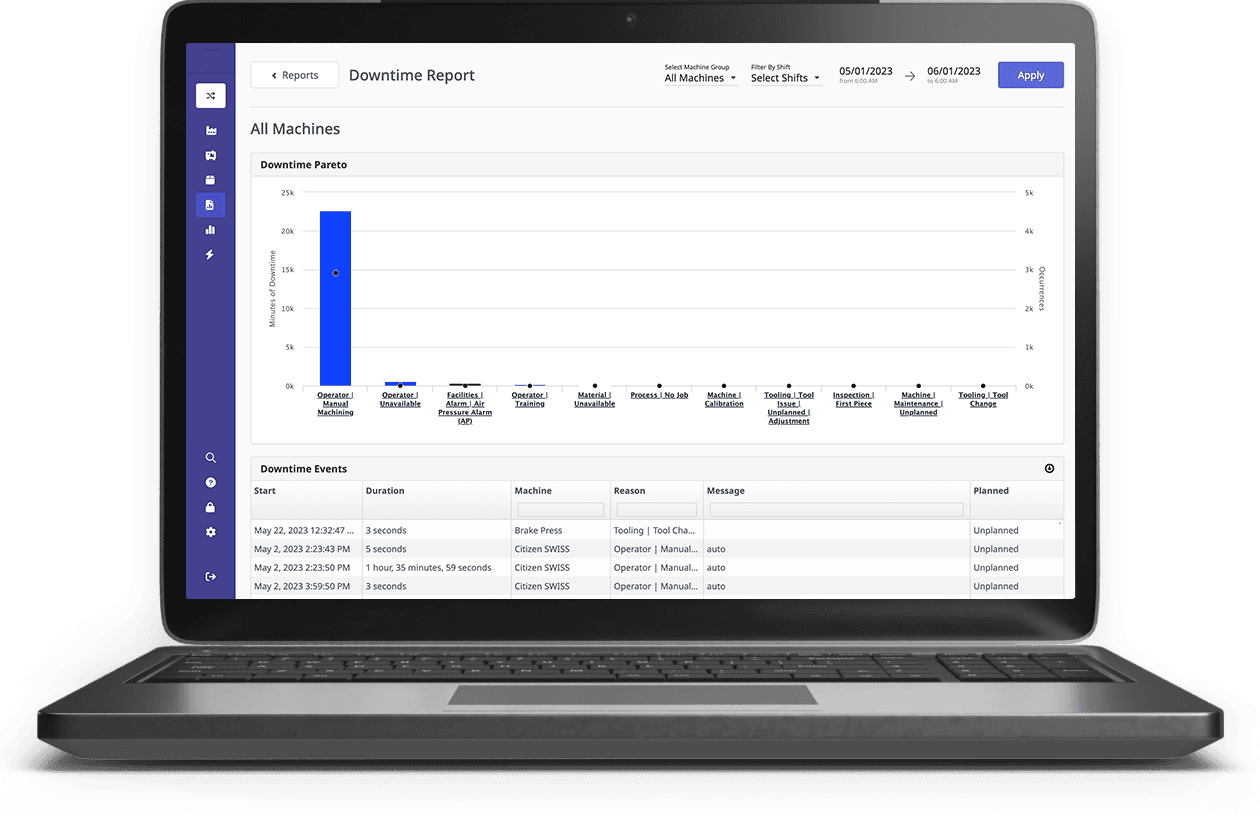
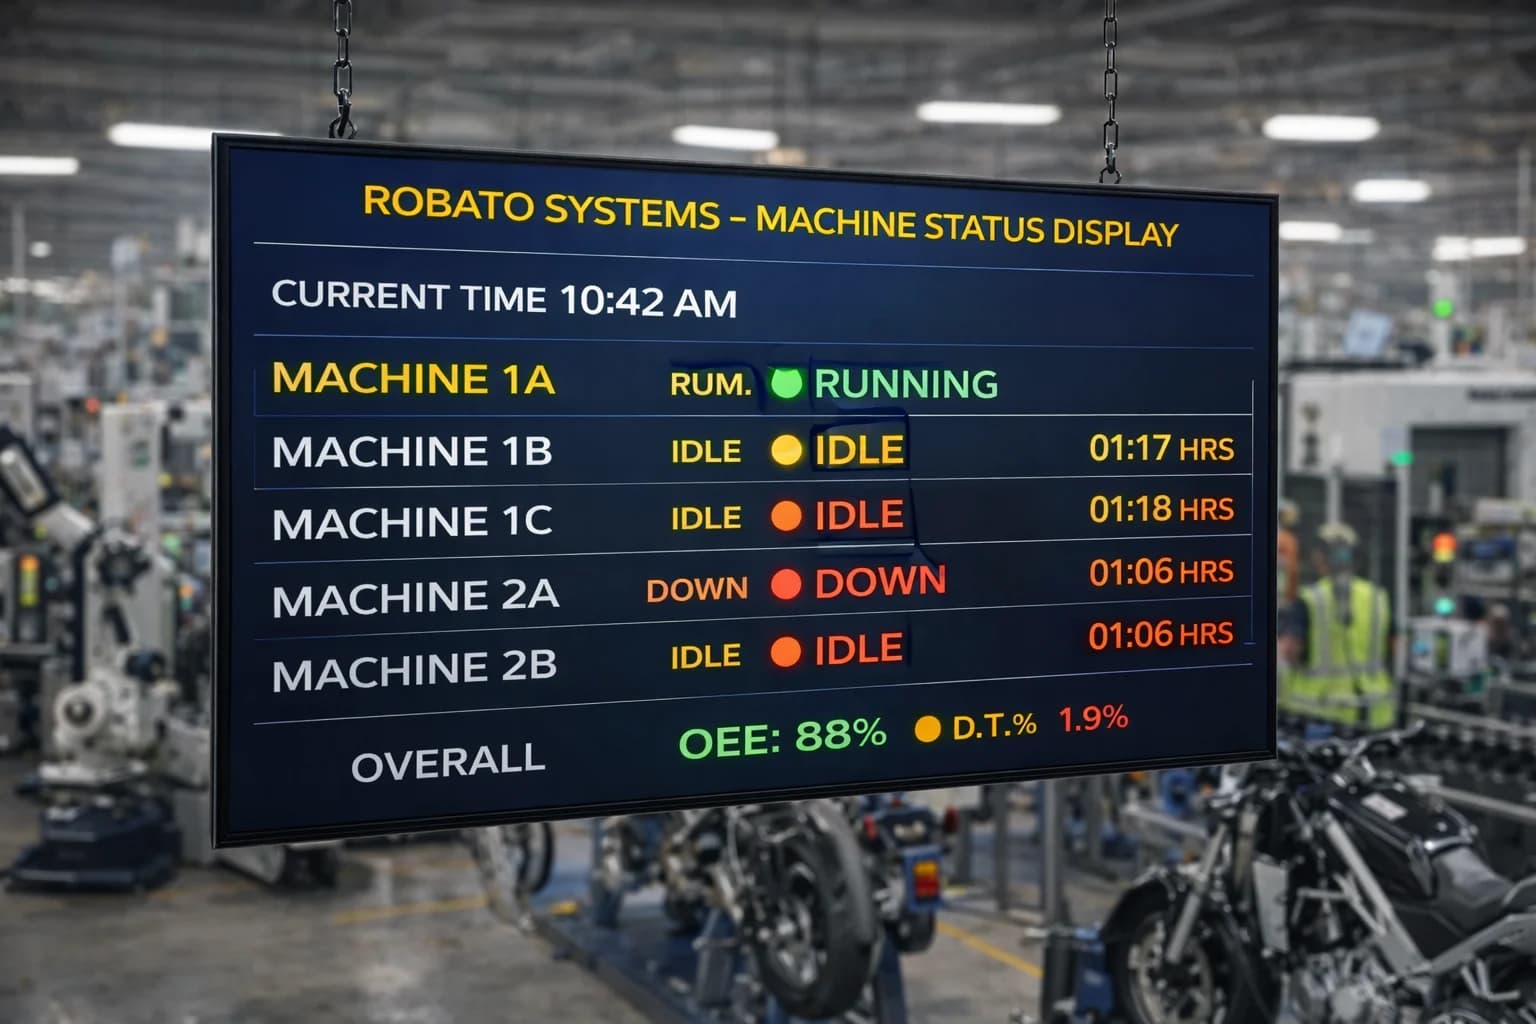
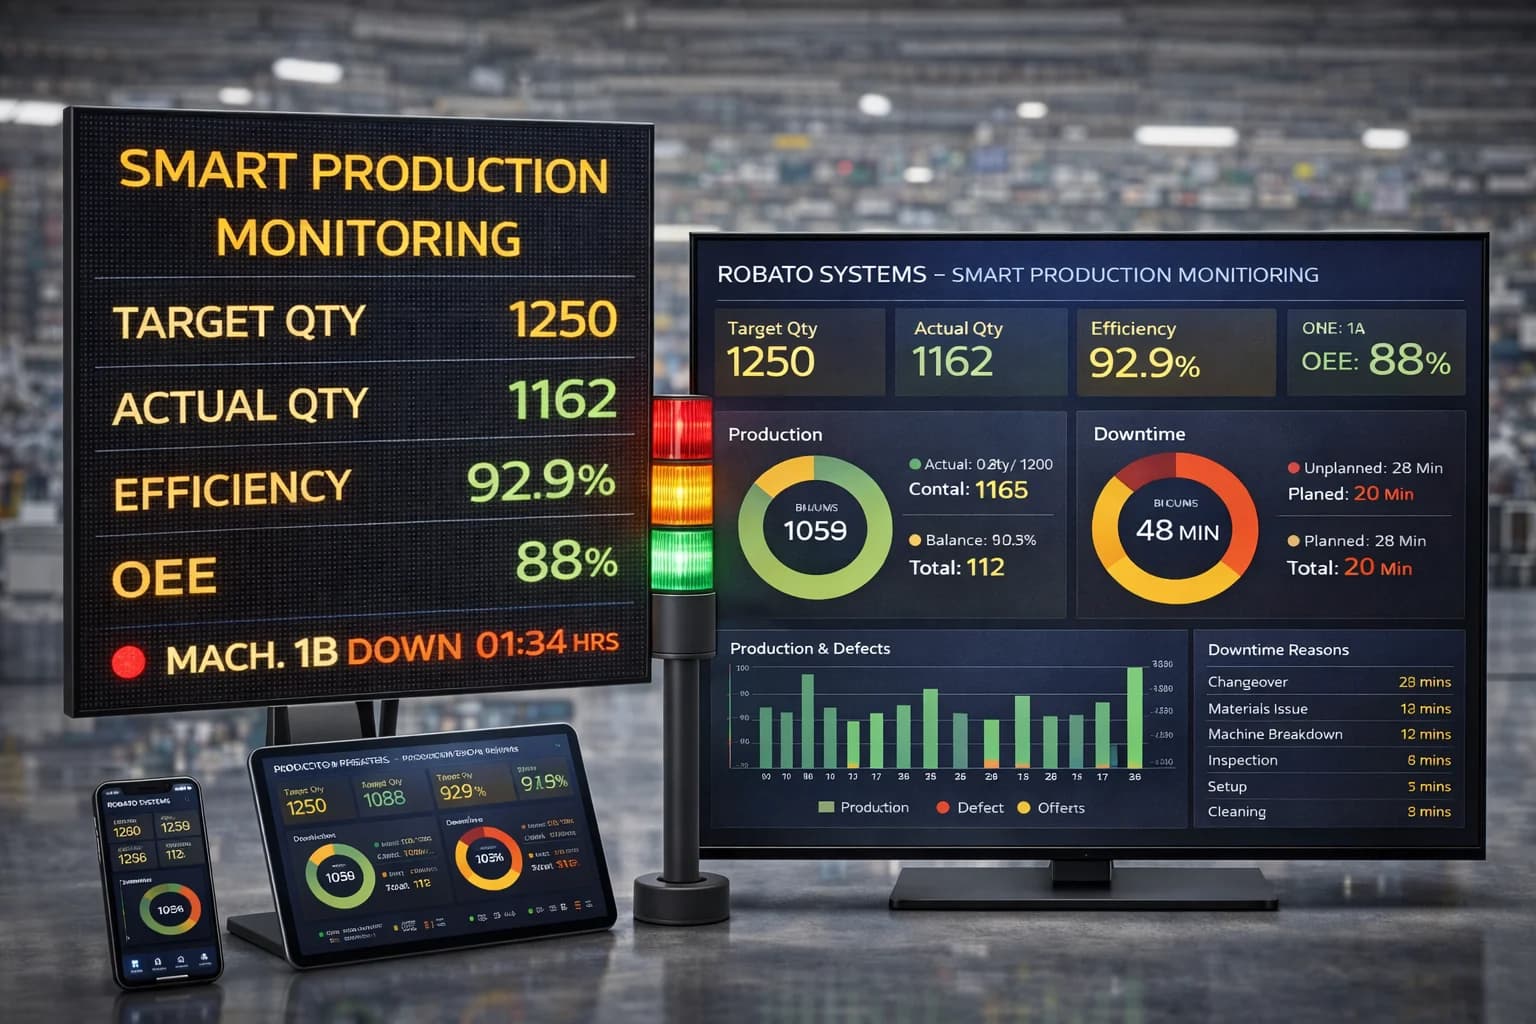
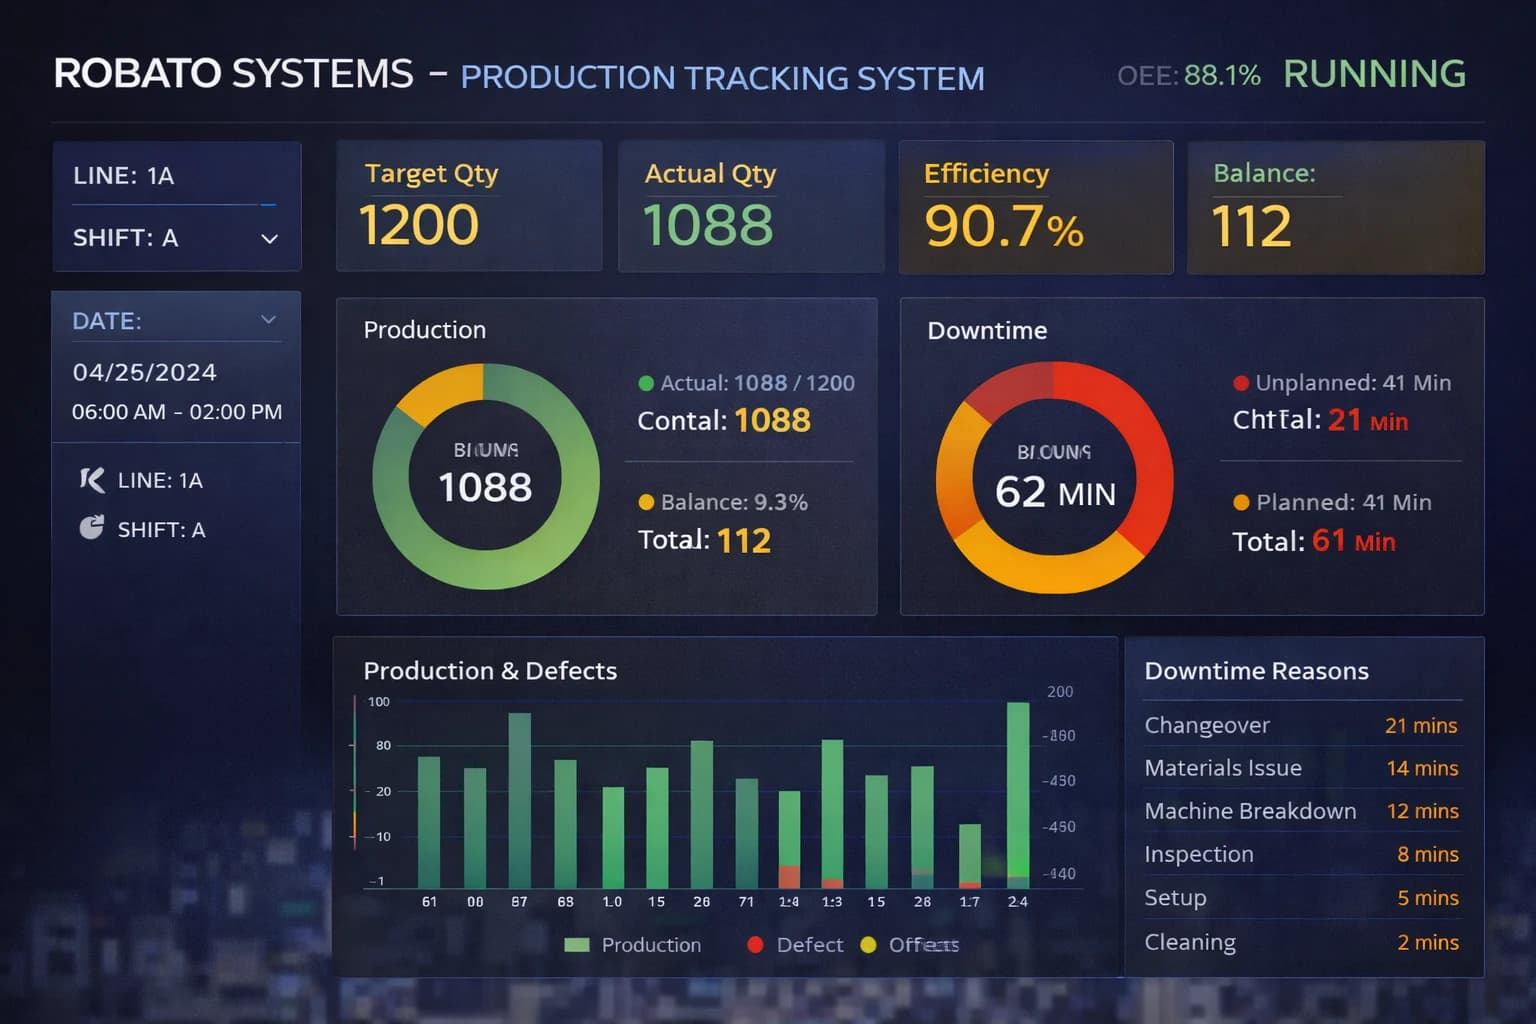
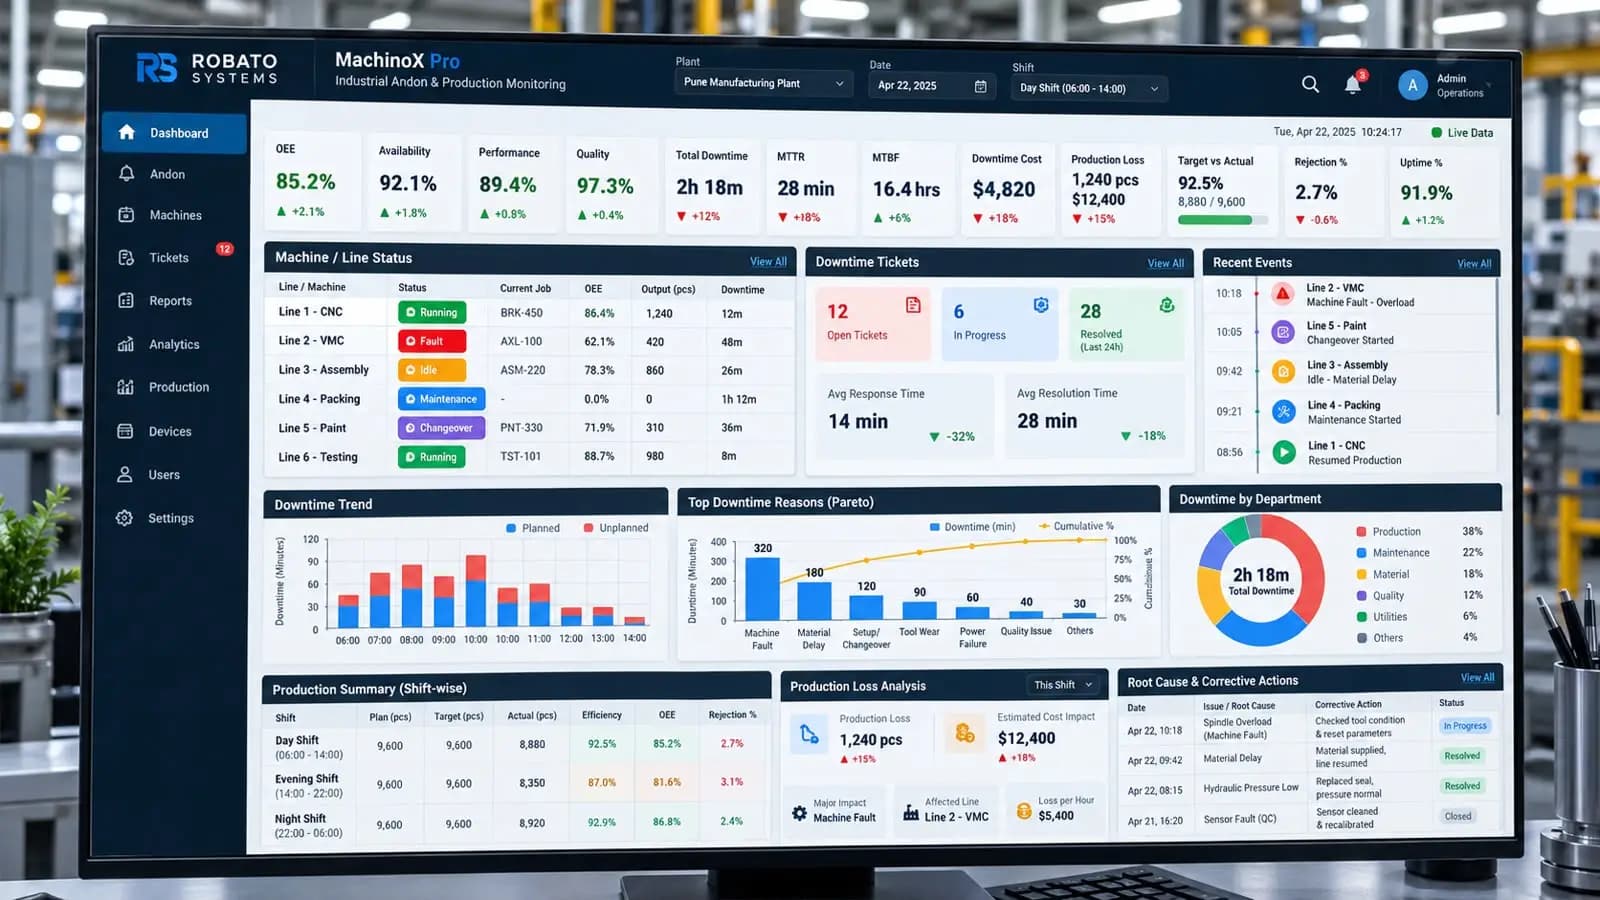
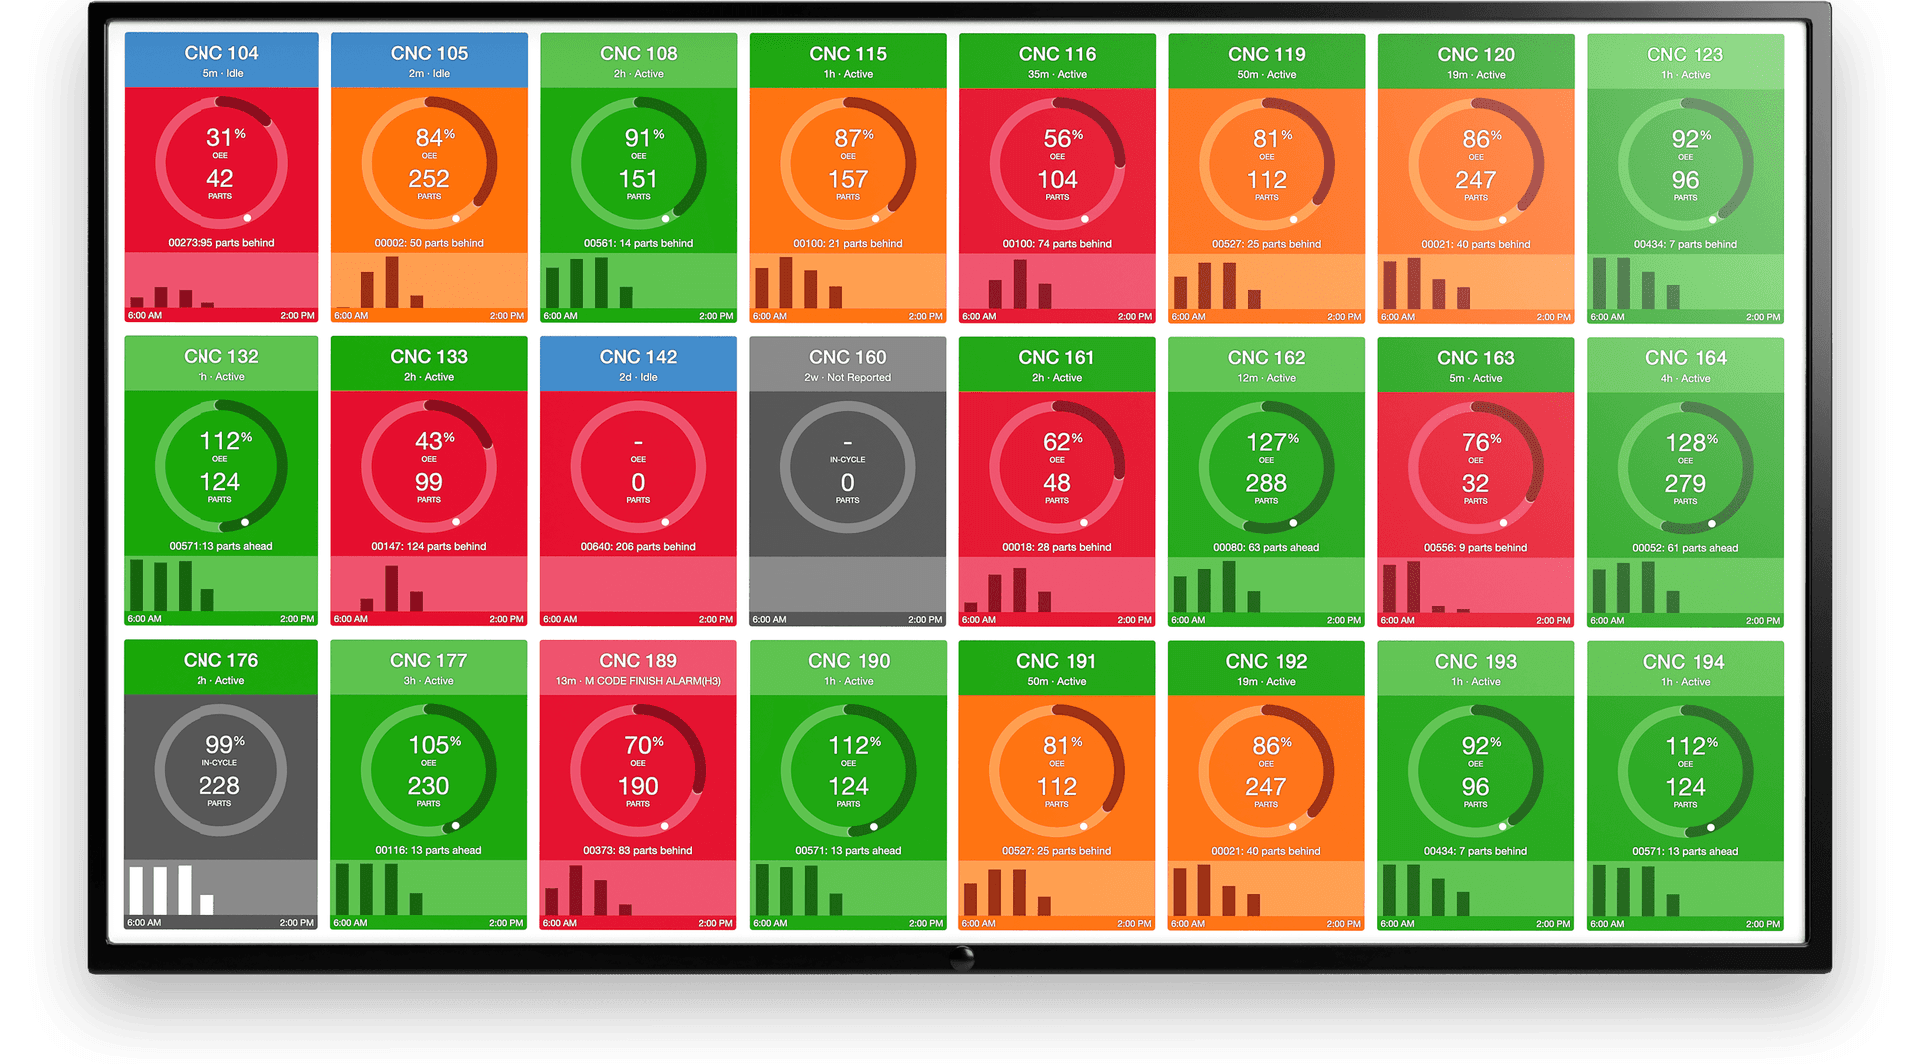
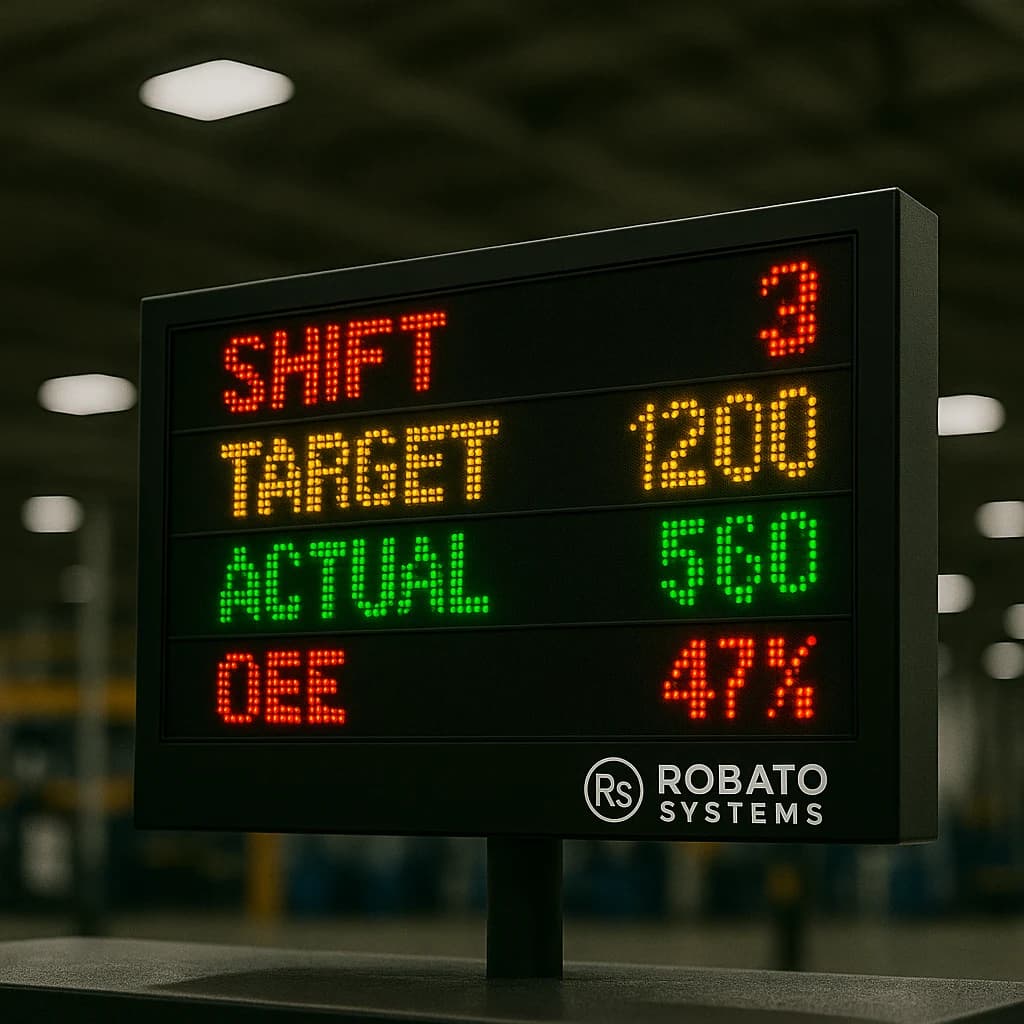
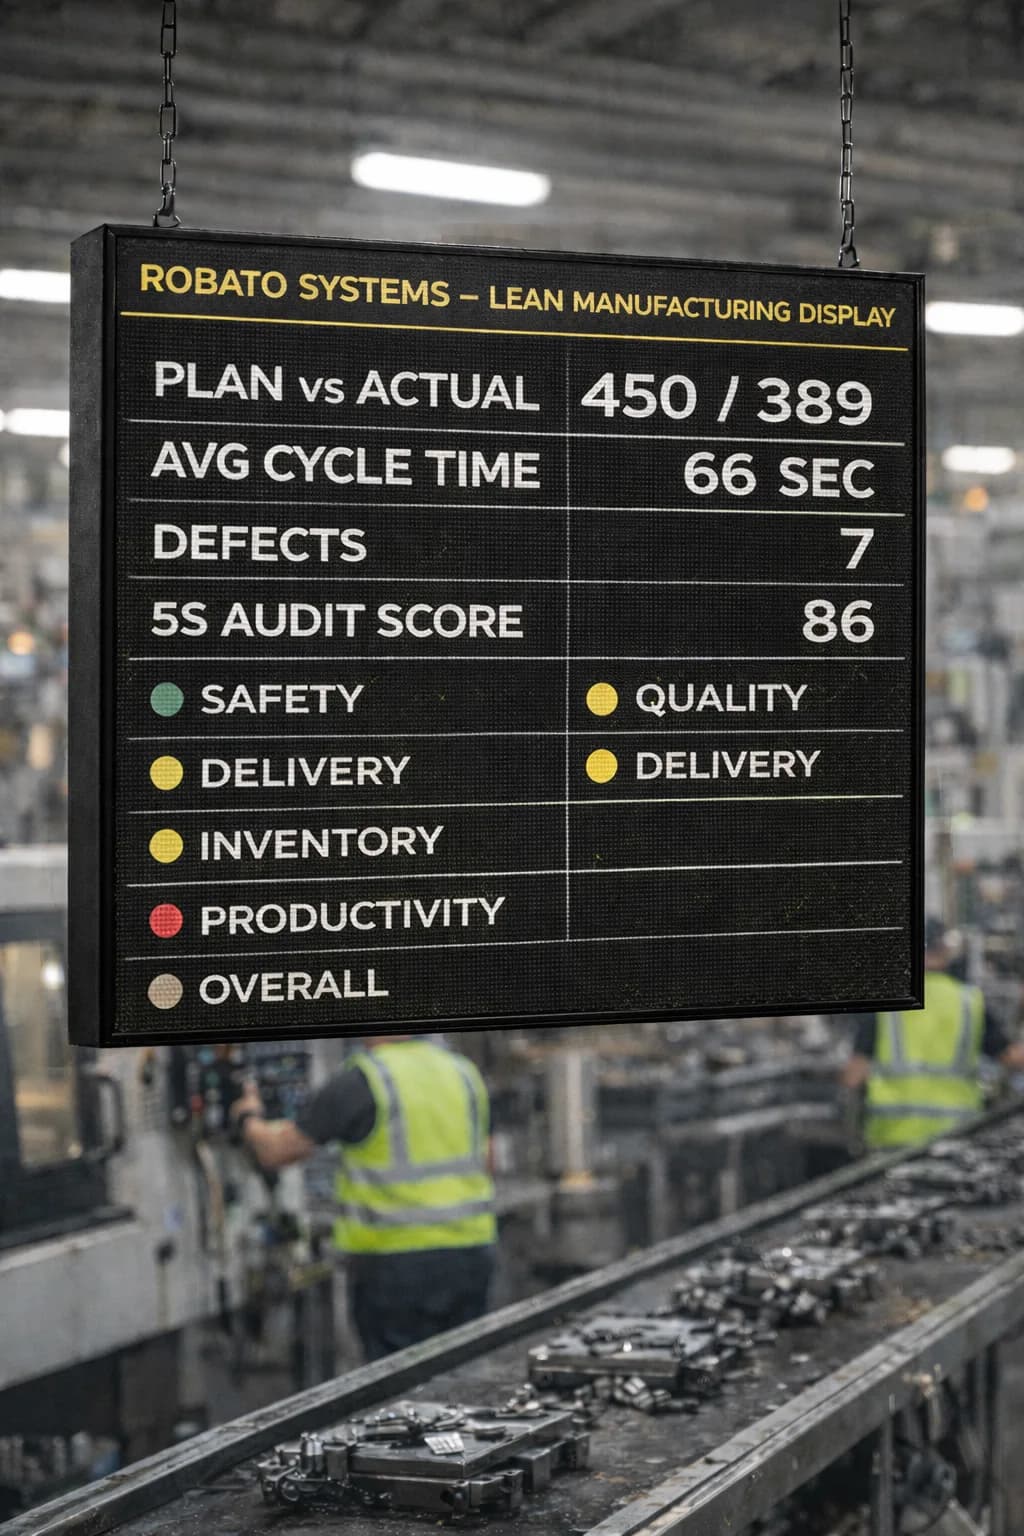
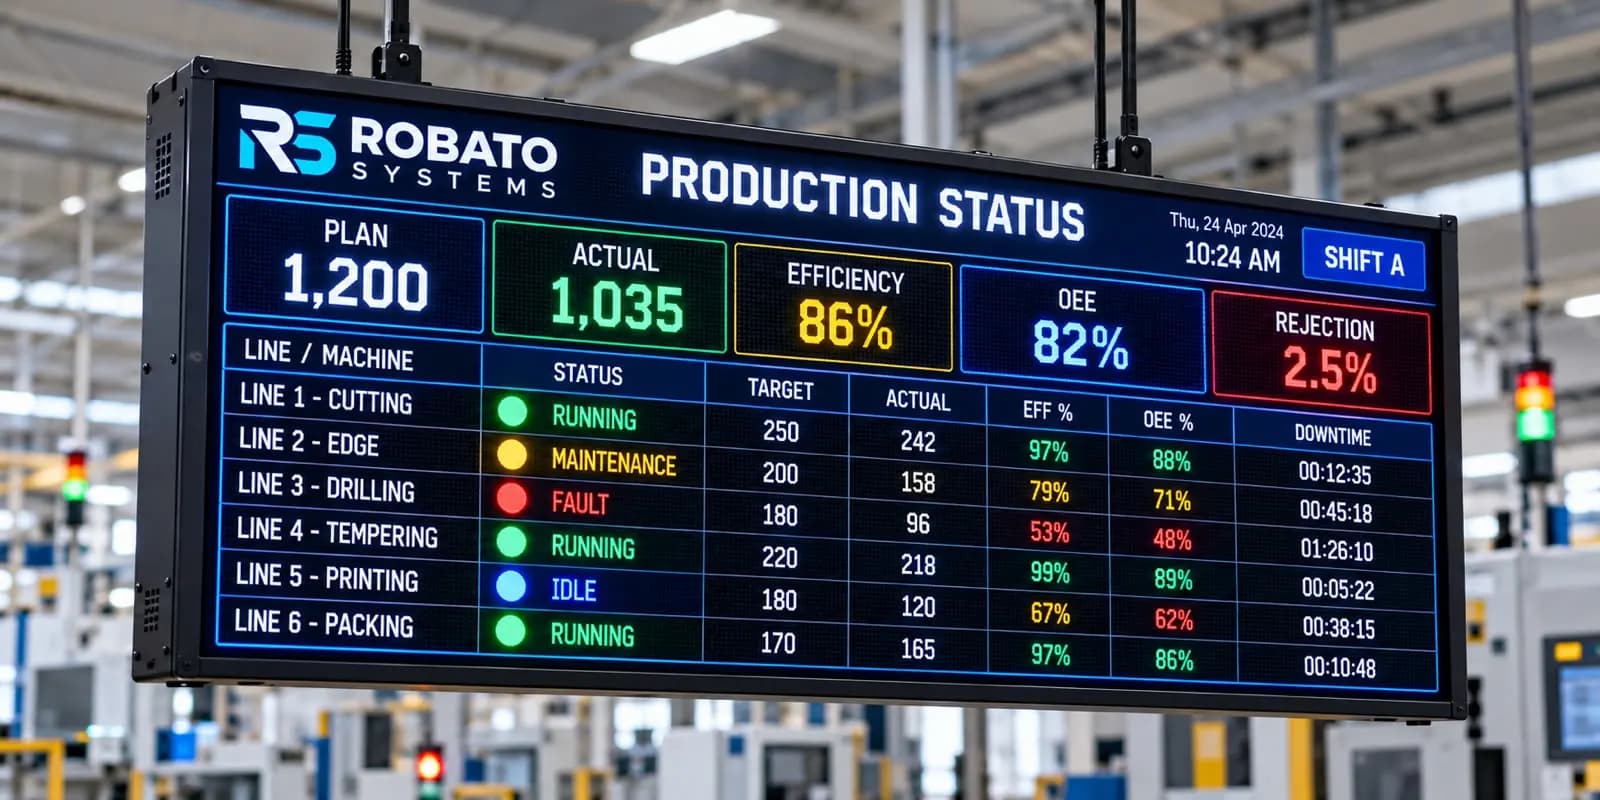
Dashboards are one of the most practical ways to present machine monitoring information.
A production dashboard may display:
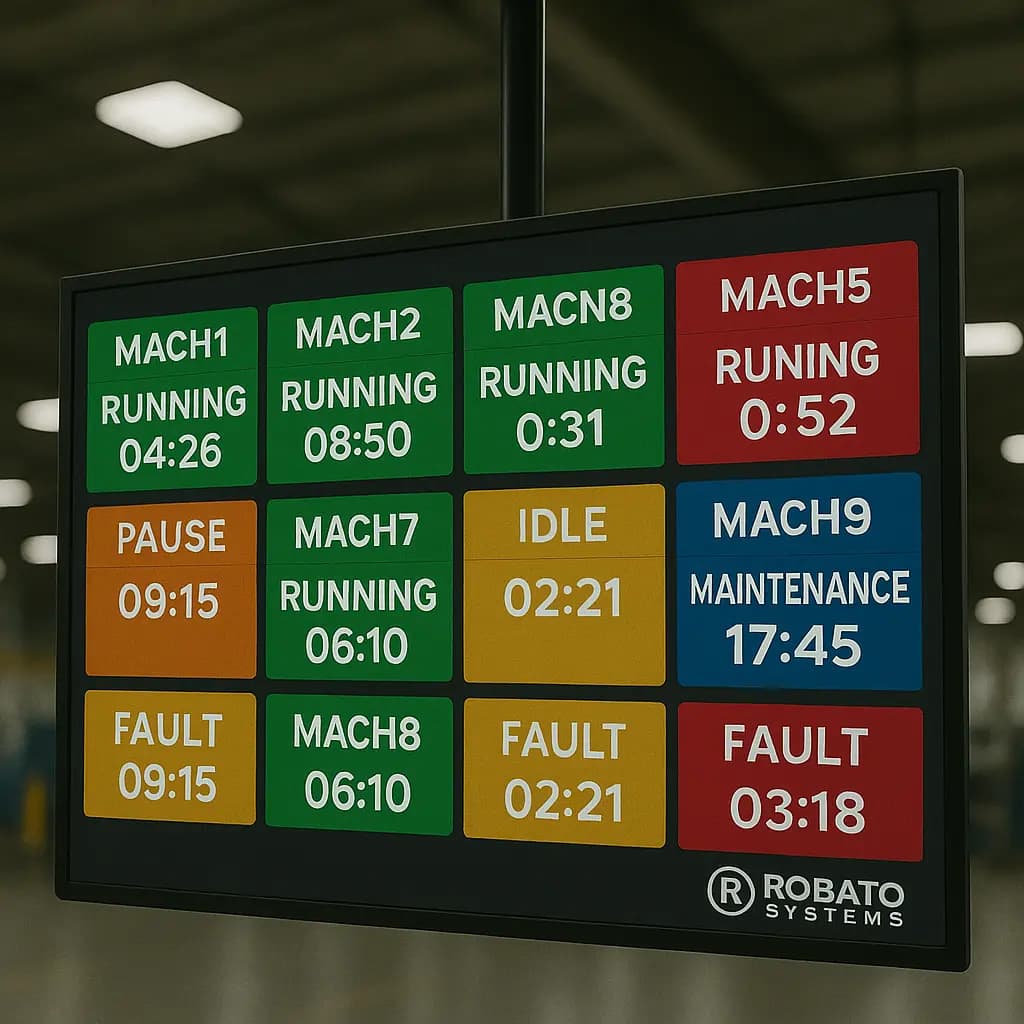
Current Machine Status
A visual overview of which machines are running, idle, stopped, or under maintenance.
Runtime Summary
The amount of operating time recorded for each machine.
Downtime Summary
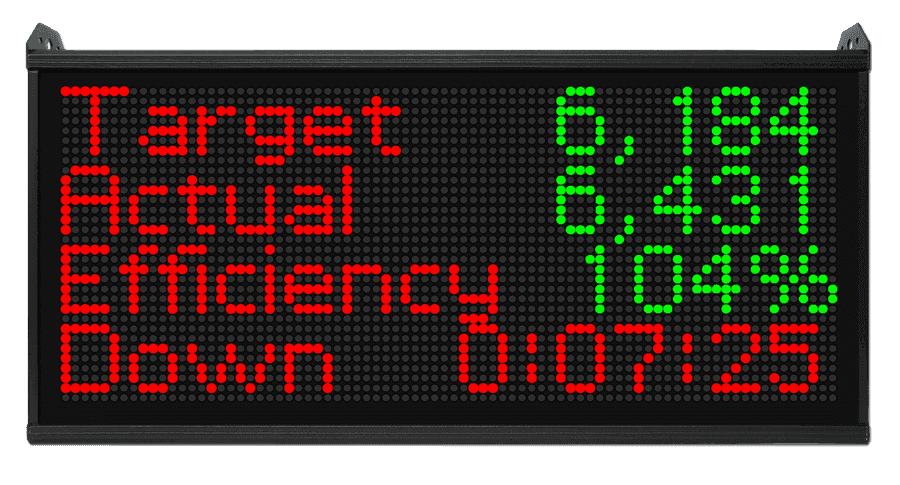
Total downtime and historical downtime trends.
Utilization
Equipment utilization for individual machines or production lines.
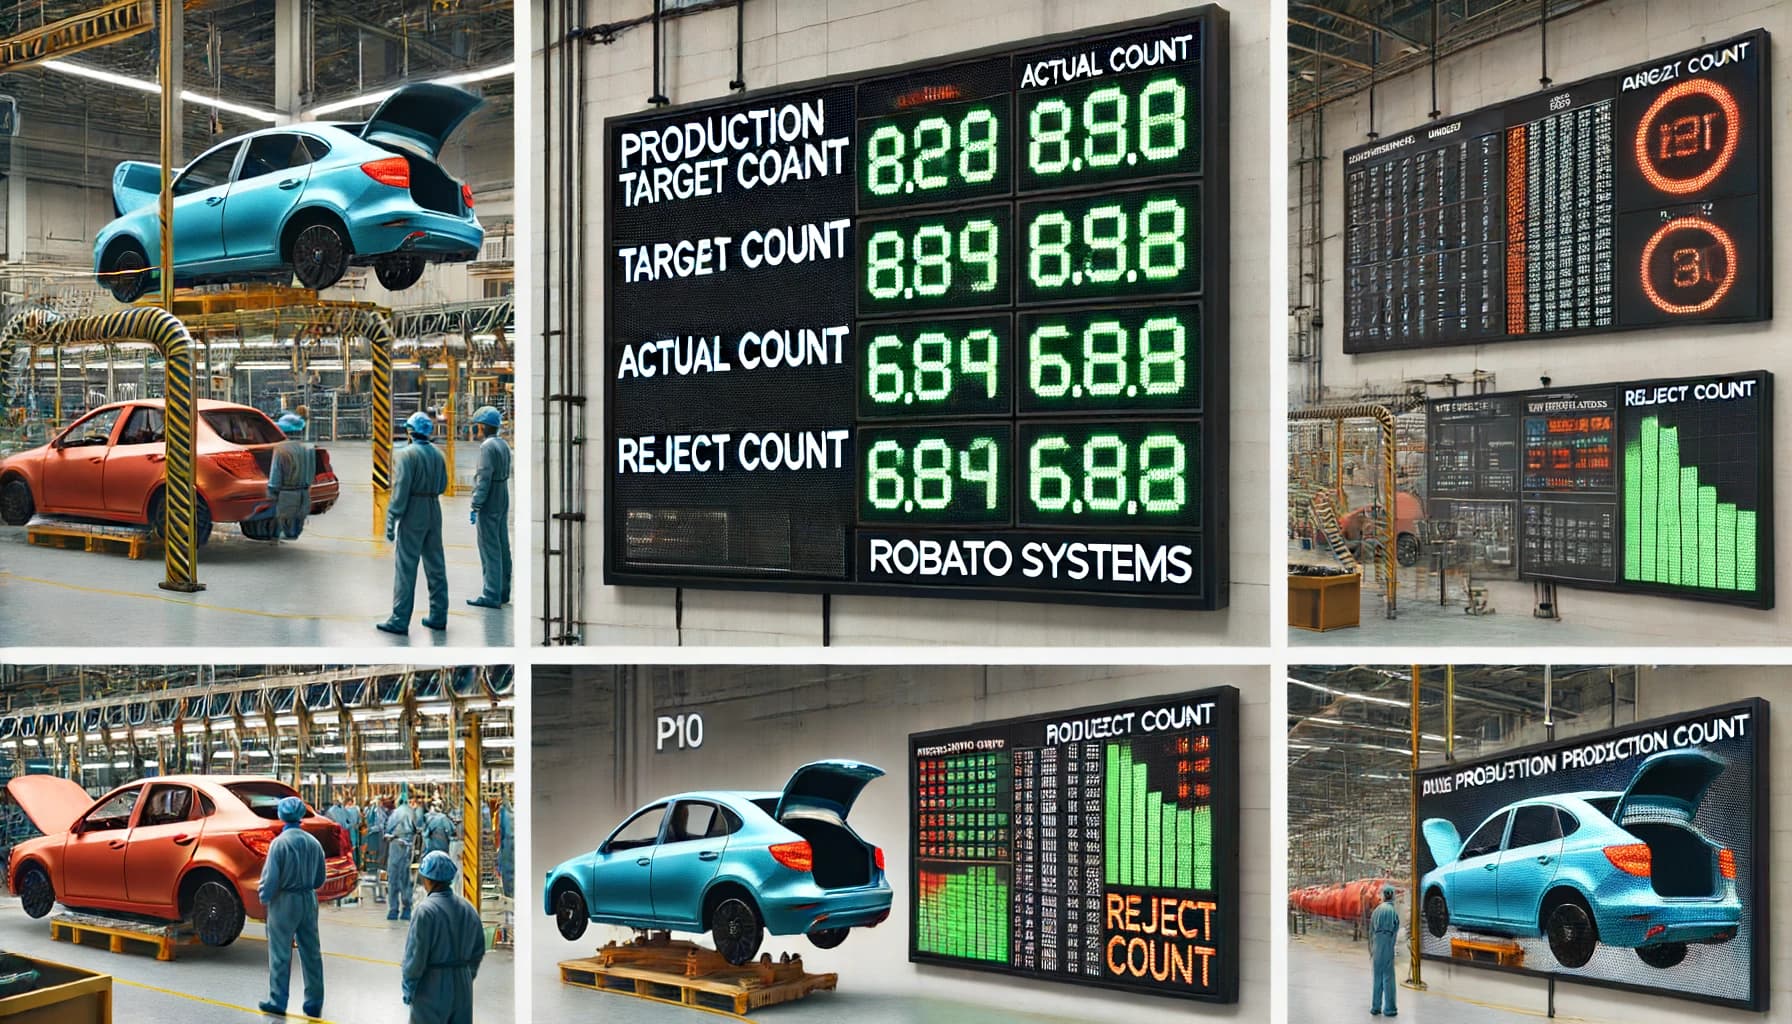
Production Output
Production counts or completed cycles.
Shift Performance
Comparison of machine activity across production shifts.
Alerts
Notifications for selected conditions such as extended machine inactivity or unexpected stoppages.
The dashboard should focus on information that helps users make decisions rather than simply displaying every available data point.
Implementing Machine Efficiency Monitoring in a Factory
Step 1: Identify the Monitoring Objective
Begin by defining what the organization wants to improve.
For example:
Reduce downtime
Improve machine utilization
Monitor production output
Understand idle time
Automate shift reports
Step 2: Audit Existing Equipment
Document the machines and determine what data is available from each one.
Older equipment may require additional sensors or connectivity hardware.
Step 3: Define Machine States
Establish consistent definitions for running, idle, stopped, maintenance, and other relevant states.
This is important because inconsistent state definitions can make reports difficult to compare.
Step 4: Establish Data Collection
Connect machines to the monitoring platform using suitable industrial interfaces, sensors, gateways, or APIs.
Step 5: Create Relevant Dashboards
Develop dashboards for operators, supervisors, production managers, and plant management based on their different information requirements.
Step 6: Establish Baseline Performance
Collect enough data to understand normal operating patterns.
A baseline provides a reference point for measuring improvements.
Step 7: Analyze Recurring Losses
Look for repeated downtime, idle periods, abnormal cycle times, or utilization differences.
Step 8: Implement Improvement Actions
Use the findings to make operational changes.
Possible actions may include:
Adjusting production schedules
Improving material availability
Optimizing changeover procedures
Revising maintenance practices
Addressing recurring equipment problems
Step 9: Measure the Results
Continue monitoring after improvements are implemented.
The objective is to determine whether the changes produced measurable results.
Challenges in Machine Efficiency Monitoring
Legacy Machinery
Older machines may not have built-in digital connectivity.
Additional hardware may be necessary to capture machine signals.
Data Accuracy
Incorrect sensor readings or poorly configured machine-state logic can produce unreliable results.
Multiple Machine Vendors
Factories often contain equipment from different manufacturers, which can create integration challenges.
Network Reliability
Industrial monitoring depends on reliable communication between machines, gateways, and software systems.
Data Overload
Collecting too much information can make dashboards complicated and difficult to use.
The focus should remain on actionable metrics.
Employee Adoption
Production teams need to understand how monitoring data will be used and how it can support operational improvement.
Best Practices for Machine Efficiency Monitoring
Define Clear Machine States
Use standardized definitions for machine operating conditions across the factory.
Focus on Actionable Metrics
Monitor metrics that directly support production decisions.
Combine Real-Time and Historical Data
Real-time information helps with immediate response, while historical data supports long-term improvement.
Track Reasons for Downtime
Where possible, classify downtime according to meaningful causes instead of treating every stop identically.
Create Role-Based Dashboards
Operators, supervisors, and management should not necessarily see the same information.
Validate Data Regularly
Check machine signals, sensor readings, and calculated metrics periodically.
Review Trends Consistently
Machine monitoring becomes more valuable when teams regularly review trends and convert findings into improvement actions.
Machine Efficiency Monitoring and Industry 4.0
Machine efficiency monitoring is an important part of connected manufacturing.
Industry 4.0 environments increasingly use industrial IoT, connected equipment, analytics, automation, and centralized data platforms to improve operational visibility.
Machine monitoring can provide the operational data layer required for these initiatives.
When machine data is integrated with systems such as MES, ERP, maintenance platforms, quality systems, or analytics tools, manufacturers can build a more connected view of production.
Frequently Asked Questions
What is machine efficiency monitoring?
Machine efficiency monitoring is the process of collecting and analyzing machine operational data to understand runtime, downtime, idle time, utilization, production output, and other efficiency-related metrics.
Why is machine efficiency monitoring important?
It helps manufacturers identify how machine time and capacity are being used and provides data that can support production and operational improvement.
What machines can be monitored?
Depending on the connectivity method, both modern and legacy manufacturing equipment can be monitored. Older machines may require sensors, gateways, or additional integration hardware.
What is the difference between machine monitoring and machine efficiency monitoring?
Machine monitoring generally focuses on observing machine status and activity. Machine efficiency monitoring goes further by analyzing that activity to understand utilization, downtime, runtime, and production efficiency.
Can machine efficiency monitoring work in real time?
Yes. When the required machine connectivity and infrastructure are available, monitoring platforms can provide near-real-time information about machine status and production activity.
Does machine monitoring reduce downtime automatically?
No. Monitoring provides visibility into downtime and its patterns. Production and maintenance teams still need to investigate causes and implement corrective actions.
Can machine efficiency monitoring support multiple production lines?
Yes. A centralized monitoring platform can be designed to collect and display information from multiple machines and production lines.
Is machine efficiency monitoring useful for small factories?
Yes. Smaller manufacturers can use monitoring to establish production baselines, identify recurring losses, and improve visibility as their operations grow.
Conclusion
Machine Efficiency Monitoring gives manufacturers a clearer understanding of how equipment is being used during production.
By collecting machine status, runtime, downtime, idle time, utilization, and production data, organizations can move beyond basic production reporting and begin identifying the operational patterns behind production losses.
The most effective monitoring approach is not about collecting the maximum amount of data. It is about collecting reliable information, presenting it clearly, and using it to support practical production decisions.
For manufacturers looking to improve equipment utilization and production visibility, machine efficiency monitoring can provide the data foundation needed for continuous operational improvement.