Introduction
A manufacturing machine can be running continuously and still fail to deliver its expected production performance.
A machine may operate below its designed speed, experience frequent short interruptions, take longer to complete production cycles, or produce less output than expected. These performance losses can be difficult to identify when production teams rely primarily on manual observations or end-of-shift reports.
Machine Performance Monitoring provides manufacturers with a systematic way to measure how machines are operating and how their actual production performance compares with expected standards.
By collecting machine and production data, manufacturers can monitor operating status, runtime, cycle time, production output, downtime, machine speed, utilization, and other relevant performance indicators.
This guide explains what machine performance monitoring is, how it works, which metrics matter, how dashboards can be used, and the best practices manufacturers should follow when implementing a machine performance monitoring system.
What Is Machine Performance Monitoring?
Machine performance monitoring is the process of continuously or periodically measuring and analyzing the operational and production performance of manufacturing equipment.
The monitoring process can include:
Machine operating status
Production output
Machine runtime
Downtime
Cycle time
Production rate
Operating speed
Performance against target
Production interruptions
The purpose is to determine whether equipment is performing as expected and to identify factors that may be reducing production performance.
For example, a machine may have a standard cycle time of 30 seconds but consistently operate at 38 seconds. The machine is technically running, but its performance is below the expected level.
Performance monitoring makes this type of loss measurable.
Why Machine Performance Monitoring Matters
Production teams need reliable information to understand whether machines are meeting operational expectations.
Without machine-level monitoring, managers may only see the final production number.
For example, if a machine produces 700 units instead of the expected 800 units, several questions need to be answered:
Was there unexpected downtime?
Was the machine running at a slower speed?
Were there frequent short stops?
Was the cycle time longer than expected?
Was production interrupted by material shortages?
Did changeovers take longer?
Were there quality-related issues?
Machine performance monitoring helps provide the data needed to investigate these questions.
It moves production analysis from simply measuring what was produced to understanding how the machine performed while producing it.
How Does Machine Performance Monitoring Work?
A machine performance monitoring system generally consists of several stages.
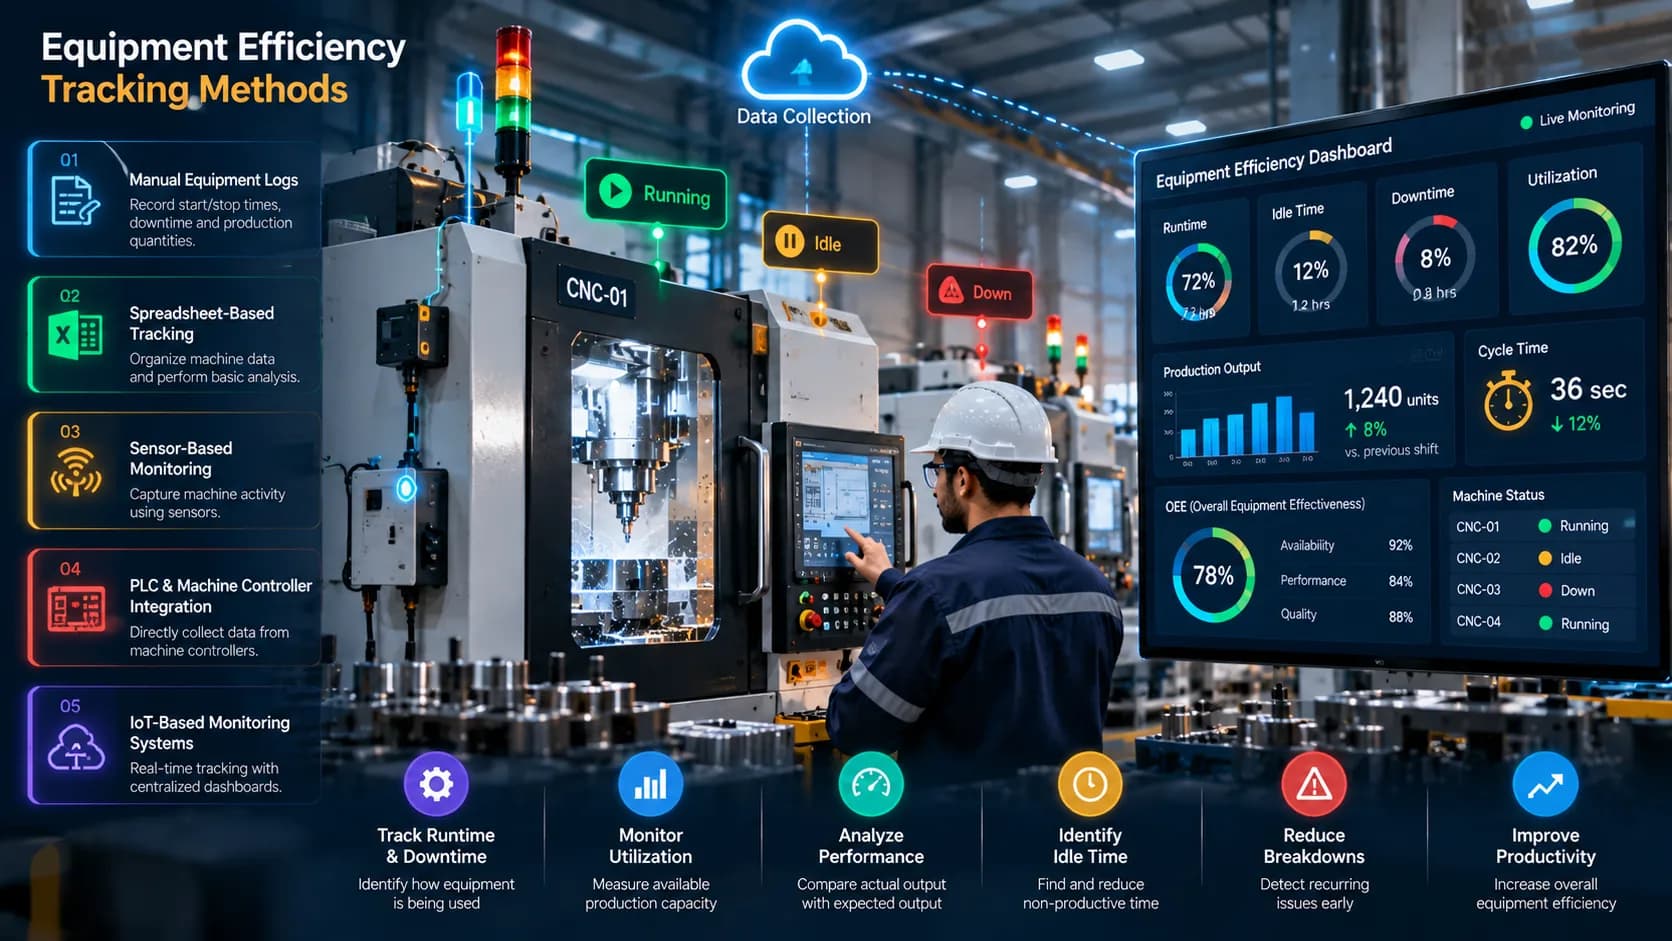
1. Machine Data Collection
Operational information is collected from machines using available industrial interfaces.
Depending on the equipment, data may come from:
PLCs
CNC controllers
Sensors
Machine counters
Industrial gateways
IoT devices
Existing production systems
2. Data Transmission
The collected information is transferred to the monitoring platform.
Industrial networks, gateways, APIs, or other communication methods may be used depending on the factory architecture.
3. Data Processing
Raw machine signals are converted into meaningful operational information.
For example, a signal may be interpreted as:
Machine running
Machine stopped
Production cycle completed
Fault condition
Idle condition
The system can then calculate performance-related metrics from these events.
4. Performance Analysis
The software analyzes machine activity against configured standards or historical baselines.
This can reveal:
Slow cycles
Low production rates
Excessive downtime
Underutilization
Performance variations
5. Dashboard Visualization
The resulting information is displayed through dashboards and reports.
Users can view current performance as well as historical trends.
Machine Performance Monitoring Metrics
The right metrics depend on the manufacturing process, but several measurements are commonly useful.
Machine Runtime
Machine runtime represents the amount of time equipment actively operates.
Runtime can be analyzed by:
Machine
Shift
Production line
Day
Week
Month
A high runtime does not necessarily mean high performance because the machine may operate below its expected production rate.
Production Output
Production output measures the quantity produced during a defined period.
Output can be tracked by:
Hour
Shift
Day
Production order
Product
Machine
Cycle Time
Cycle time represents the time required for a machine to complete one production cycle.
Comparing actual cycle time with standard cycle time can reveal performance losses.
For example:
Standard cycle time: 20 seconds
Actual cycle time: 25 seconds
The machine is operating, but its production speed is lower than expected.
Production Rate
Production rate indicates the quantity produced over a specific period.
A basic calculation is:
Production Rate = Production Output ÷ Productive Operating Time
This can be used to compare actual production rates with expected rates.
Downtime
Downtime measures periods when equipment is stopped or unavailable.
Downtime can be separated into:
Planned downtime
Unplanned downtime
This distinction helps production teams understand whether lost time was expected or unexpected.
Idle Time
Idle time refers to periods when equipment is available but not actively producing.
Common causes include:
Material waiting
Operator waiting
Production scheduling
Downstream bottlenecks
Upstream process delays
Machine Utilization
Utilization provides an indication of how much available machine capacity is being used.
A commonly used calculation is:
Machine Utilization = Operating Time ÷ Available Time × 100
The exact definition should be standardized for the specific manufacturing environment.
Target vs. Actual Performance
Comparing actual machine performance with expected performance can reveal production gaps.
For example:
Expected output: 1,000 units
Actual output: 920 units
Production gap: 80 units
The monitoring system can then help identify whether the gap was caused by downtime, slow cycles, idle periods, or other production losses.
Machine Performance Monitoring vs. Machine Efficiency Monitoring
The two concepts overlap, but they can have different focuses.
Machine efficiency monitoring generally emphasizes how effectively available machine time and capacity are being used.
Machine performance monitoring focuses more broadly on how the machine is operating and producing against expected performance.
| Machine Efficiency Monitoring | Machine Performance Monitoring |
|---|---|
| Utilization | Production rate |
| Runtime | Cycle time |
| Downtime | Output |
| Idle time | Speed |
| Capacity usage | Performance against target |
| Availability | Operating behavior |
In a modern manufacturing environment, both can be used together.
Efficiency metrics help explain how available capacity is used, while performance metrics help explain how effectively the machine operates during production.
Factors That Can Reduce Machine Performance
Machine performance can be affected by many factors beyond major equipment failures.
Slow Production Cycles
A machine may continue running while producing at a lower speed than its standard rate.
Over time, this can create significant production losses.
Frequent Short Stops
Small interruptions may only last a few seconds or minutes, but repeated interruptions can accumulate into substantial lost production time.
Unplanned Downtime
Equipment failures directly reduce available production time.
Changeover Delays
Longer-than-planned product changeovers can reduce productive operating time.
Material Shortages
Machines may remain available but unable to produce because required materials or components are unavailable.
Tool Wear
In processes that depend on tooling, tool wear can affect production speed, quality, and cycle time.
Operator Availability
Certain machines require continuous operator interaction. Staffing or operator availability can therefore affect performance.
Quality Issues
Rejects and rework can reduce effective production output even when machine activity appears normal.
Real-Time Machine Performance Monitoring
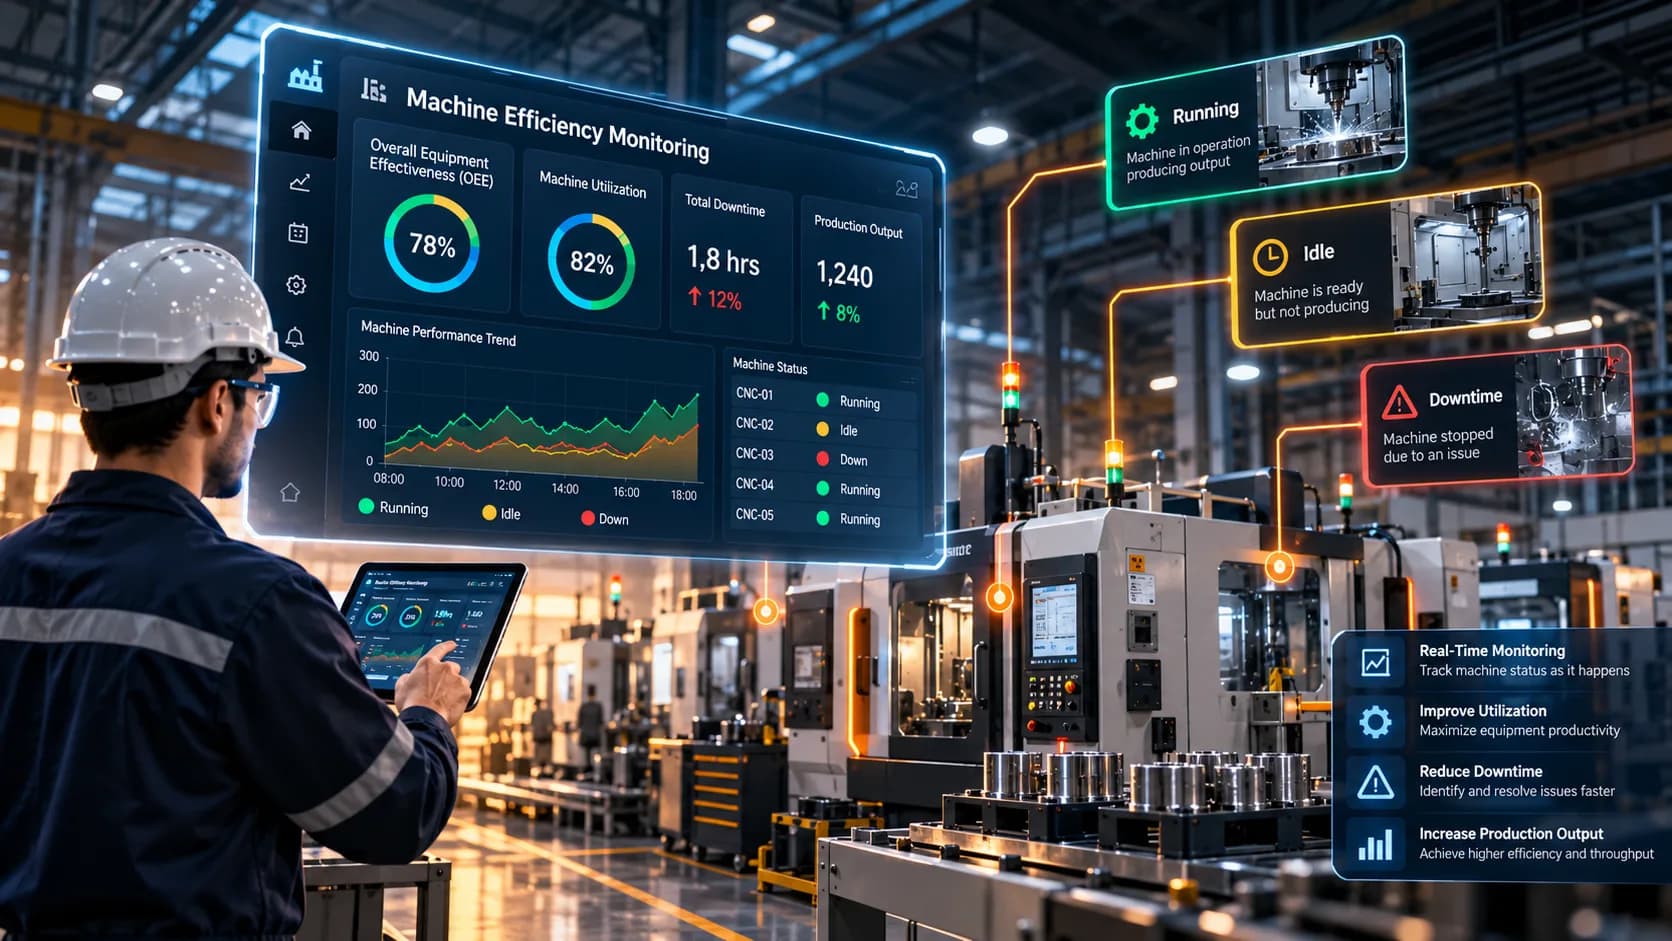
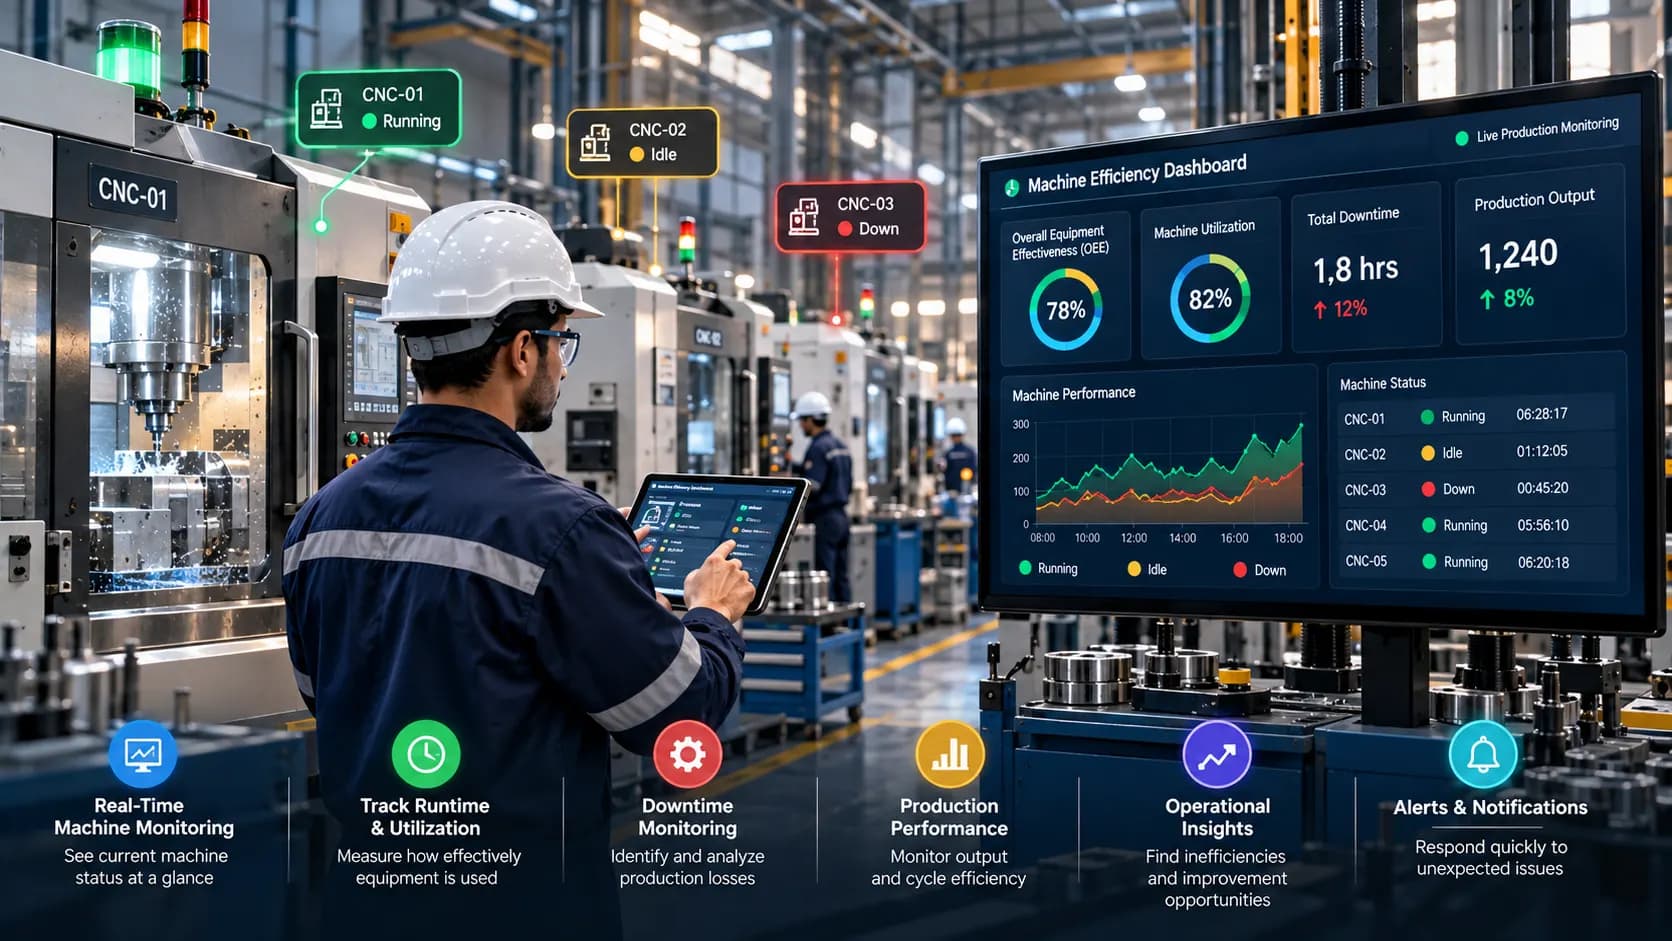
Real-time monitoring provides visibility into current machine conditions.
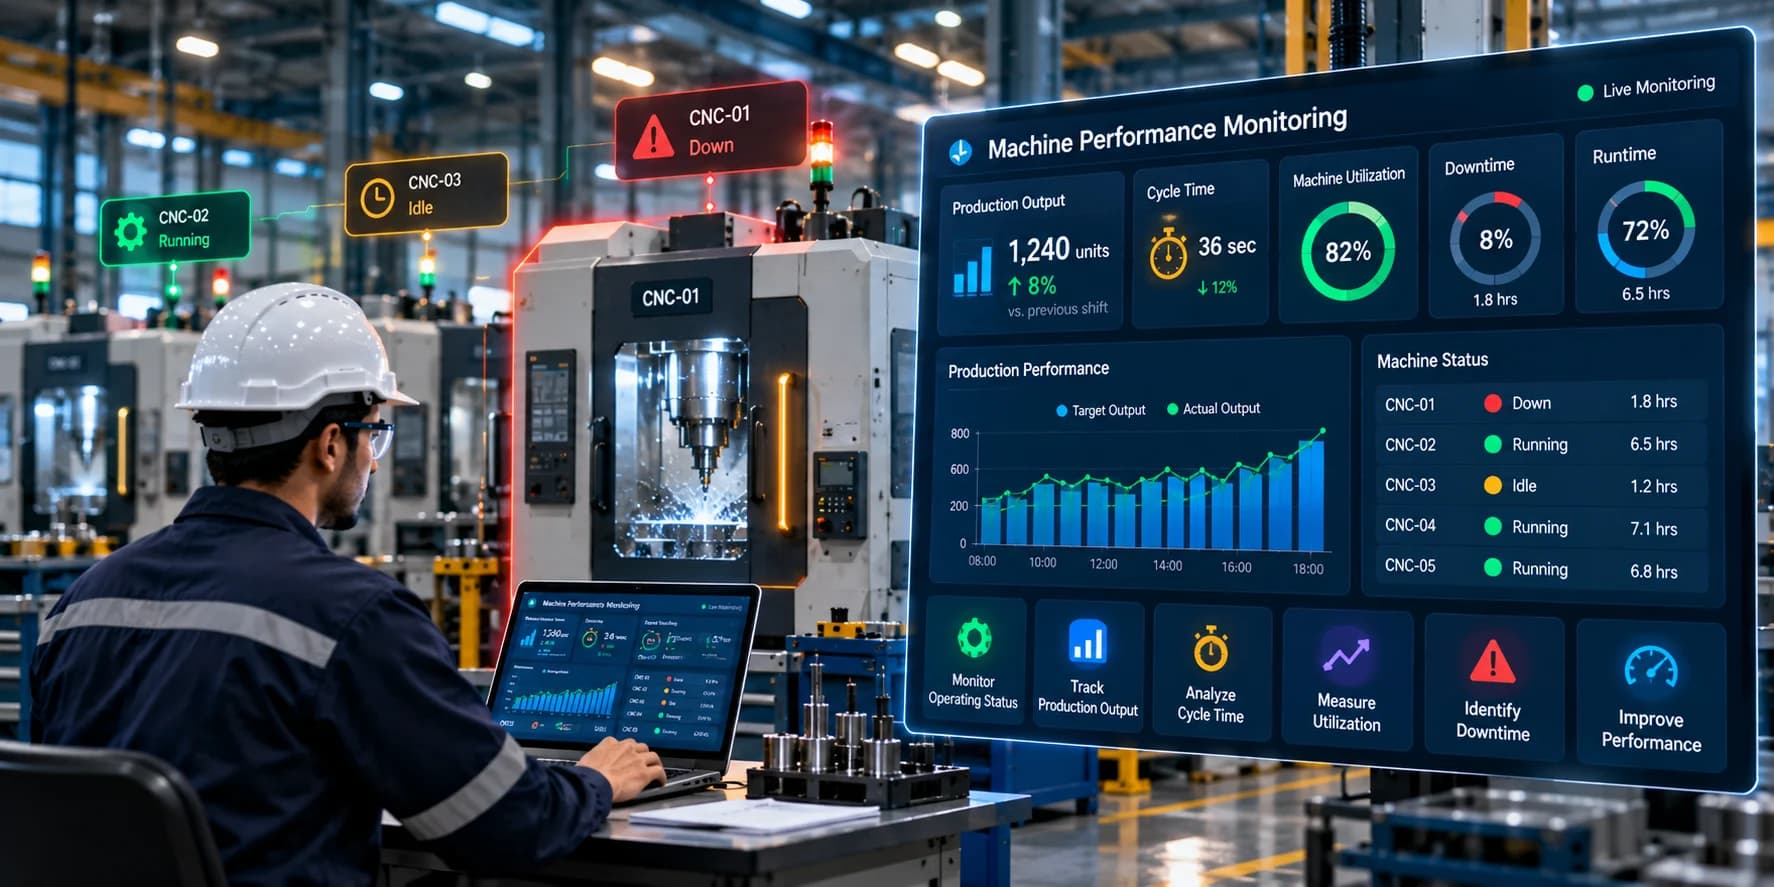
A production dashboard may show:
Current machine state
Current production count
Active production cycle
Current downtime
Runtime
Production rate
Alerts
Performance status
This allows supervisors to identify significant issues while production is still underway.
For example, if a machine remains stopped for an unusual amount of time, the production team can investigate the situation instead of discovering the problem only during an end-of-shift review.
Historical Machine Performance Monitoring
Historical data is equally important.
A machine may appear to perform normally during a single shift but show a recurring performance issue when analyzed over several weeks.
Historical monitoring can reveal:
Performance trends
Repeated downtime
Cycle-time changes
Shift differences
Output trends
Utilization patterns
Recurring short stops
This information can support continuous improvement and capacity planning.
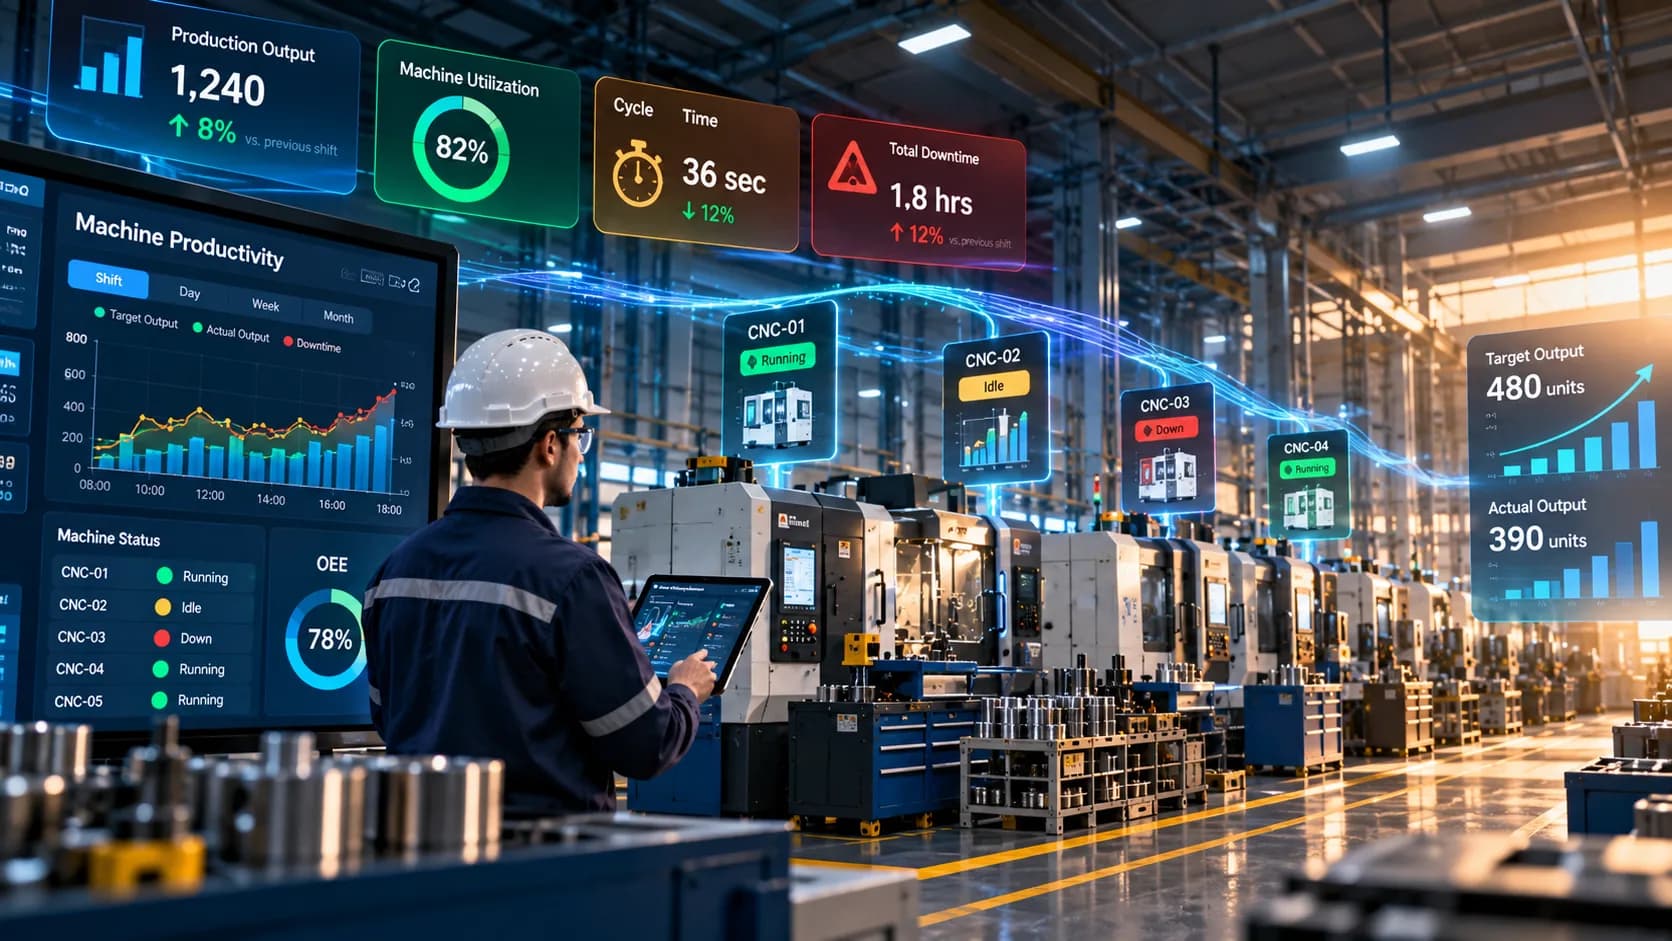
Machine Performance Monitoring Dashboard
A good dashboard should provide actionable information rather than simply displaying large amounts of machine data.
Machine Status
Shows whether equipment is running, idle, stopped, under maintenance, or experiencing another configured state.
Production Output
Displays actual production for the selected period.
Cycle Time
Shows actual cycle performance against the expected standard.
Runtime and Downtime
Provides a breakdown of productive and non-productive machine time.
Performance Trends
Shows how machine performance changes over time.
Target Achievement
Compares actual output with the configured production target.
Machine Comparison
Allows supervisors to compare performance between machines or production lines.
Alerts
Highlights significant events that require attention.
Machine Performance Monitoring for Different Teams
Production Managers
Production managers can use machine performance data to evaluate output, utilization, and production trends.
Plant Managers
Plant managers can compare production lines, identify recurring bottlenecks, and evaluate overall equipment performance.
Maintenance Teams
Maintenance teams can use machine activity and downtime information to identify recurring equipment problems.
Operators
Operators can use real-time information to understand current machine conditions and production status.
Management
Management teams can use summarized performance trends to support capacity planning and operational improvement decisions.
Machine Performance Monitoring and OEE
Machine performance monitoring can contribute important data to Overall Equipment Effectiveness (OEE) analysis.
OEE traditionally combines:
Availability
Performance
Quality
Machine performance monitoring can provide information such as:
Runtime
Downtime
Cycle time
Production output
Production speed
These metrics can help support the availability and performance components of OEE.
However, machine performance monitoring should not be treated as synonymous with OEE. A performance monitoring platform can track a much wider range of machine-level operational information depending on the organization's requirements.
Machine Performance Monitoring for Multiple Machines
Factories rarely operate a single machine in isolation.
A centralized monitoring system can provide visibility across:
Multiple machines
Production lines
Departments
Shifts
Facilities
This allows managers to compare performance and identify equipment that consistently operates below expected levels.
For example, if five similar machines operate under comparable conditions and one consistently has a lower production rate, the difference may warrant further investigation.
How to Implement Machine Performance Monitoring
Step 1: Define Performance Objectives
Determine what the organization wants to improve.
Possible objectives include:
Increase production output
Reduce cycle time
Reduce downtime
Improve utilization
Identify underperforming machines
Improve production visibility
Step 2: Identify Performance Standards
Define expected production rates, cycle times, output levels, or other relevant standards.
Standards should reflect the actual product and operating conditions.
Step 3: Audit Existing Machines
Identify available machine interfaces, PLCs, sensors, controllers, counters, and other sources of production information.
Step 4: Select the Required Data
Focus on data that directly supports the defined performance objectives.
Typical information includes:
Machine status
Production counts
Runtime
Downtime
Cycle time
Output
Fault conditions
Step 5: Establish Machine Connectivity
Connect machines to the monitoring platform using appropriate industrial communication methods.
Legacy machines may require additional sensors or gateways.
Step 6: Configure Machine States
Create standardized rules for interpreting machine activity.
For example:
Running
Idle
Stopped
Fault
Maintenance
Step 7: Configure Dashboards
Create views for operators, supervisors, plant managers, and management based on their requirements.
Step 8: Establish Baselines
Collect historical data to determine normal performance levels.
Step 9: Analyze Performance Losses
Look for:
Slow cycles
Repeated short stops
Long downtime
Low production rates
Underutilization
Step 10: Implement Improvements
Investigate the causes behind performance losses and implement corrective actions.
Step 11: Measure the Results
Continue monitoring after changes are introduced to determine whether performance actually improved.
Common Challenges
Legacy Machinery
Older machines may not provide digital data directly.
Additional sensors, PLC interfaces, or gateways may be required.
Different Machine Vendors
Factories often contain machines from multiple manufacturers, making integration more complex.
Data Quality
Incorrect signals or poorly configured machine-state logic can affect performance calculations.
Changing Production Conditions
Different products can have different cycle times and production rates.
Performance standards should therefore account for product differences.
Data Overload
Collecting every available machine signal can create unnecessary complexity.
Select metrics that support actual decisions.
Lack of Context
Machine data can show that performance dropped but may not automatically identify the root cause.
Operator inputs, maintenance data, material information, or production-order data may be needed for deeper analysis.
Best Practices for Machine Performance Monitoring
Define Clear Performance Standards
Establish realistic cycle times, output targets, and production rates.
Use Product-Specific Standards
Different products may require different production parameters.
Separate Planned and Unplanned Downtime
This provides more meaningful performance analysis.
Monitor Short Stops
Repeated short interruptions can have a significant cumulative effect.
Combine Machine Data With Production Data
Machine status alone may not provide enough information to understand actual production performance.
Use Real-Time and Historical Data
Real-time data supports immediate action, while historical information supports long-term improvement.
Standardize Machine States
Use consistent definitions across machines and production lines.
Keep Dashboards Simple
Display the metrics that users actually need.
Validate Data Regularly
Review machine signals and calculations to ensure reported performance is accurate.
Turn Data Into Action
Monitoring should lead to investigation, corrective action, and measurable improvement.
Machine Performance Monitoring and Industry 4.0
Machine performance monitoring is an important component of connected manufacturing.
Industry 4.0 environments increasingly connect industrial machines, sensors, IoT gateways, production systems, analytics platforms, and enterprise applications.
Machine performance data can support:
Industrial IoT
Smart manufacturing
Production analytics
Automated reporting
Capacity planning
Manufacturing intelligence
The long-term value comes from connecting machine data with processes that can use that information to improve production.
How Machine Performance Monitoring Supports Continuous Improvement
Continuous improvement requires reliable information about current performance.
A typical improvement cycle can be:
Measure → Analyze → Identify Loss → Improve → Measure Again
For example:
Machine monitoring identifies a consistently long cycle time.
The production team investigates the cause.
A process adjustment is implemented.
New cycle-time data is collected.
The result is compared with the original baseline.
This approach makes improvement measurable rather than relying solely on subjective observations.
Frequently Asked Questions
What is machine performance monitoring?
Machine performance monitoring is the process of measuring and analyzing machine operating conditions, production output, cycle time, runtime, downtime, utilization, and other indicators to determine how effectively equipment is performing.
Why is machine performance monitoring important?
It helps manufacturers identify performance losses, compare actual results with expected standards, and make better production decisions using machine-level data.
What metrics should be monitored?
Common metrics include production output, cycle time, production rate, runtime, downtime, idle time, utilization, availability, and target achievement.
Can machine performance monitoring work with old machines?
Yes. Depending on the equipment, legacy machines can be connected using sensors, PLC interfaces, industrial gateways, or other data acquisition methods.
What is the difference between machine performance and machine efficiency?
Machine performance focuses on how effectively equipment operates and produces against expected standards. Machine efficiency generally emphasizes how effectively available time and capacity are used. The two concepts overlap and are often monitored together.
Can machine performance monitoring reduce machine downtime?
Monitoring does not directly repair equipment or eliminate downtime. It provides visibility into downtime patterns so production and maintenance teams can investigate causes and take corrective action.
Can multiple machines be monitored from one dashboard?
Yes. A centralized monitoring platform can provide machine-level and production-line-level information across multiple connected machines.
Is real-time monitoring necessary?
Not always. Real-time monitoring is valuable for immediate operational response, while historical monitoring is essential for identifying longer-term trends and recurring performance issues.
How does machine performance monitoring support OEE?
Machine performance monitoring can provide data related to runtime, downtime, cycle time, production output, and other metrics used to understand OEE's availability and performance components.
Conclusion
Machine Performance Monitoring gives manufacturers a practical way to understand how their equipment actually performs during production.
By tracking machine runtime, downtime, cycle time, production output, production rate, utilization, and performance against defined standards, manufacturers can identify losses that may remain hidden in traditional production reports.
The most effective monitoring strategy combines reliable machine data with clear performance standards and actionable dashboards. Real-time information helps teams respond to current problems, while historical analysis helps identify recurring patterns and measure improvement.
Ultimately, machine performance monitoring is not simply about watching machines. It is about creating a reliable data foundation that helps production teams understand performance, investigate losses, improve processes, and make better use of manufacturing capacity.