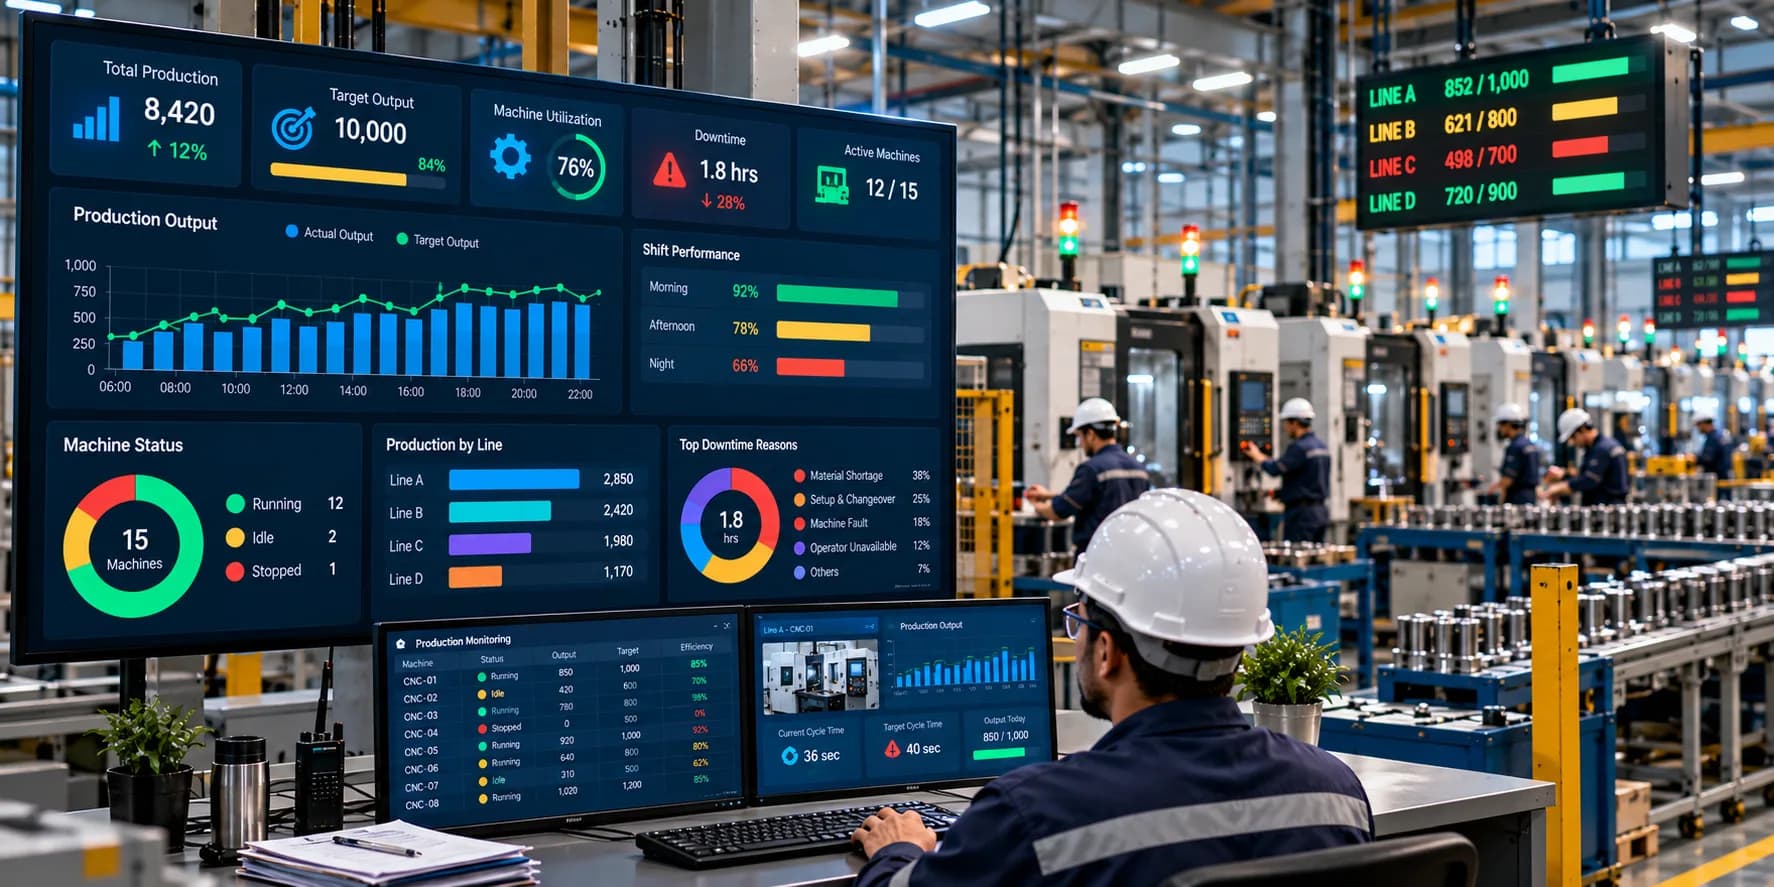
Manufacturing productivity depends on how effectively a factory converts its available resources into finished products. Machines, operators, raw materials, production schedules, and quality processes must work together to meet production targets without unnecessary delays or resource waste.
However, when production information is scattered across machine controllers, spreadsheets, manual registers, and separate departmental systems, understanding actual factory performance becomes difficult. Production managers may know that an order was delayed or a target was missed without having a clear picture of where the problem originated.
Factory Productivity Monitoring helps manufacturers bring production information together, measure performance against defined targets, and identify operational issues that affect output.
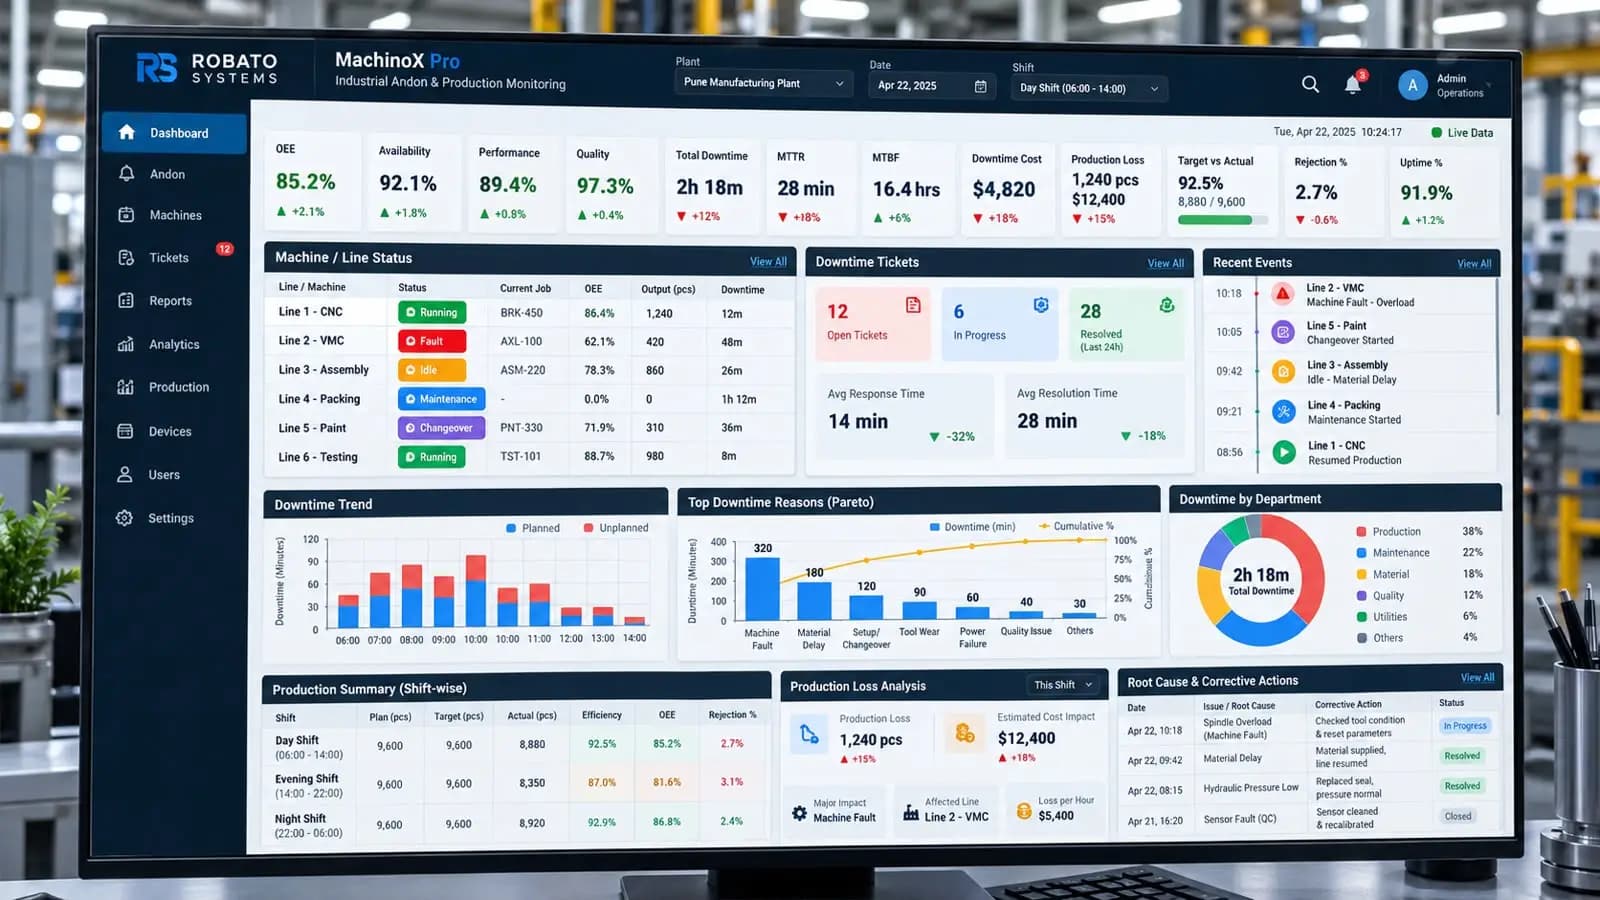
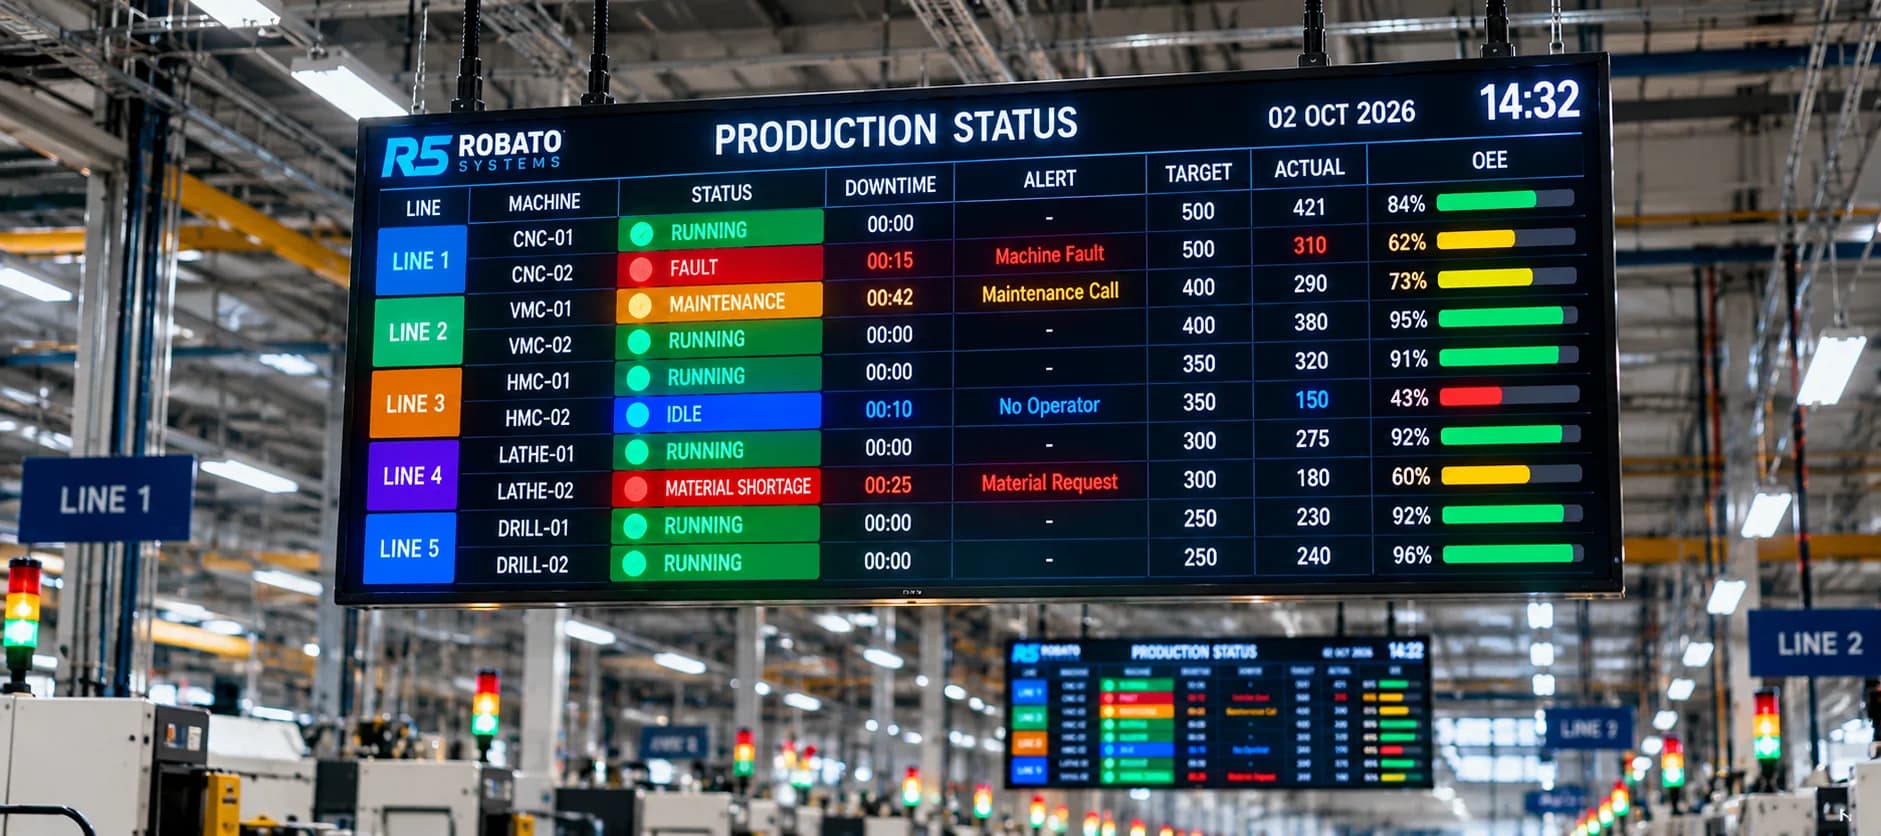
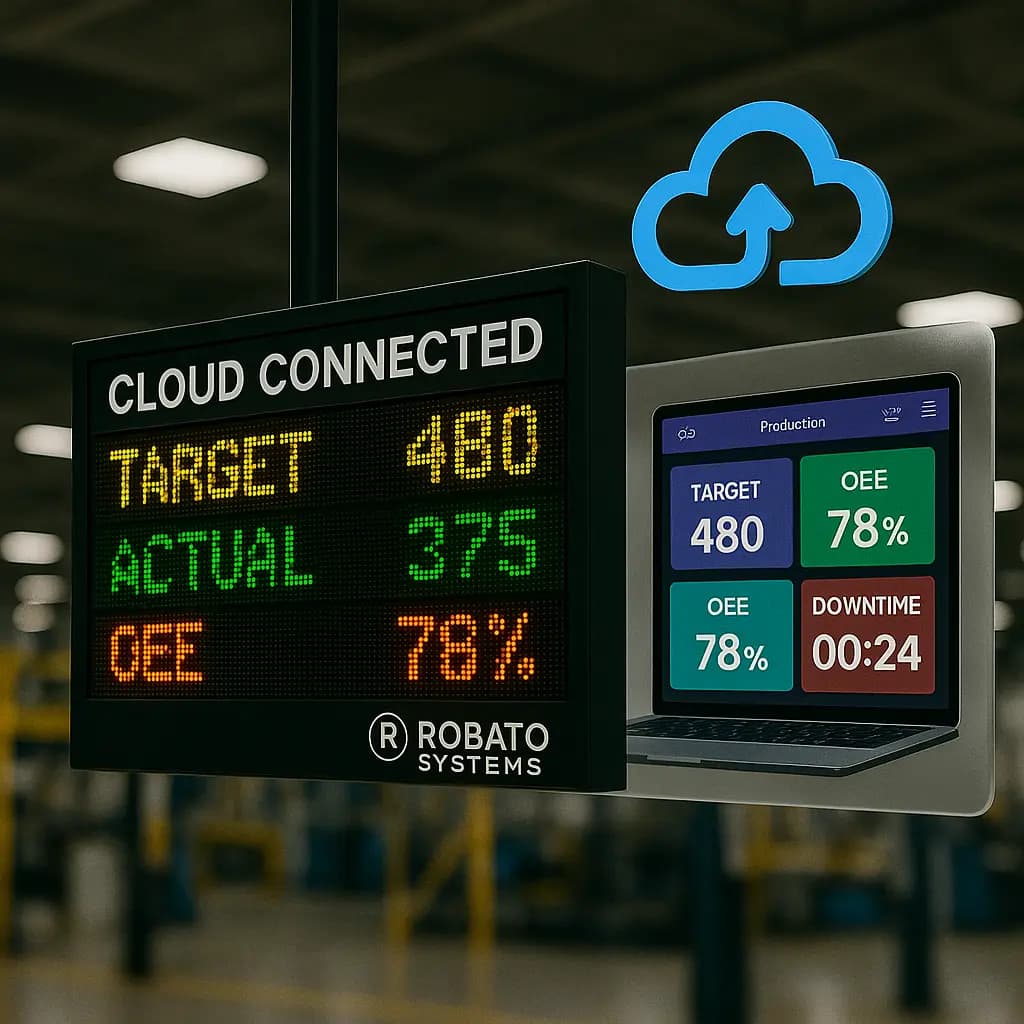
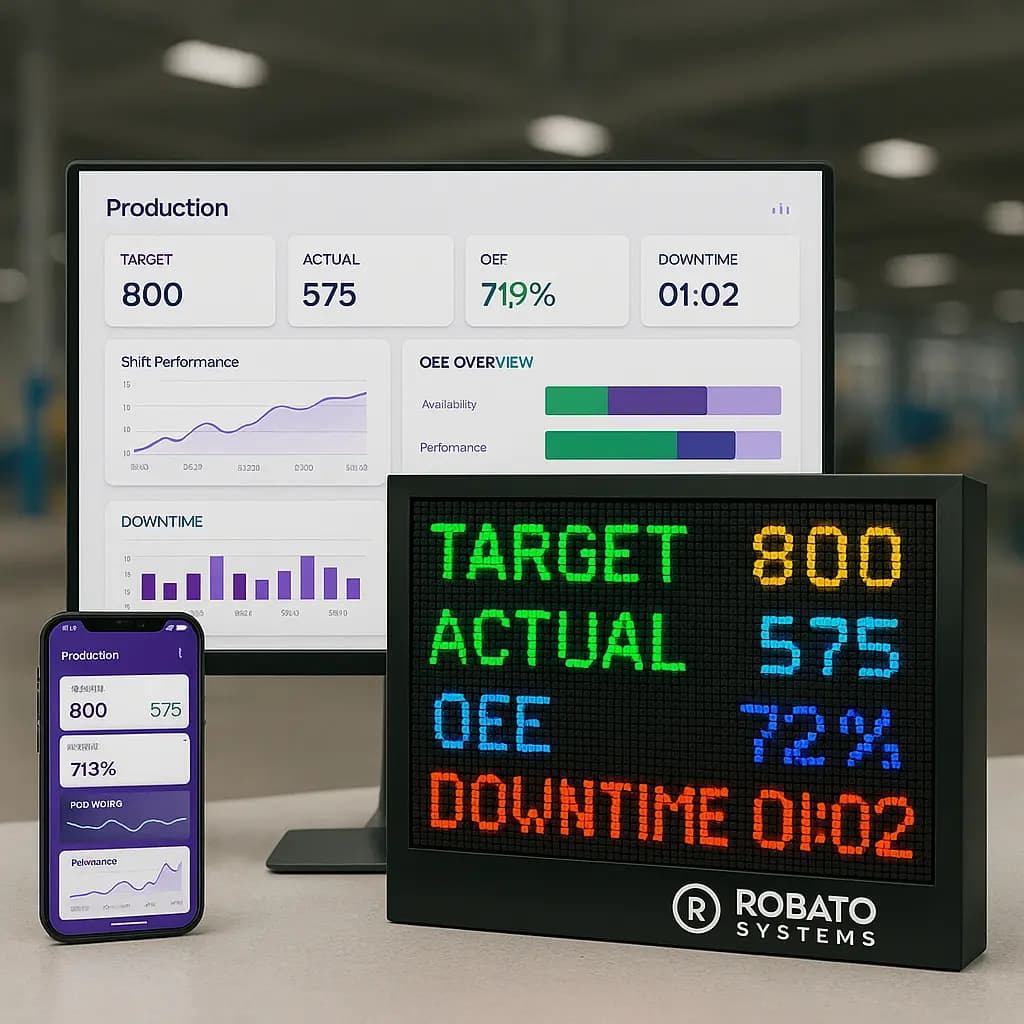
Using connected machine data, production dashboards, reporting tools, and relevant operational metrics, manufacturers can monitor production progress, identify bottlenecks, compare performance across shifts, and make more informed decisions.
This guide explains factory productivity monitoring, its key features, important KPIs, implementation methods, benefits, common challenges, and best practices for building a more transparent and productive manufacturing operation.
What Is Factory Productivity Monitoring?
Factory productivity monitoring is the process of collecting, analyzing, and reviewing operational data to understand how effectively a manufacturing facility uses its resources to produce goods.
Unlike monitoring a single machine, factory-level monitoring considers the wider production environment, including machines, production lines, shifts, output, and workflow dependencies.
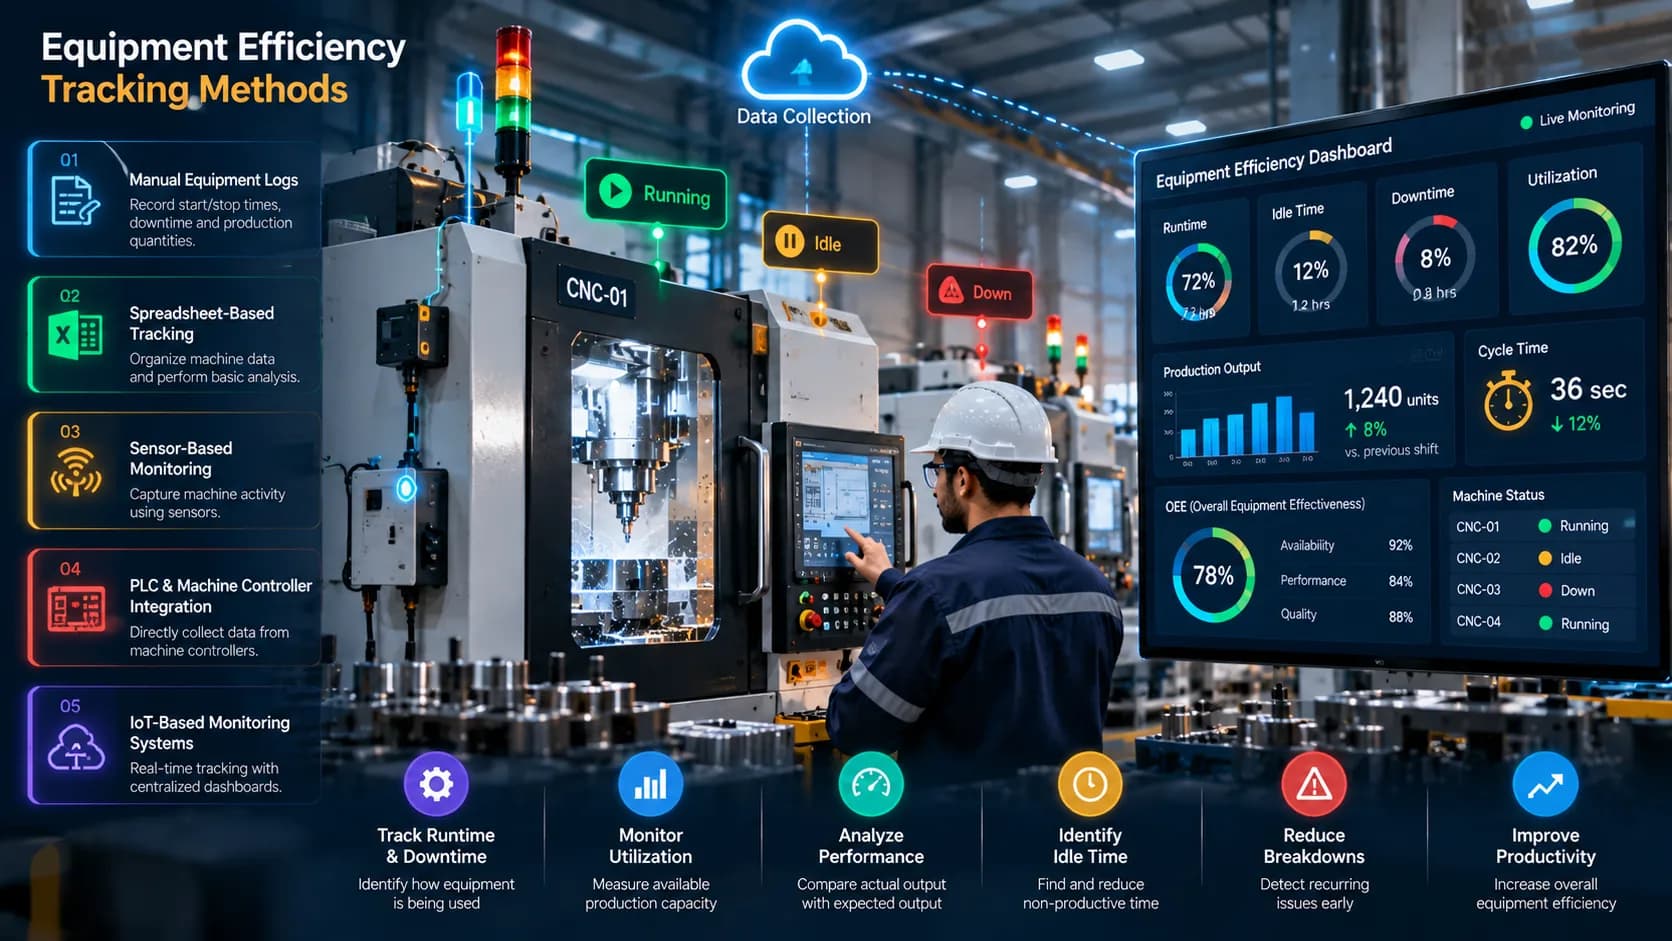
Depending on the system and factory requirements, monitoring may include:
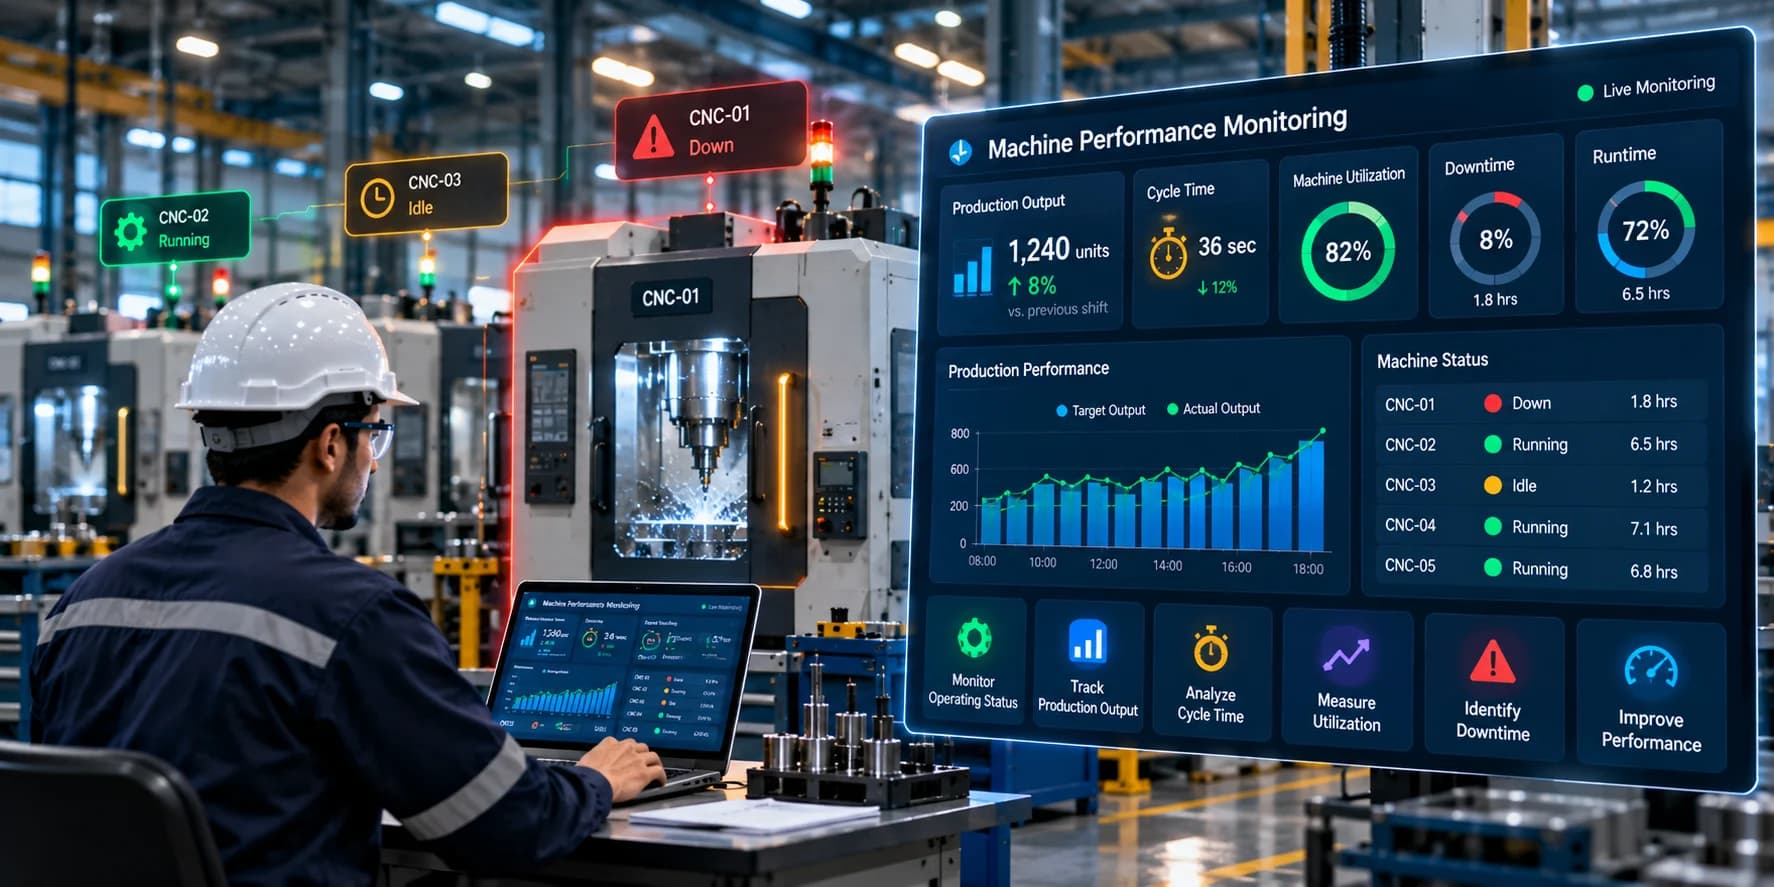
Production output
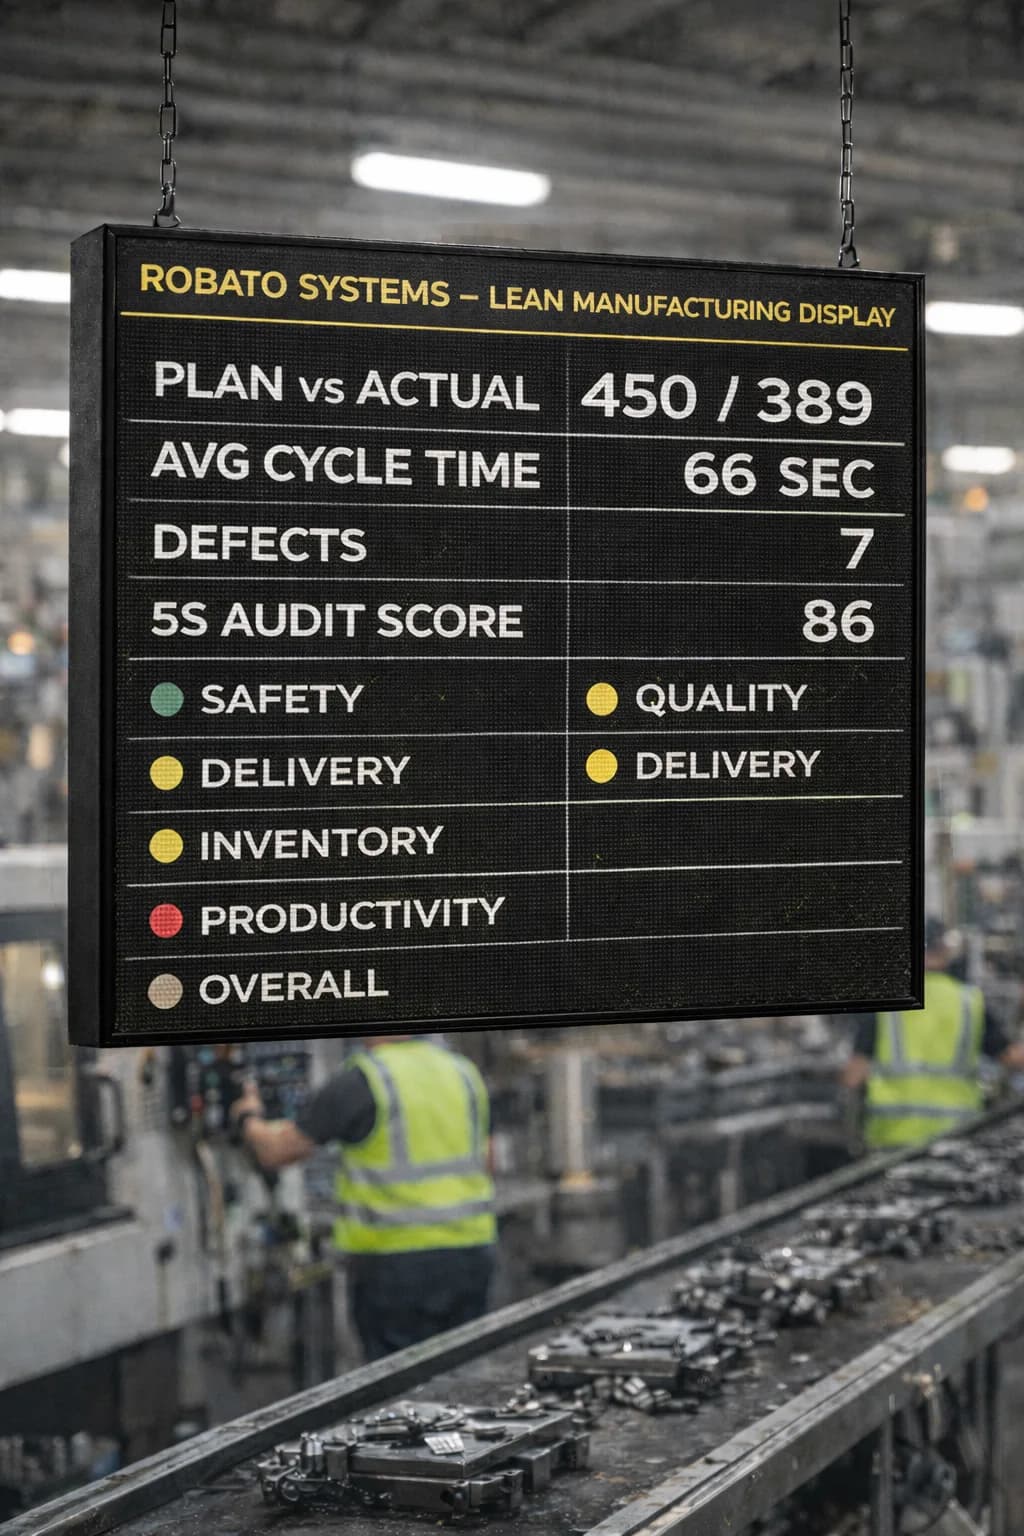
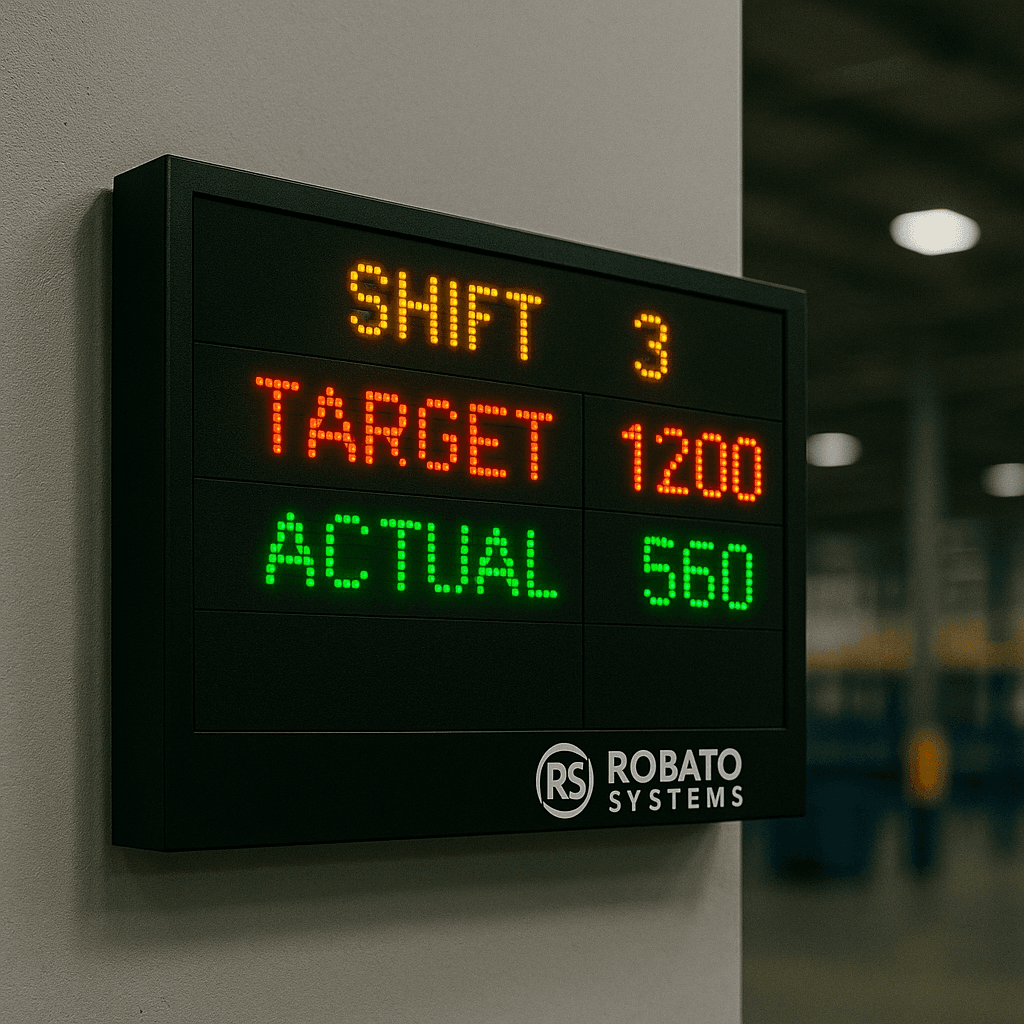
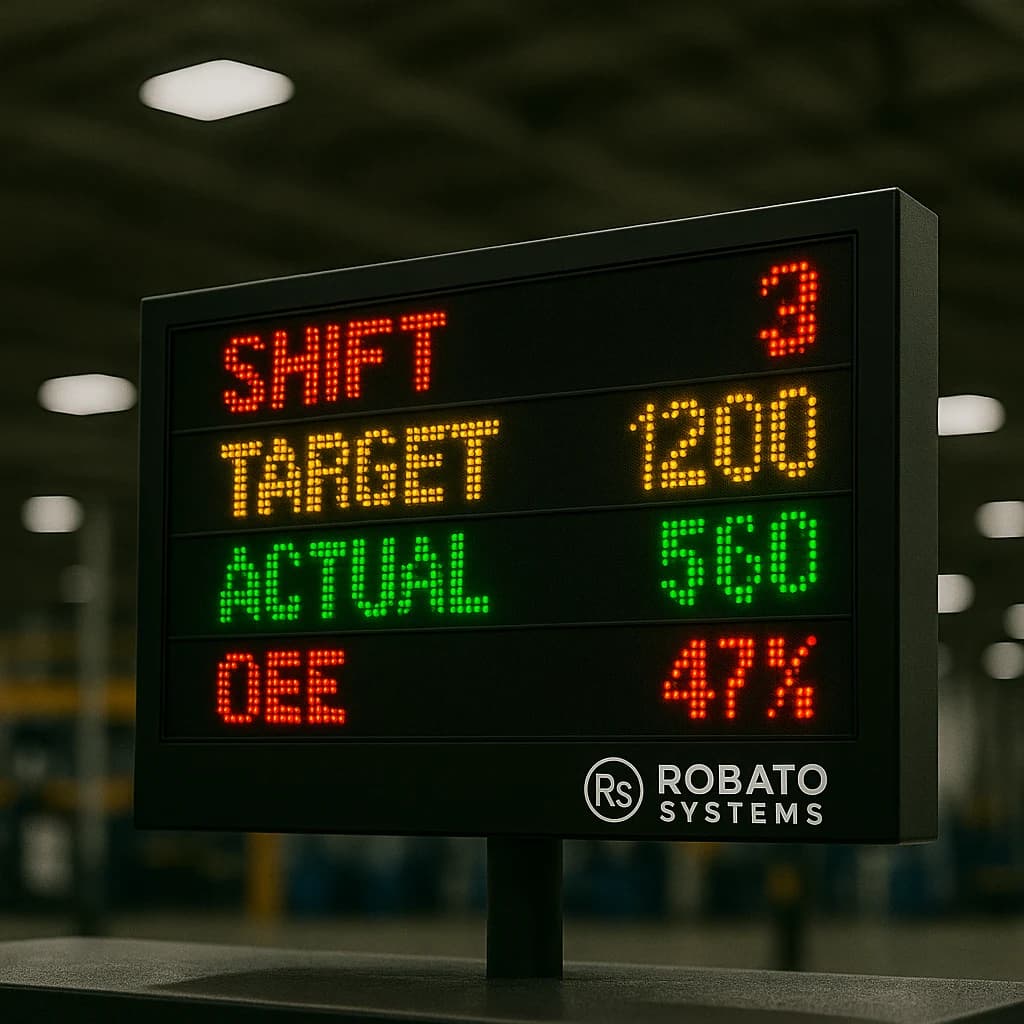
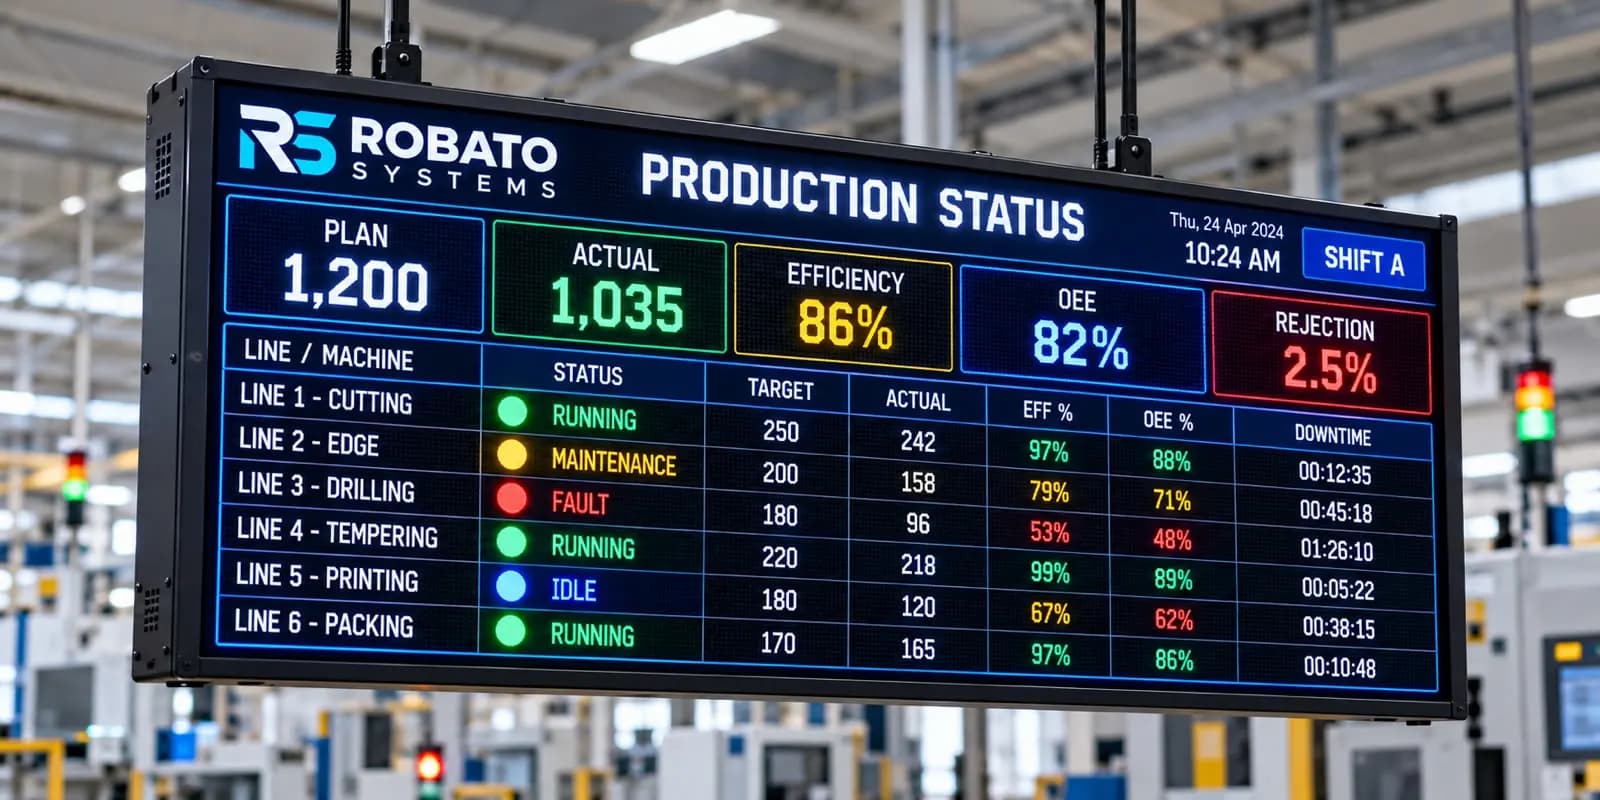
Planned versus actual production
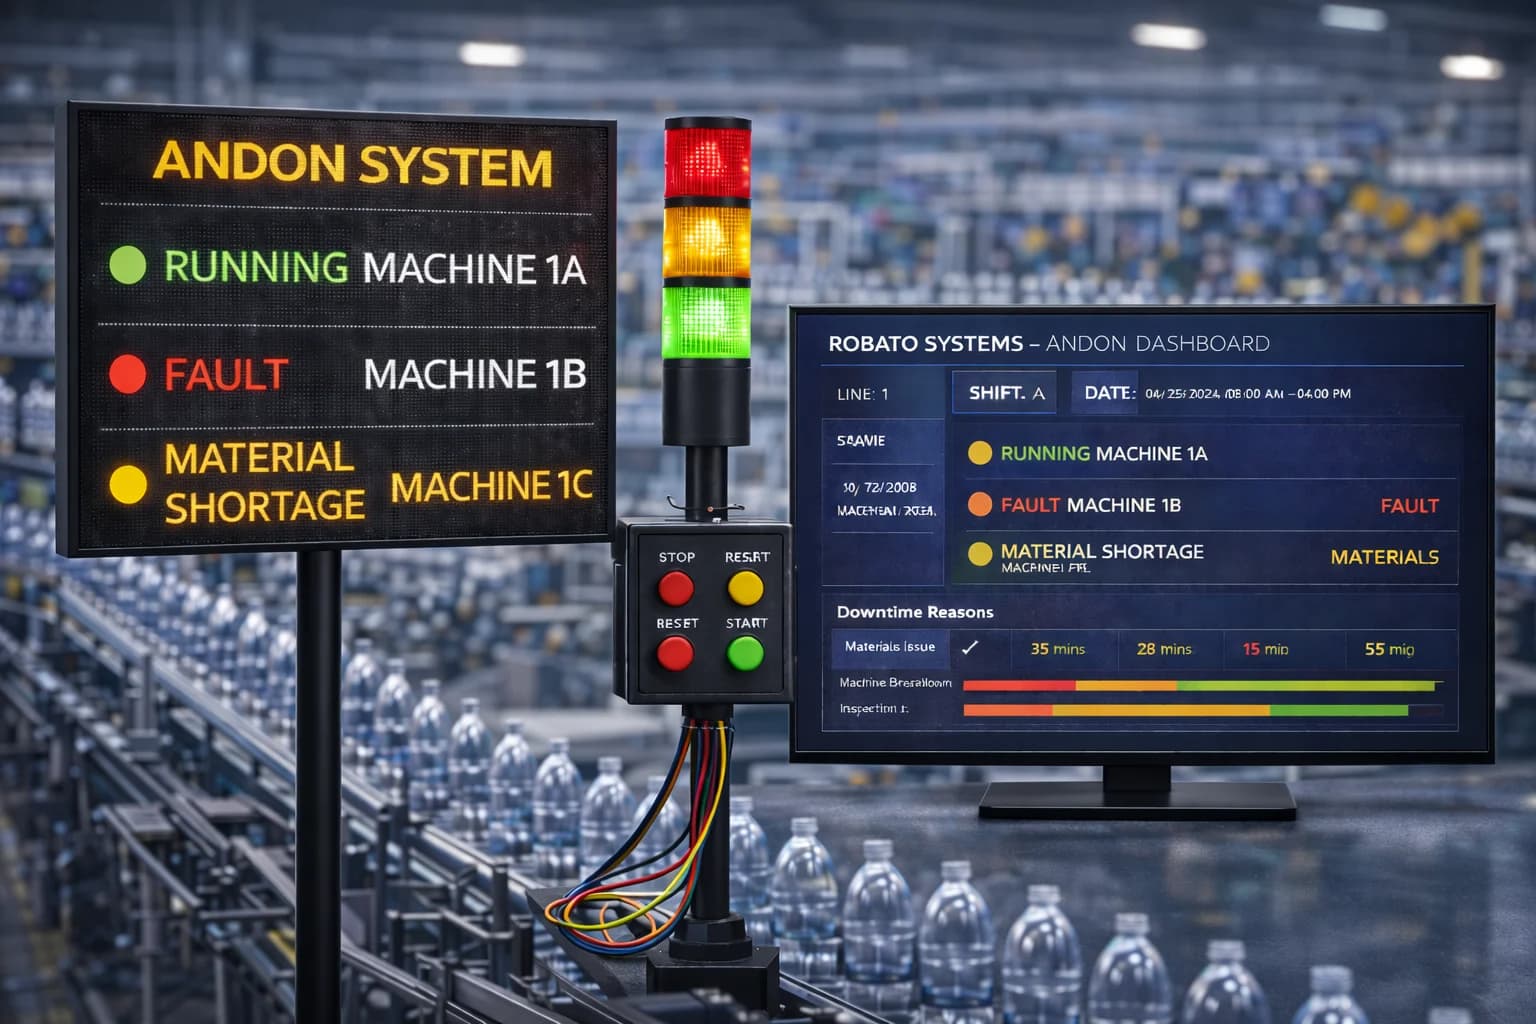
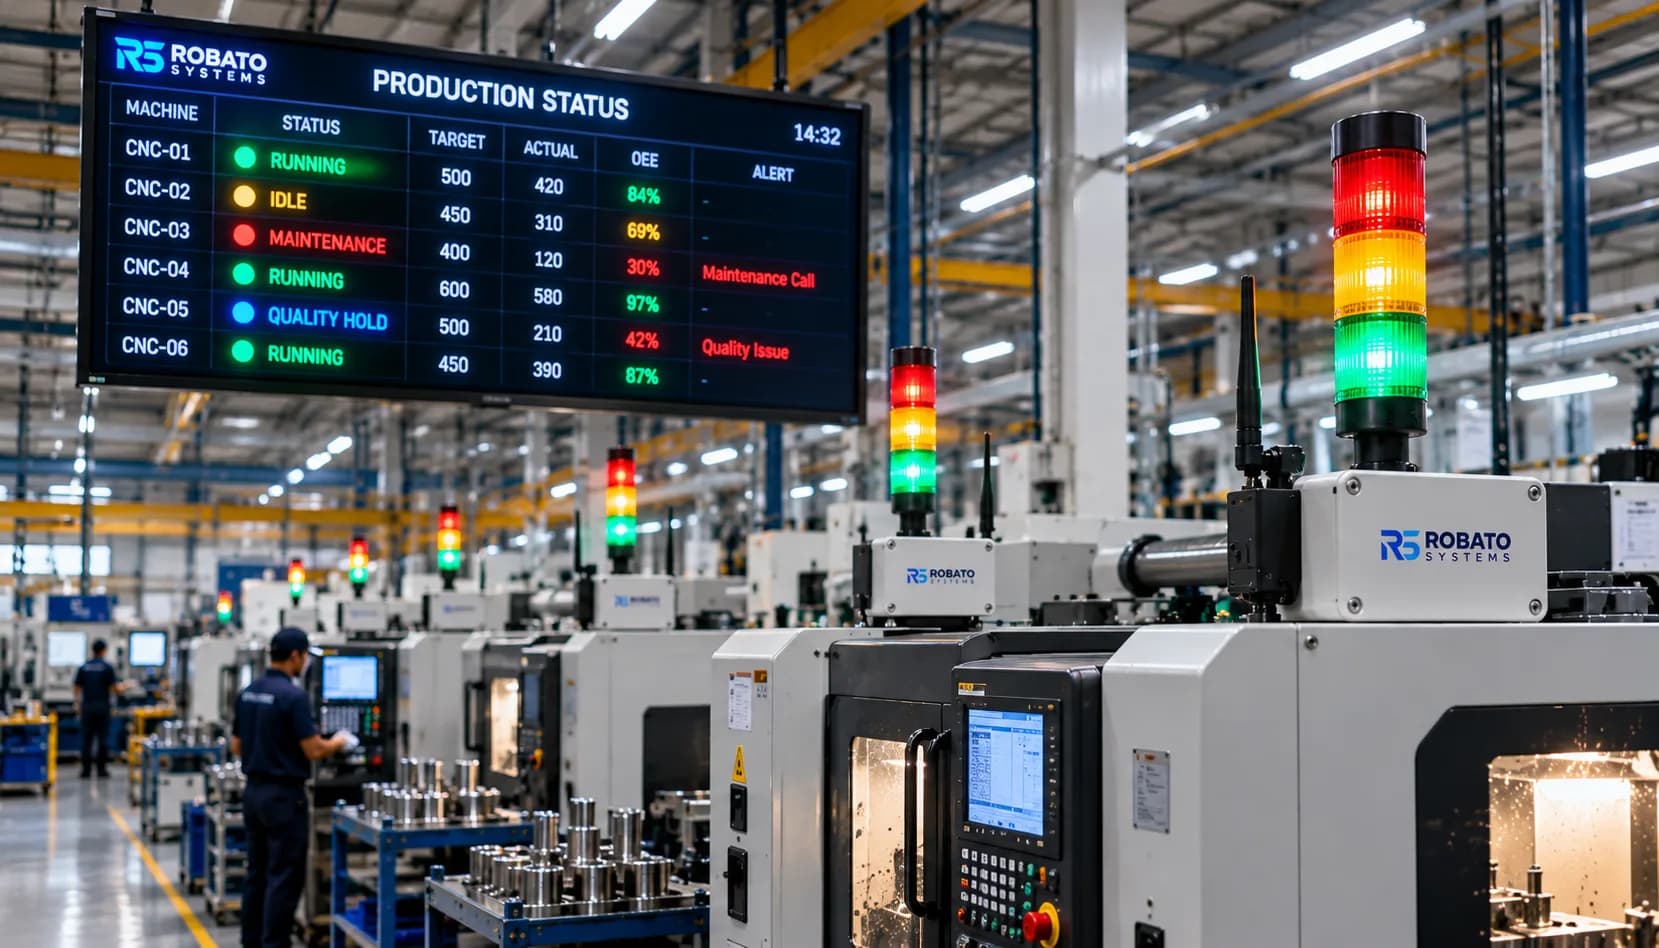
Machine operating status
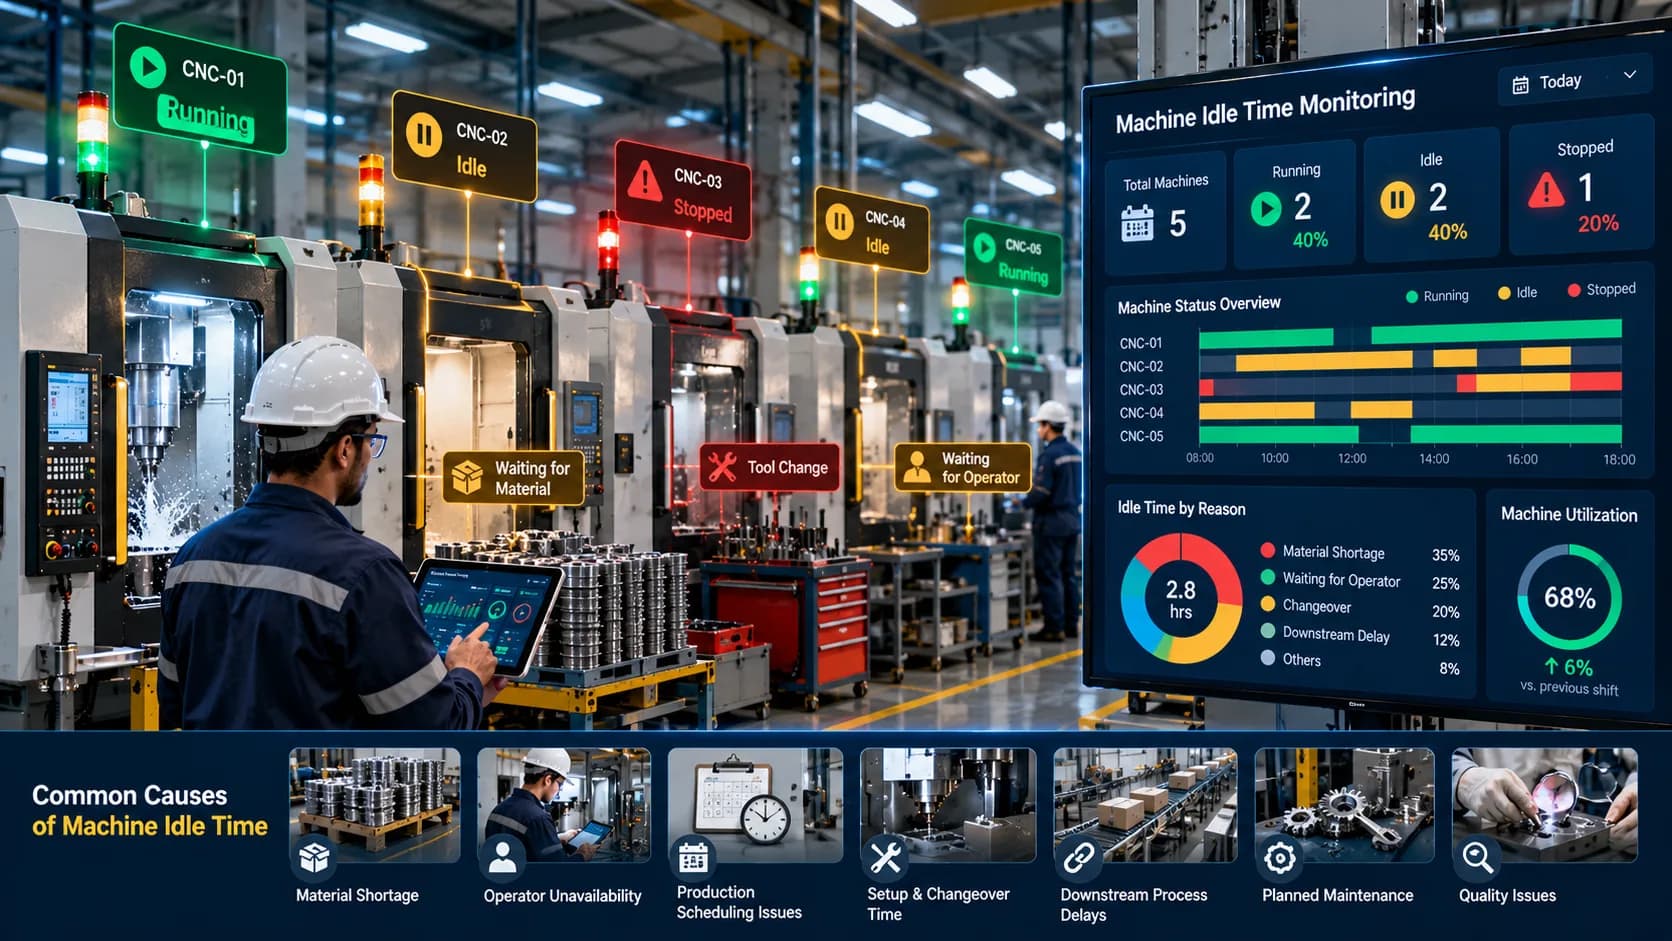
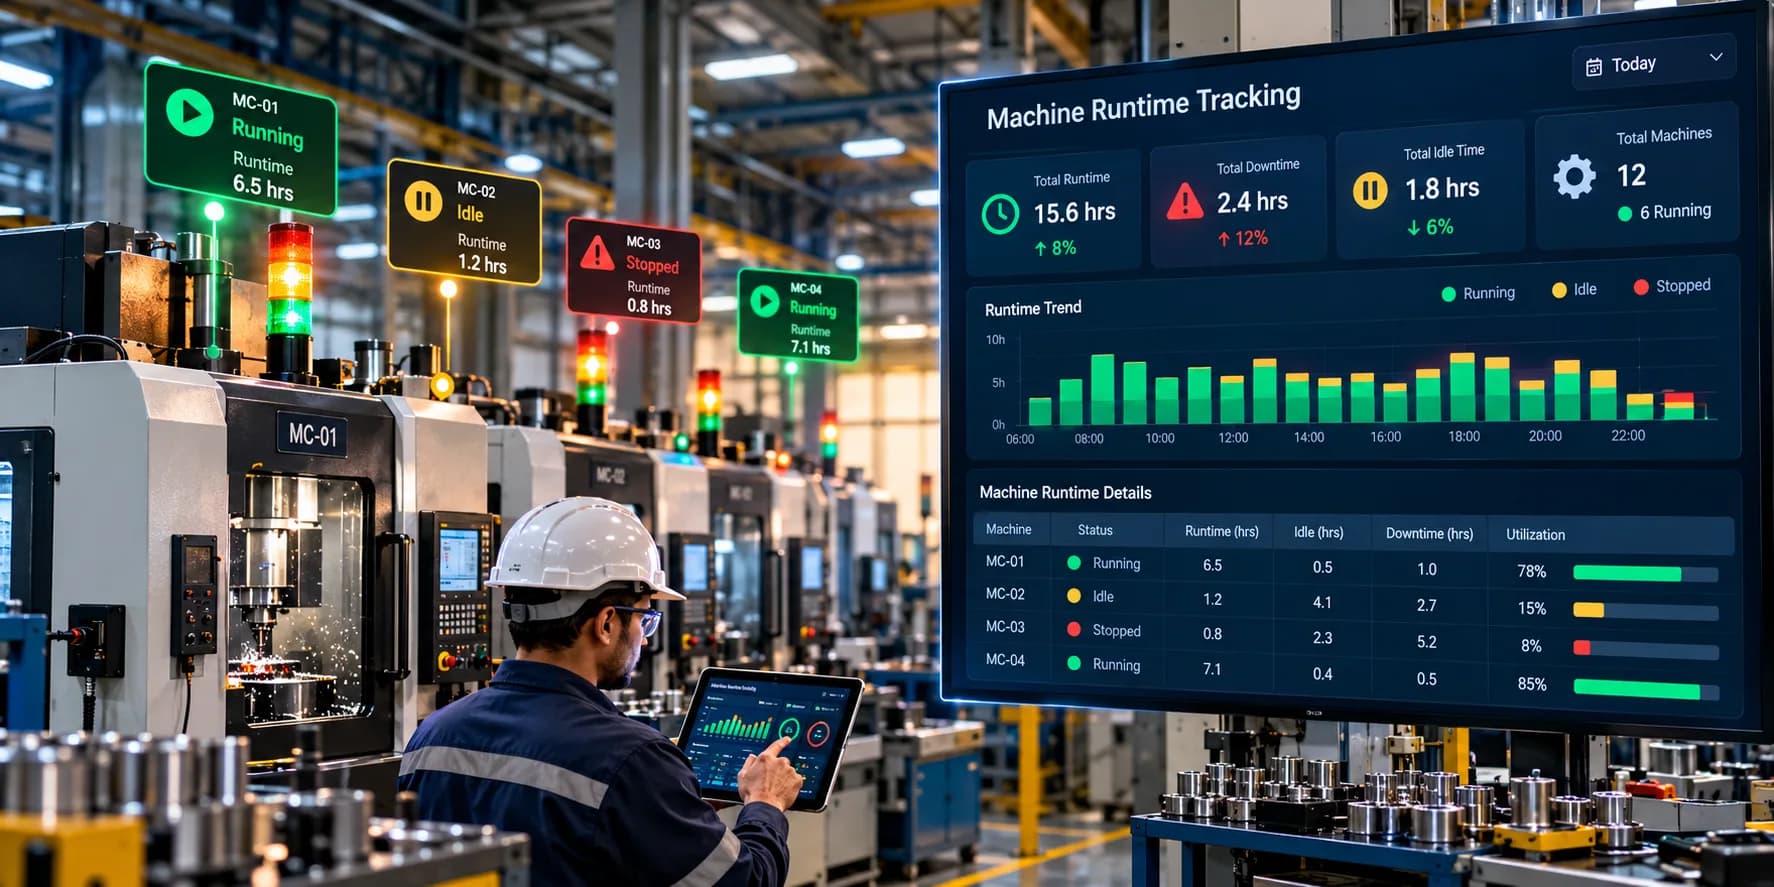
Runtime and downtime
Production cycle times
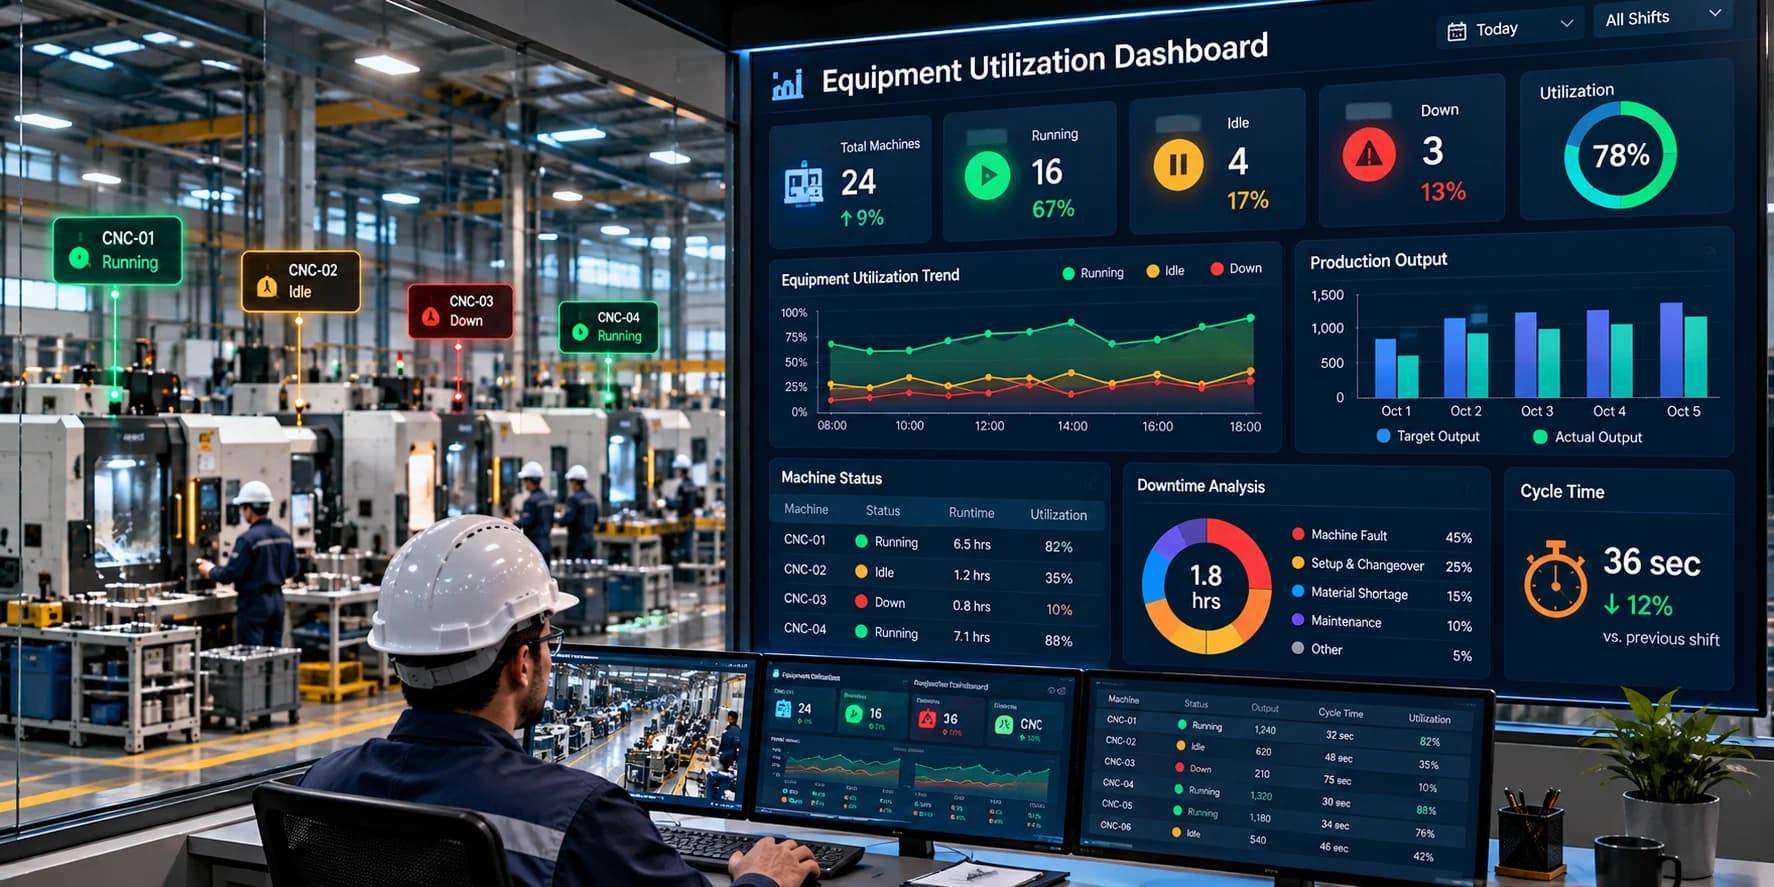
Equipment utilization
Production delays
Quality-related losses
Work-in-progress information
The objective is to provide a reliable view of factory performance and help teams understand which operational factors are affecting production results.
For example, if a factory consistently misses its daily production target, factory productivity monitoring can help determine whether the issue relates to equipment availability, slow production cycles, material shortages, workflow bottlenecks, or other operational constraints.
Why Is Factory Productivity Monitoring Important?
Manufacturing operations involve multiple connected processes. A problem in one area can affect output across an entire production line.
For example, a material shortage at one workstation may cause a downstream machine to remain idle. That interruption can then affect subsequent operations, delay order completion, and create pressure on the remaining production schedule.
Without timely and consistent information, identifying the original cause can require extensive manual investigation.
Factory productivity monitoring helps manufacturers answer important questions:
Are production targets being achieved?
Which production lines are performing below expectations?
Where are the main production bottlenecks?
How much time is lost to equipment interruptions?
Are different shifts delivering comparable results?
Is the factory using its available capacity effectively?
Which production issues require immediate attention?
These insights support better coordination between production, maintenance, quality, planning, and management teams.
How Does Factory Productivity Monitoring Work?
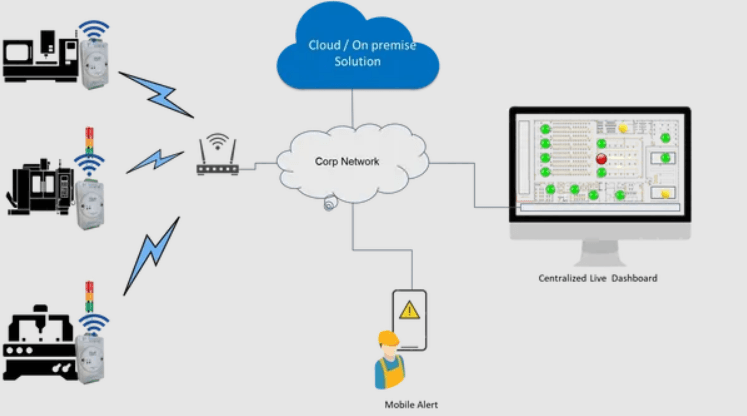
A factory productivity monitoring solution generally combines data collection, processing, visualization, and operational analysis.
1. Production Data Collection
The system collects information from relevant sources, which may include:
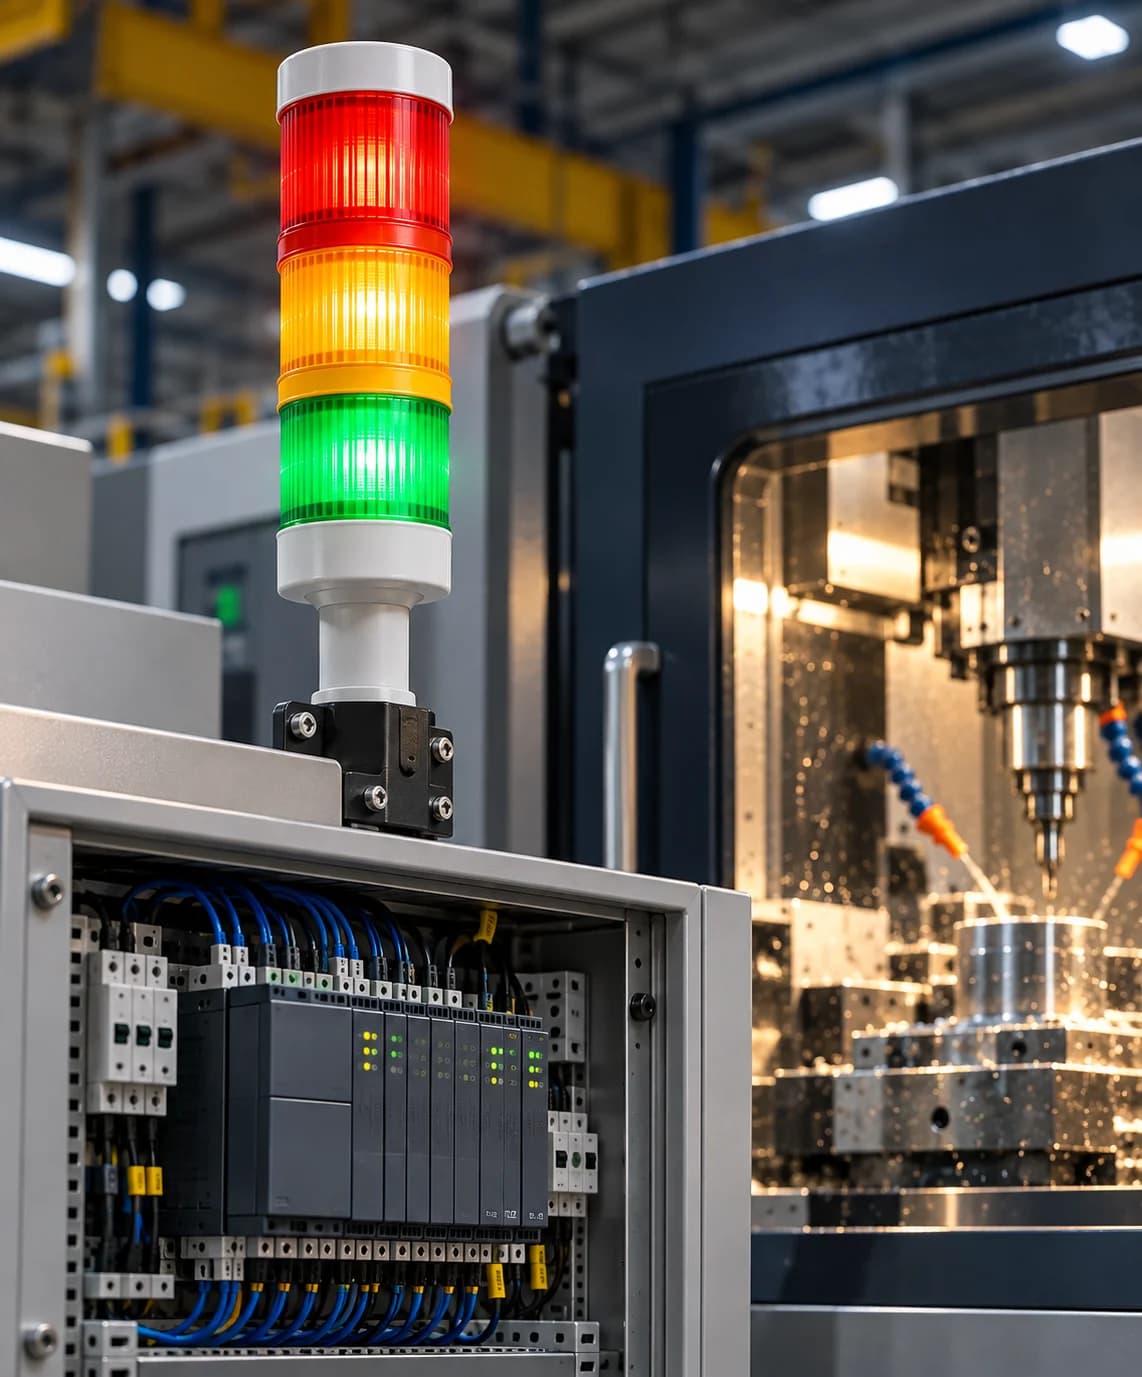
PLCs and machine controllers
Industrial sensors
Machine counters
Production terminals
Operator inputs
Manufacturing execution systems
ERP or production planning systems
The available information depends on the factory's existing infrastructure and integration requirements.
2. Data Processing and Standardization
Information from different sources is organized into a consistent structure.
For example, machine signals can be converted into running, idle, stopped, and fault states. Production counters can be used to calculate output, while production schedules provide planned targets for comparison.
Standardized data is important because inconsistent definitions can produce misleading reports.
3. Productivity Calculations
The system calculates relevant metrics based on the collected information.
These may include production rate, target achievement, runtime, downtime, utilization, and shift-level output.
4. Dashboard Visualization
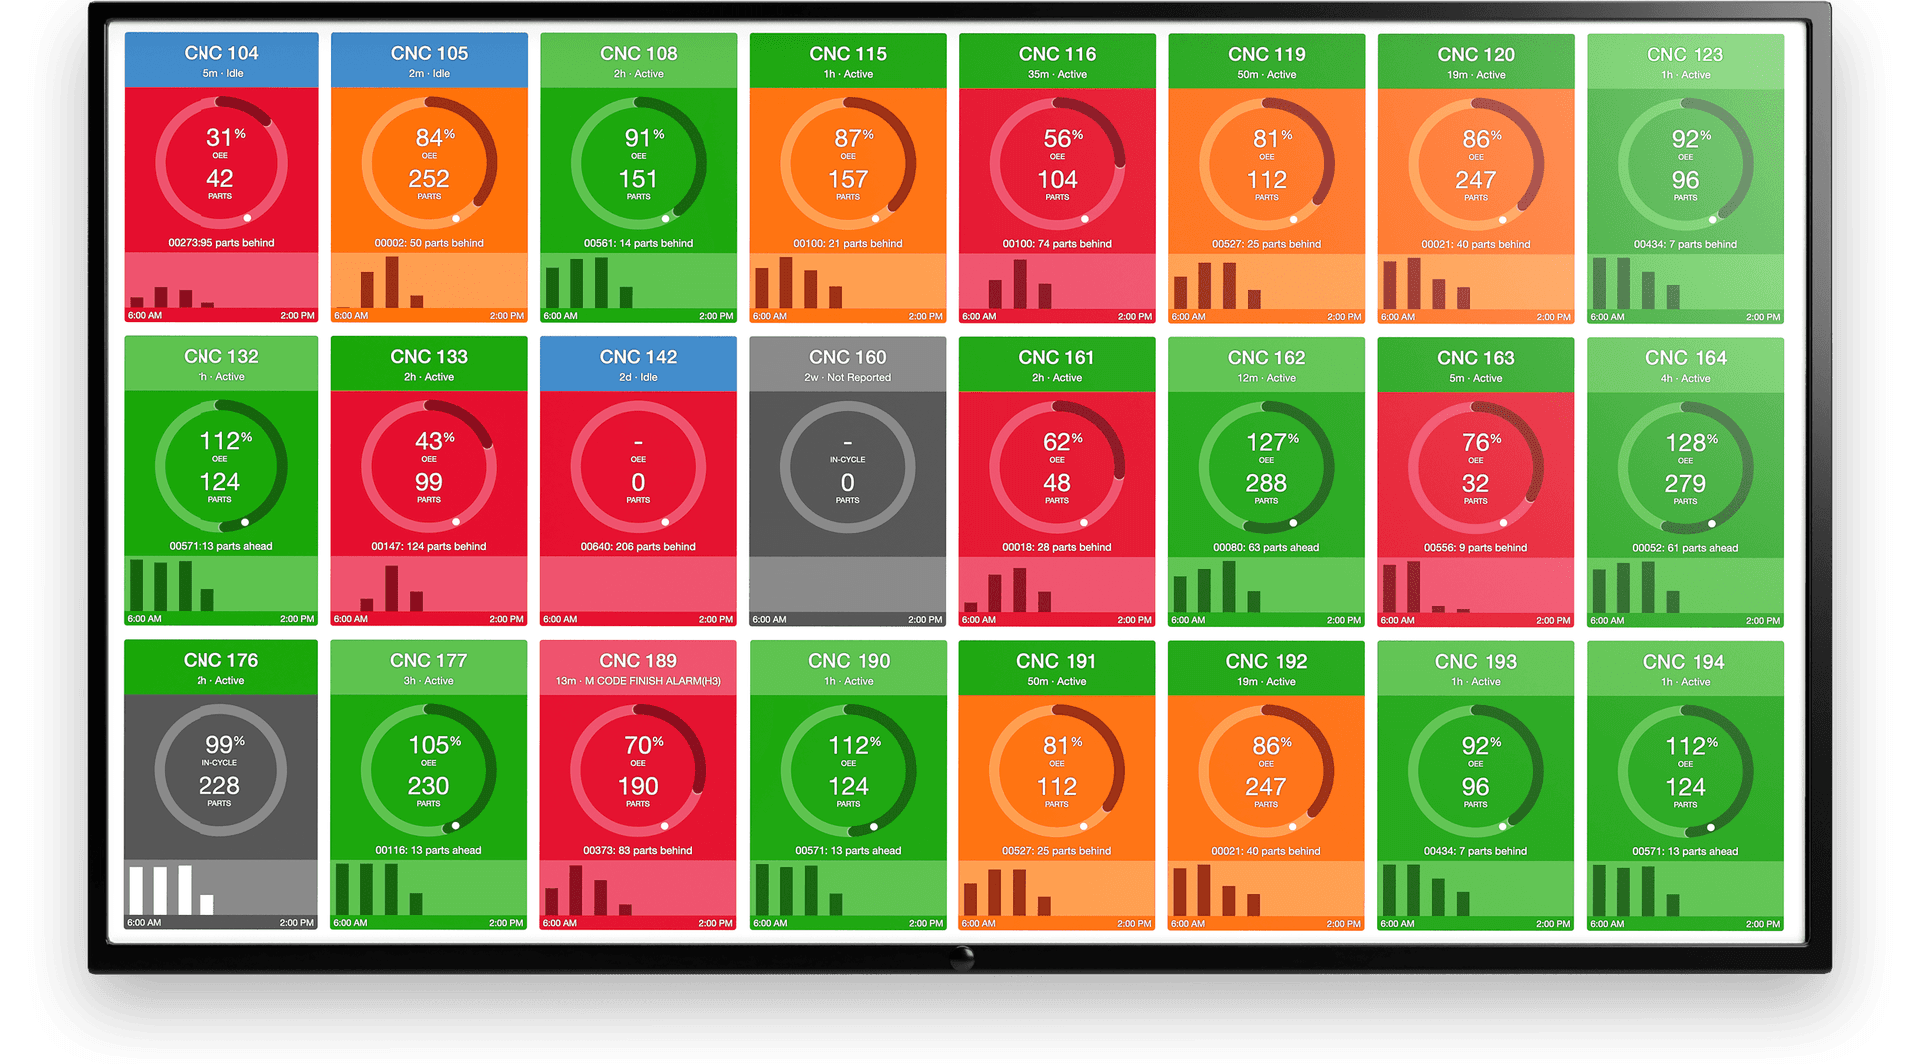
The processed information is displayed through centralized dashboards and reports.
Managers can review factory-level performance while supervisors examine individual machines, production lines, or shifts.
5. Analysis and Corrective Action
Production teams investigate deviations from expected performance and implement suitable corrective actions.
Monitoring becomes most valuable when it leads to measurable operational improvements rather than simply producing more reports.
Key Features of Factory Productivity Monitoring Solutions
The right feature set depends on the factory's size, production process, and business objectives. However, several capabilities are particularly useful.
Real-Time Production Monitoring
Real-time or near-real-time monitoring provides visibility into current production conditions.
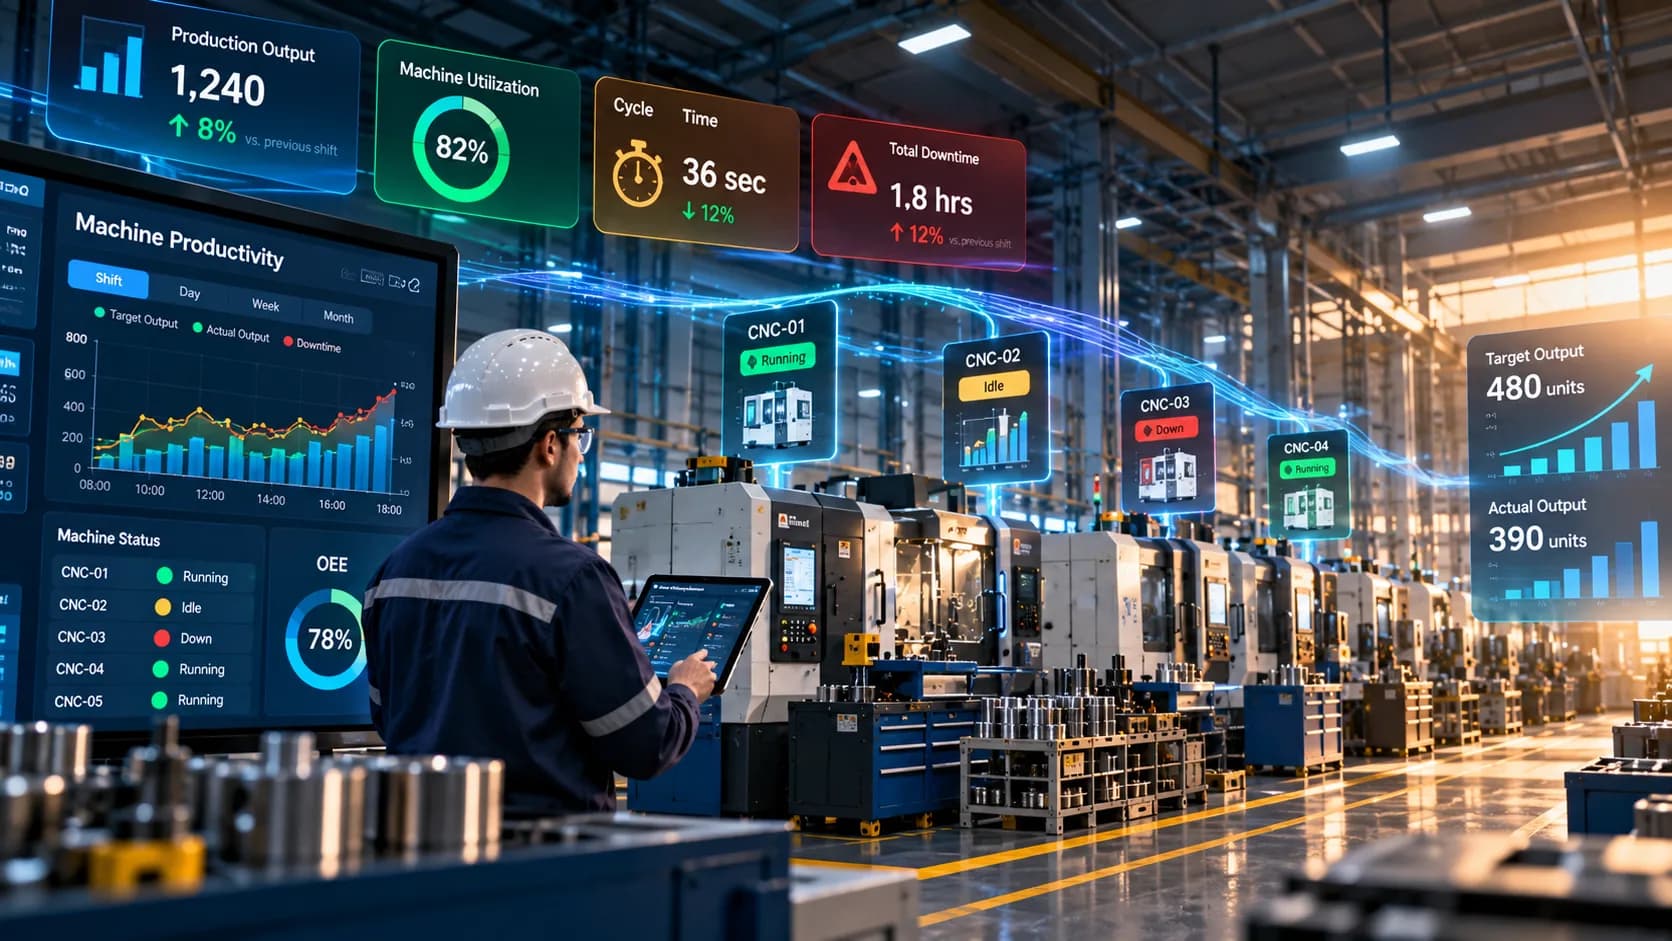
Depending on the connected data sources, supervisors may see machine status, production counts, active stoppages, and production progress.
This helps teams respond to significant interruptions while the production shift is still underway.
Production Output Tracking
Production output tracking measures how many units, parts, or batches have been completed during a defined period.
Output can be tracked by machine, production line, shift, product, or production order.
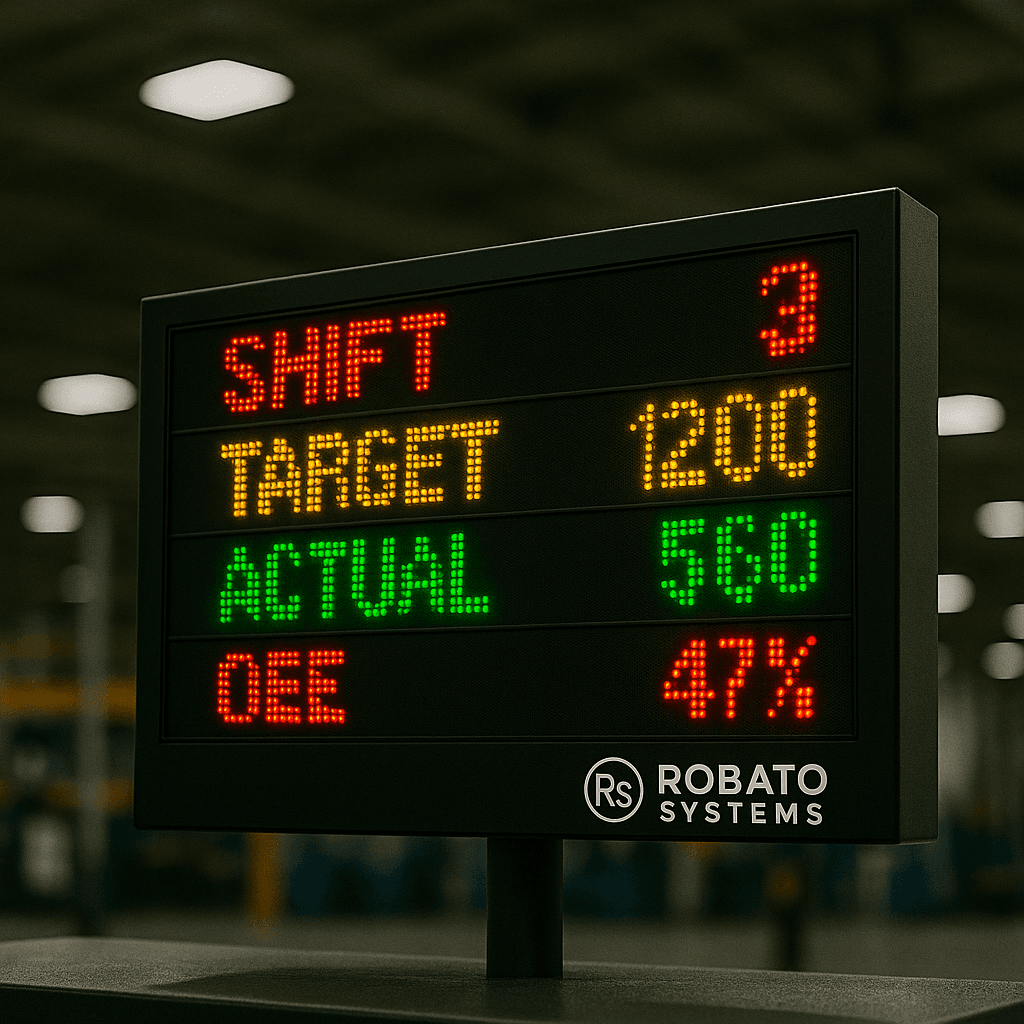
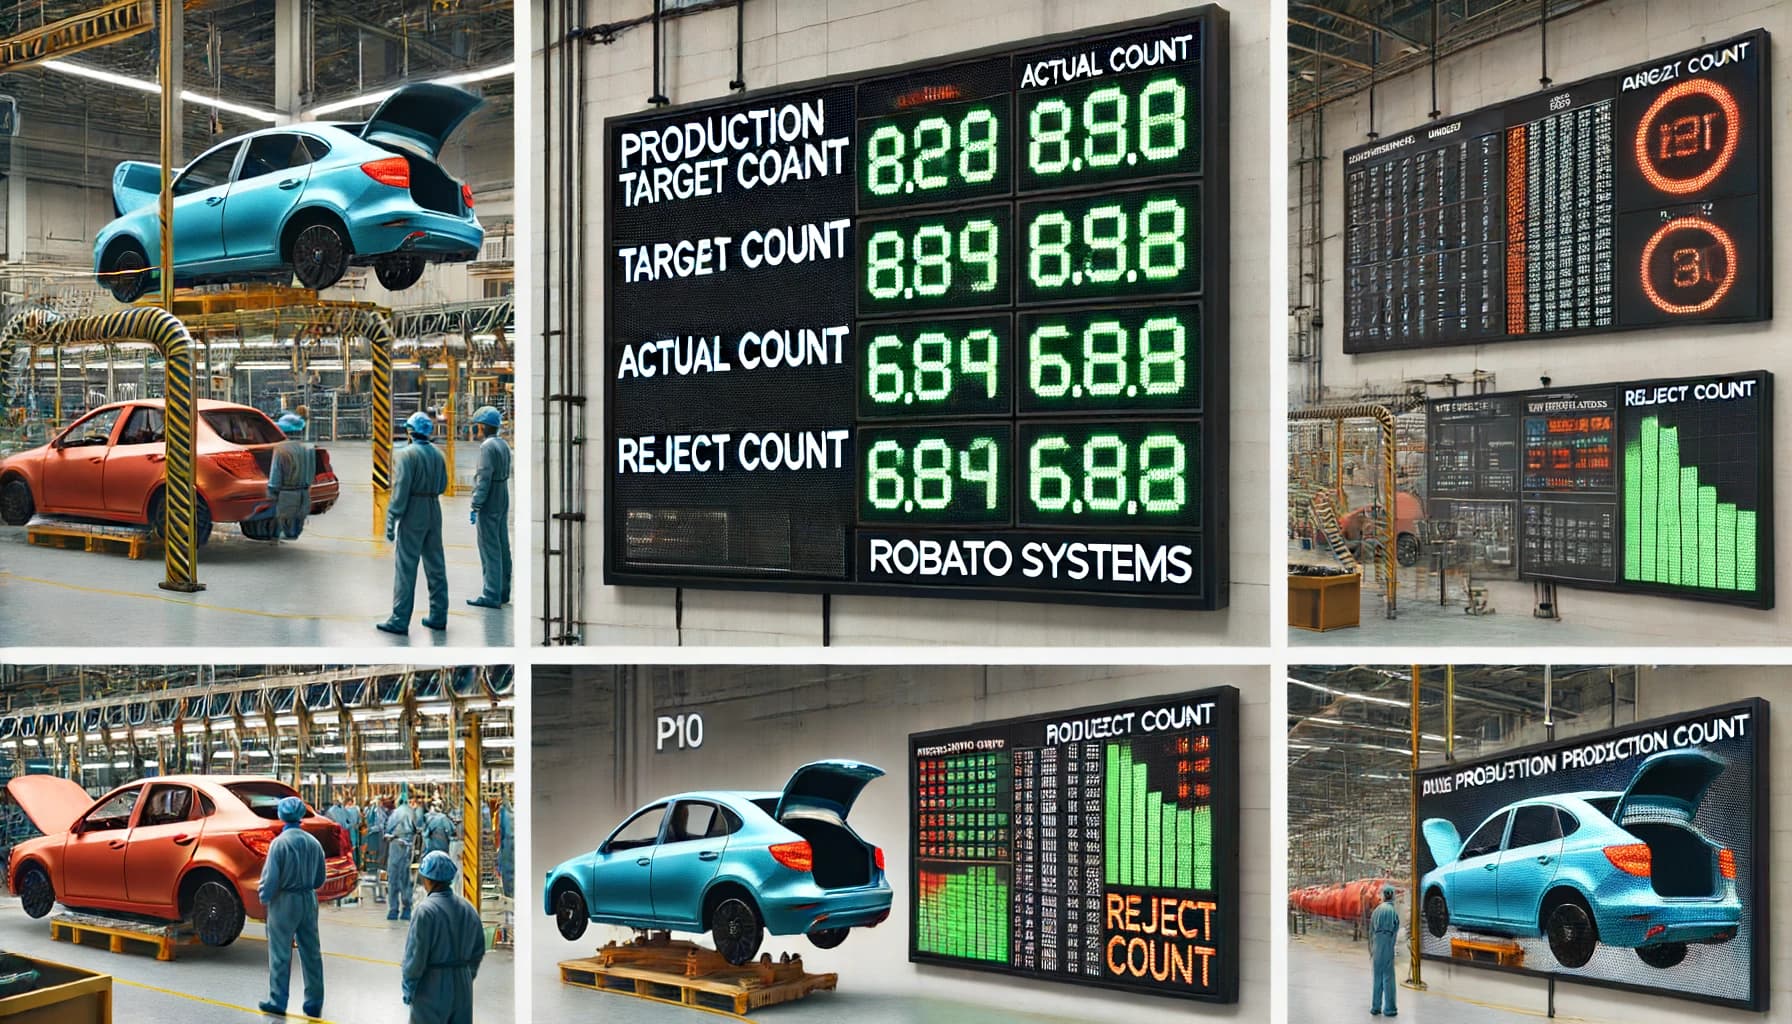
Planned vs. Actual Production
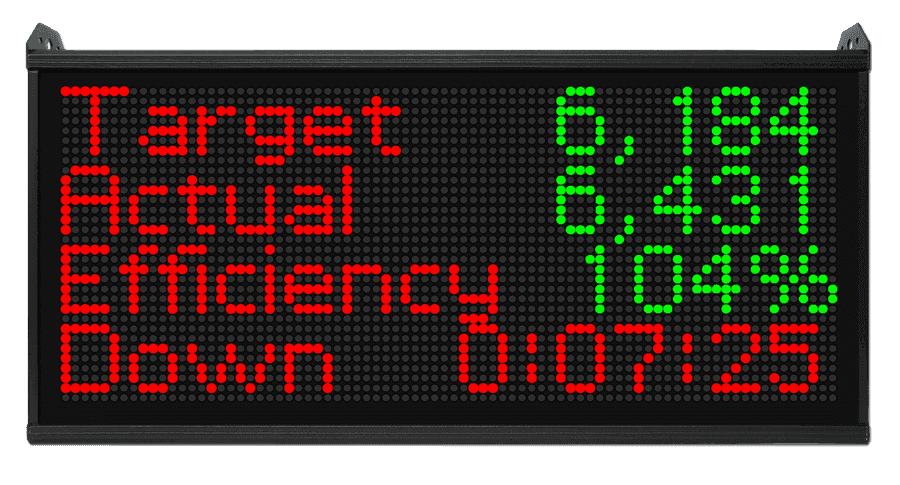
Comparing planned output with actual output helps teams identify production gaps.
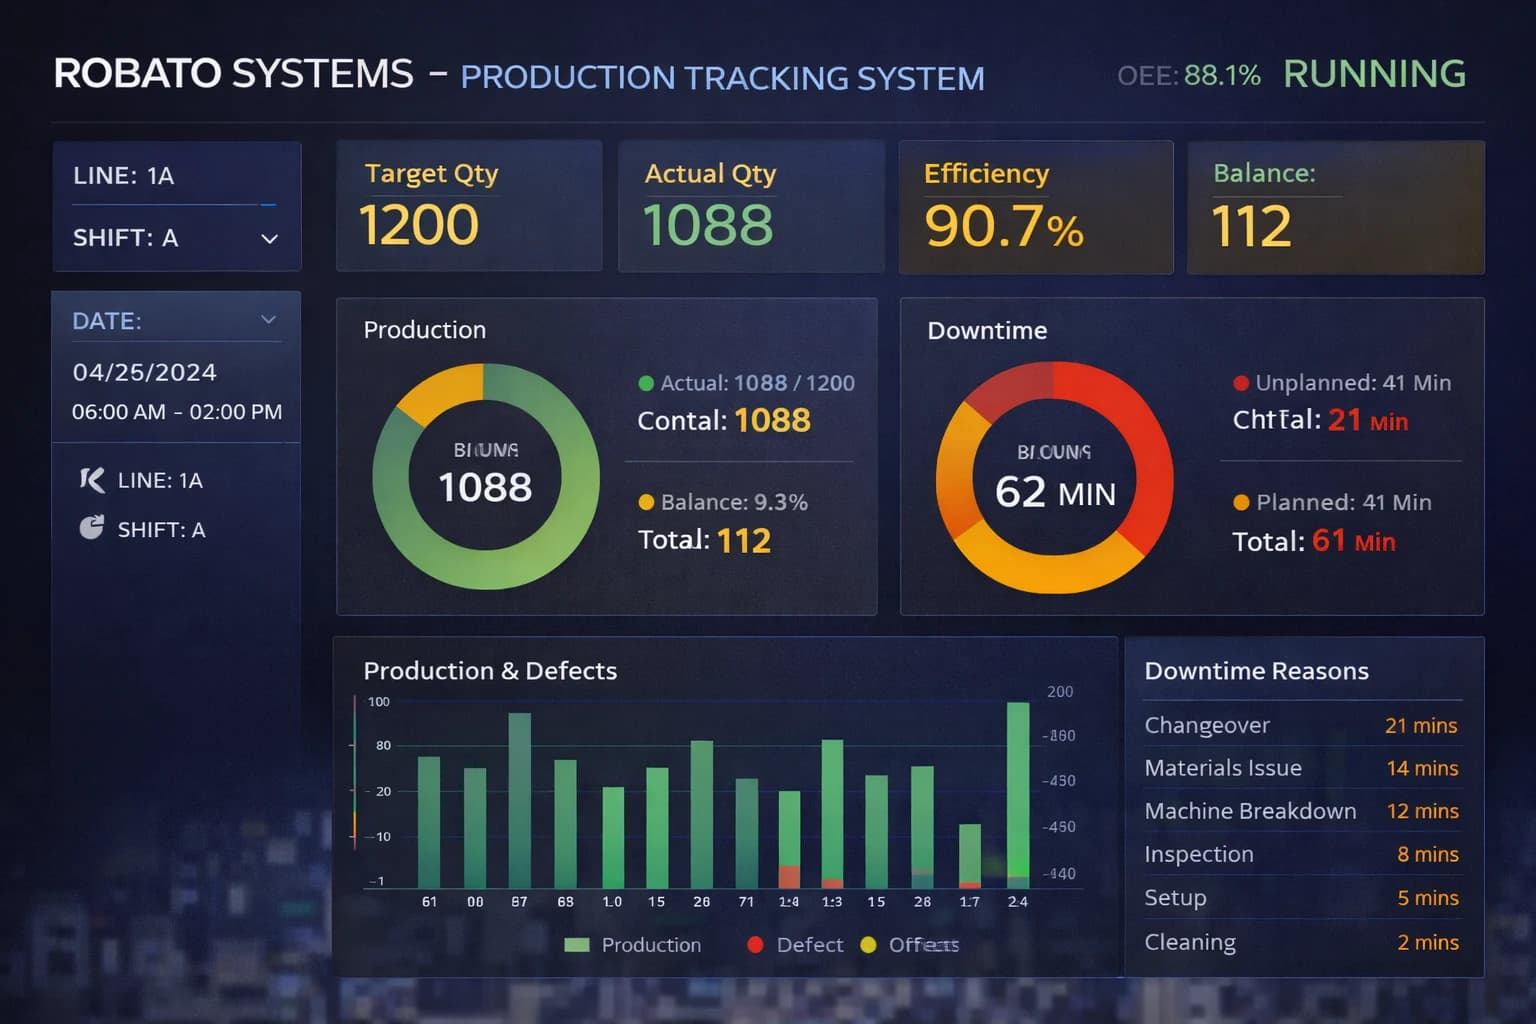
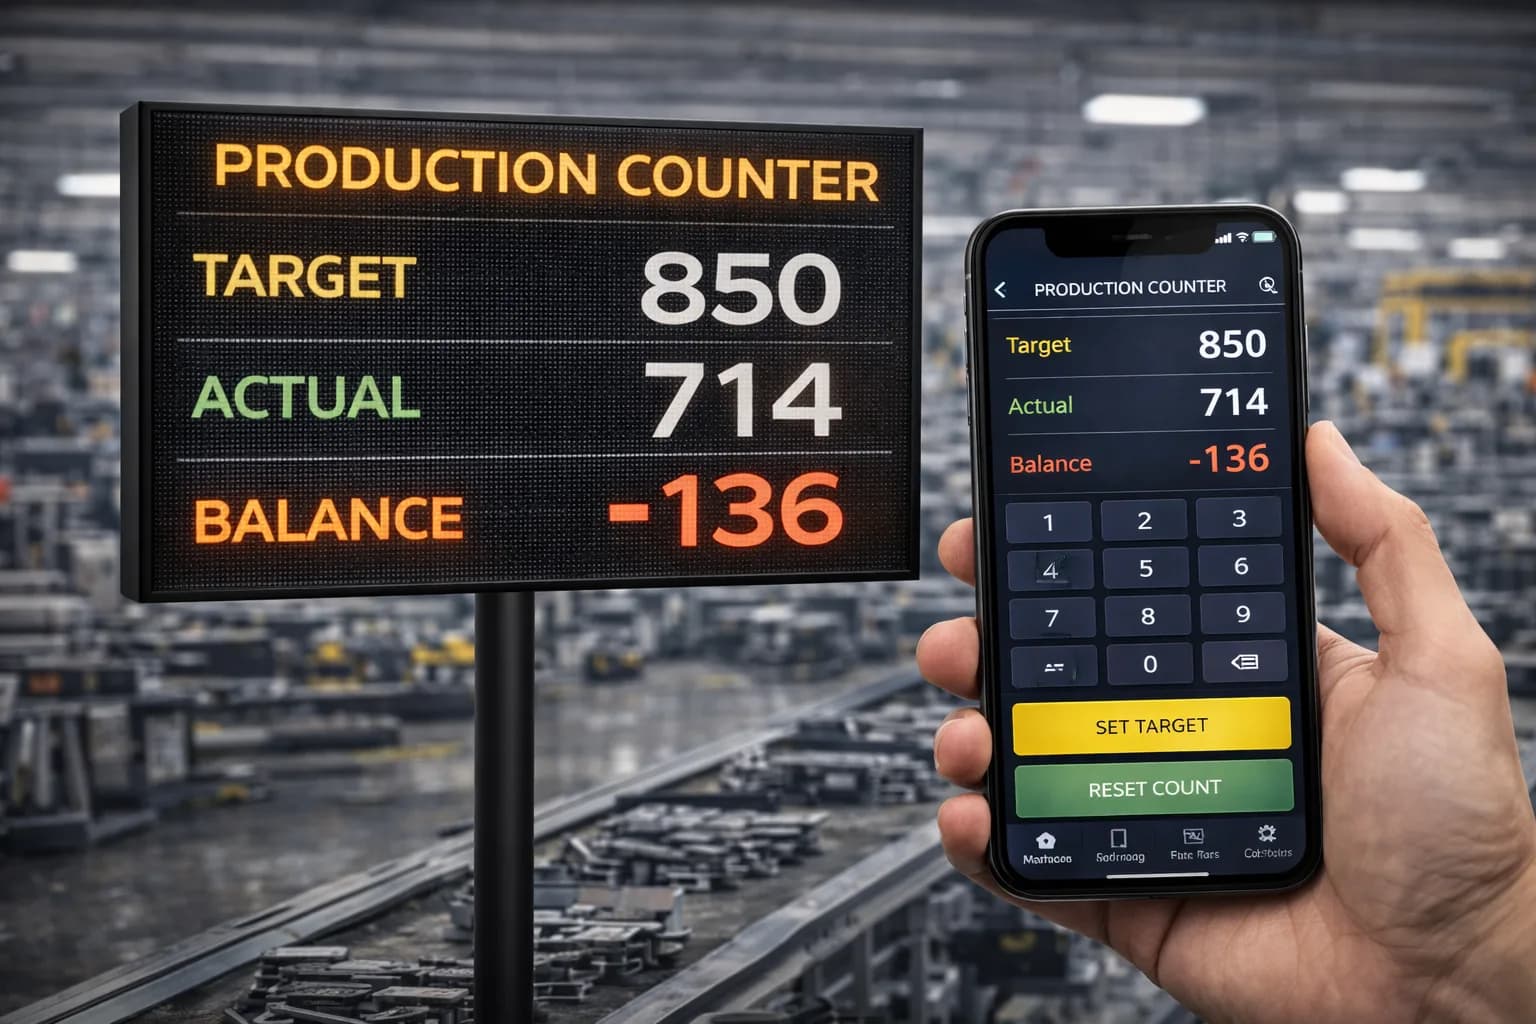
For example, if a line is expected to produce 1,200 units but completes 1,050, the system can highlight the difference for further investigation.
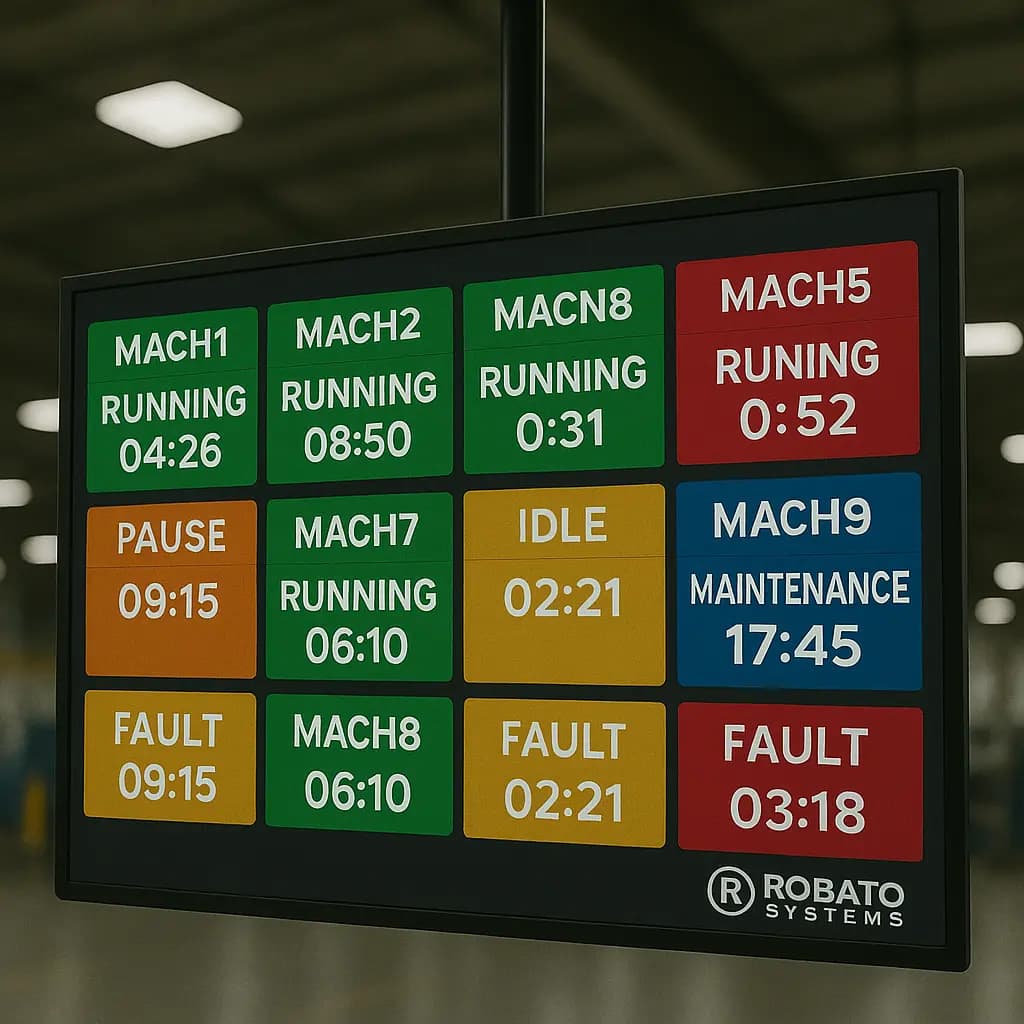
Machine Status Monitoring
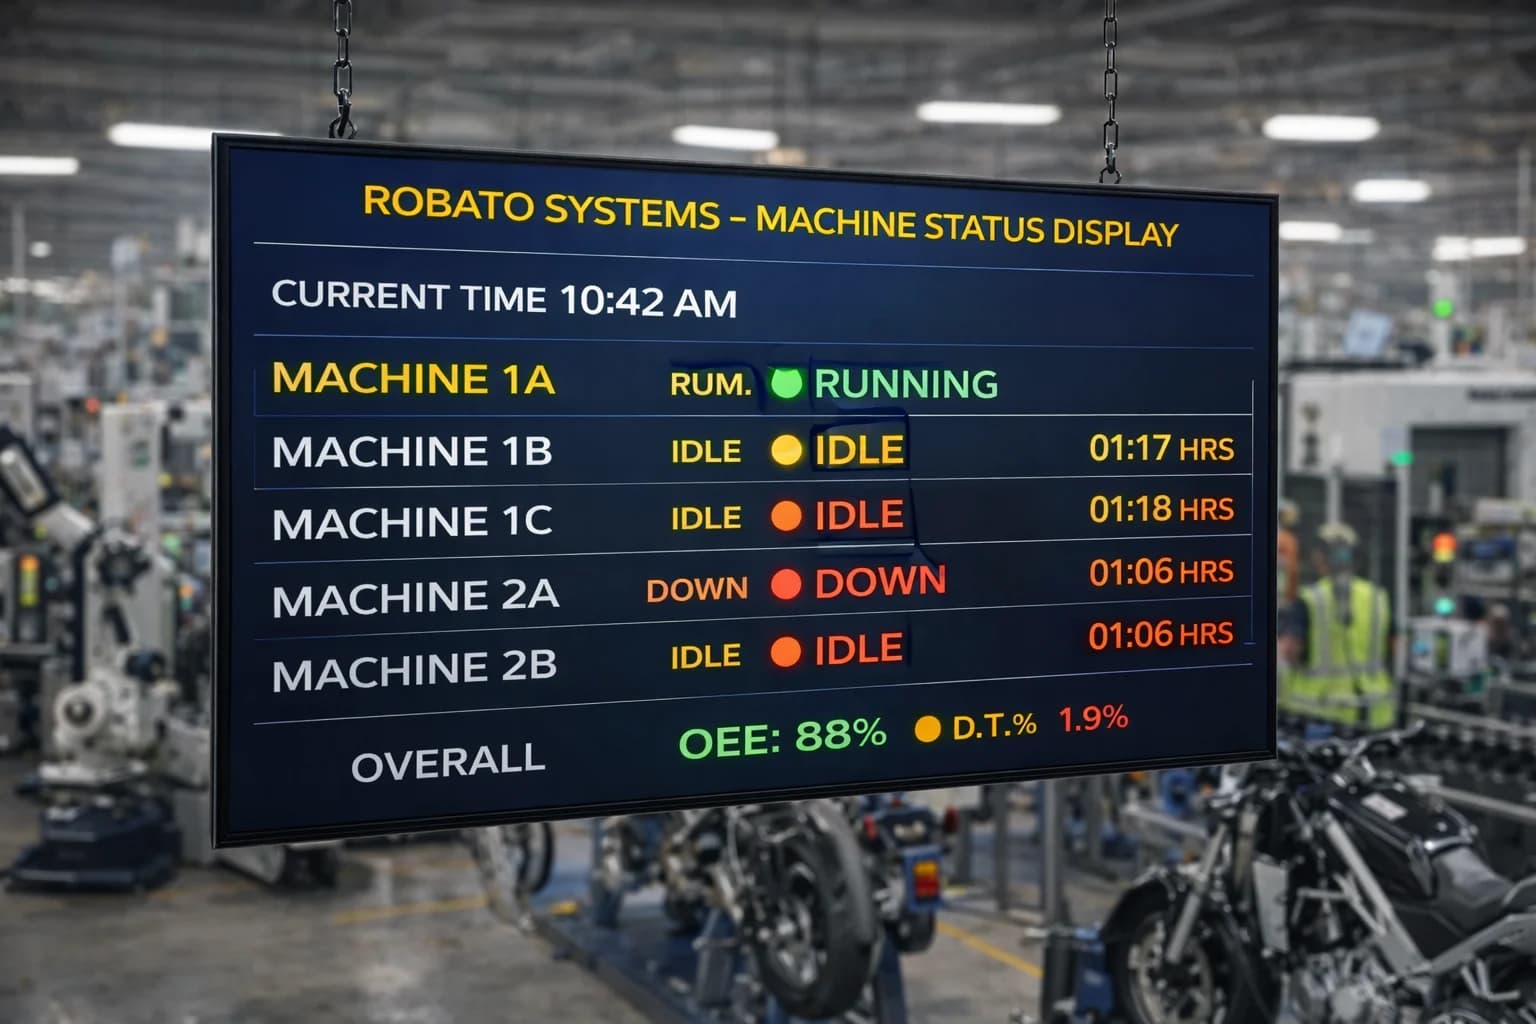
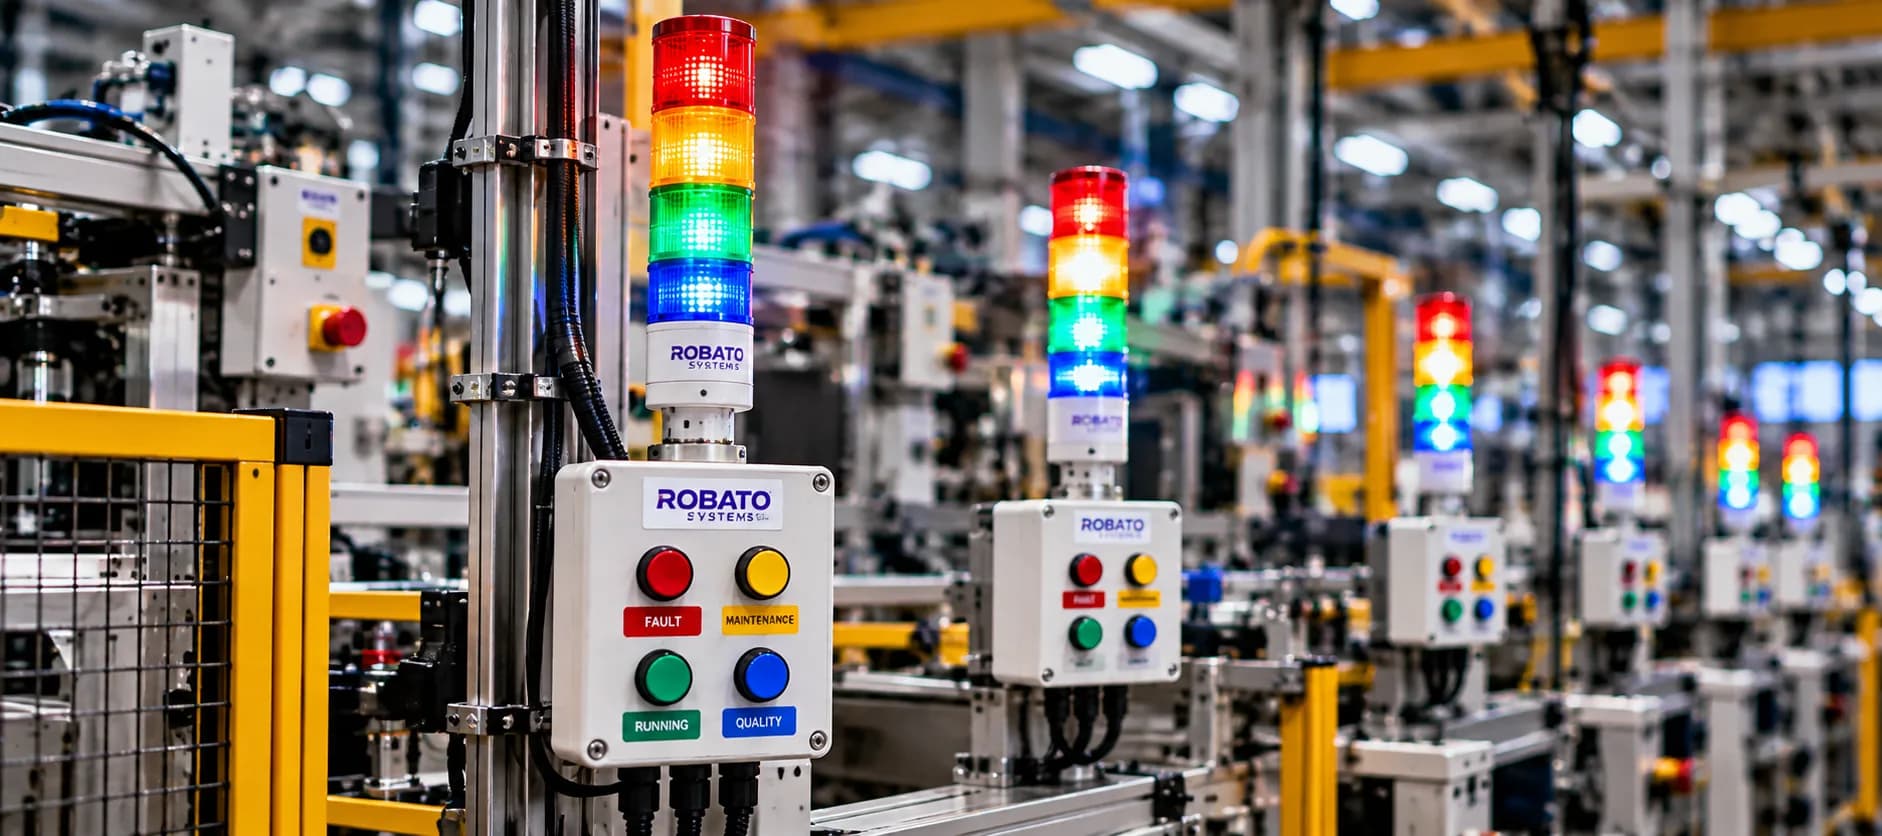
Machine status information provides visibility into running, idle, stopped, or fault conditions where the relevant signals are available.
This helps supervisors understand equipment conditions that may be affecting production.
Downtime Analysis
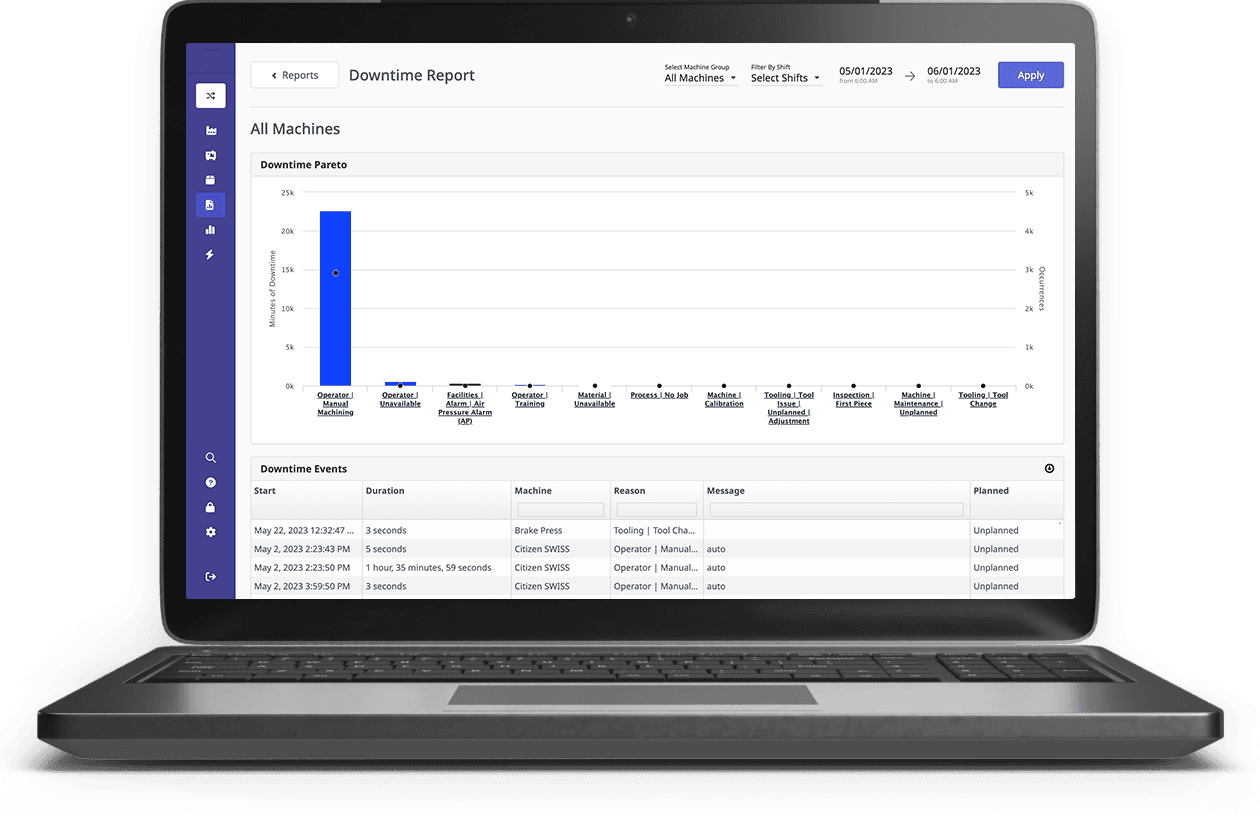
Downtime monitoring records when production equipment stops and, where possible, classifies the reasons.
This allows teams to distinguish between equipment failures, material shortages, changeovers, and other causes of lost production time.
Shift-Wise Reporting
Shift-level reports help manufacturers compare production results, machine usage, and downtime across different operating periods.
Comparisons should account for differences in planned workload, product mix, staffing, and production conditions.
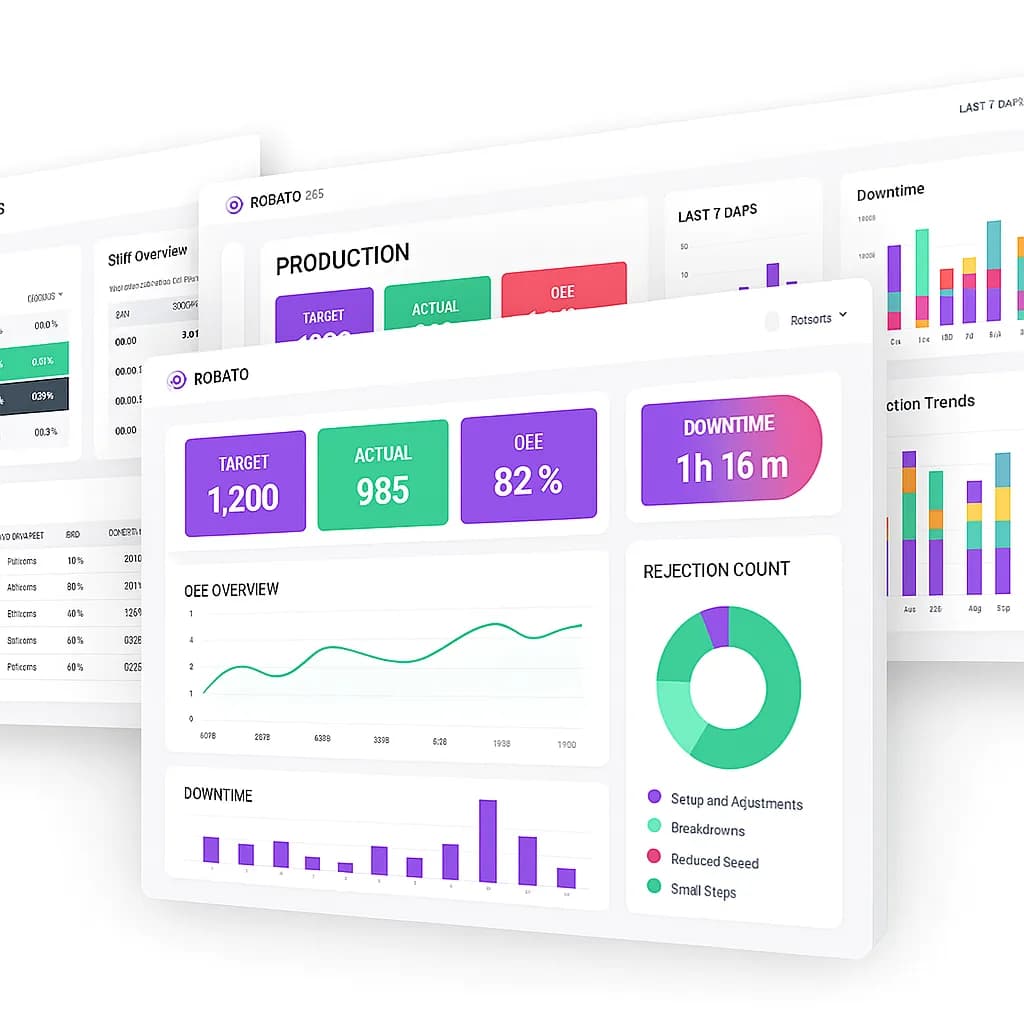
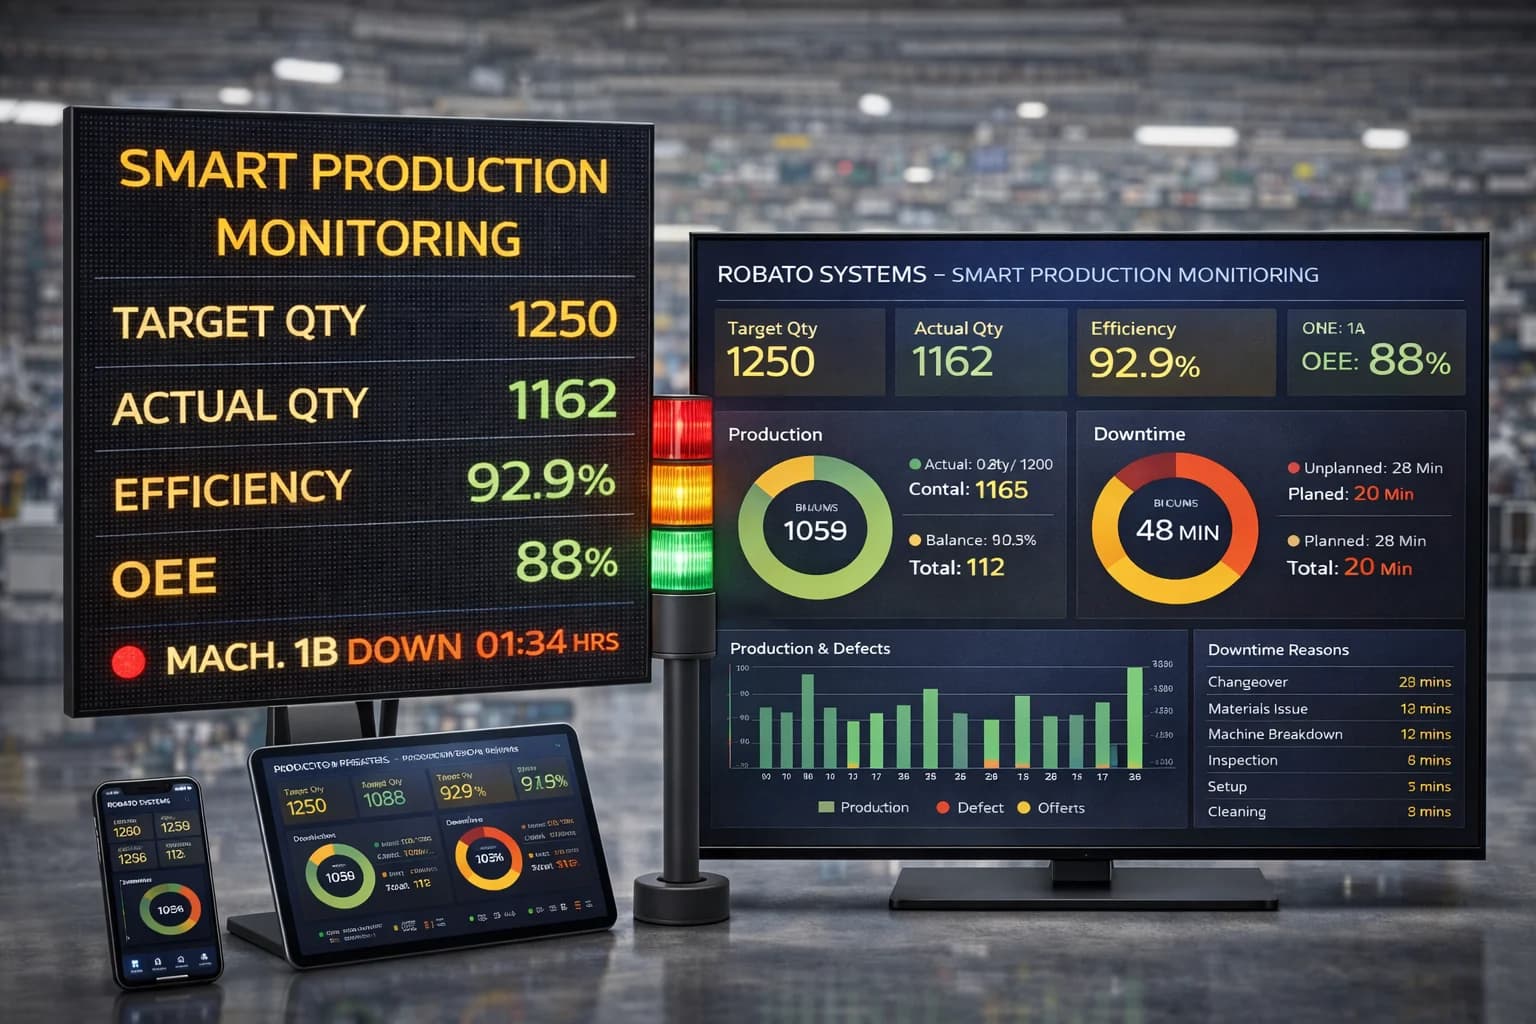
Production Dashboards
Centralized dashboards present key information in an accessible format.
They can provide an overview for management while allowing supervisors to examine machine-level and line-level details.
Historical Reporting
Historical reports help identify recurring issues and long-term production trends.
These insights support capacity planning, continuous improvement, and evaluation of operational changes.
Alerts and Notifications
Some monitoring platforms can notify responsible personnel when predefined conditions occur, such as an extended machine stop or a production target falling behind schedule.
Alerts should be configured around meaningful operational thresholds.
Important KPIs for Factory Productivity Monitoring
A monitoring system should measure the indicators that help the organization understand and improve production performance.
1. Production Output
Production output represents the quantity produced during a selected period.
It can be measured hourly, by shift, daily, weekly, or by production order.
2. Production Rate
Production rate measures output over a defined period.
Production Rate = Units Produced ÷ Operating Time
For example, if a machine produces 600 units during 10 hours of operating time, its average production rate is 60 units per operating hour.
This calculation should be interpreted carefully when production conditions or product types differ.
3. Target Achievement
Target achievement compares actual output with planned output.
Target Achievement (%) = Actual Output ÷ Planned Output × 100
If the production target is 1,000 units and actual output is 900 units, target achievement is 90%.
4. Machine Utilization
Machine utilization indicates how much of the defined available production time equipment is operating.
A commonly used formula is:
Machine Utilization (%) = Operating Time ÷ Available Production Time × 100
The calculation should use a consistent definition of available production time.
5. Downtime
Downtime measures periods when equipment is stopped or unavailable according to the factory's reporting rules.
Tracking downtime by reason can help identify the most significant sources of production loss.
6. Cycle Time
Cycle time measures how long a machine or process takes to complete a production cycle.
Comparing actual cycle time with the expected standard can reveal production performance losses.
7. First-Pass Yield
First-pass yield measures the proportion of units that pass through a process successfully without requiring rework.
First-Pass Yield (%) = Good Units Without Rework ÷ Total Units Processed × 100
This metric helps ensure that productivity analysis accounts for quality rather than focusing only on total output.
8. Overall Equipment Effectiveness
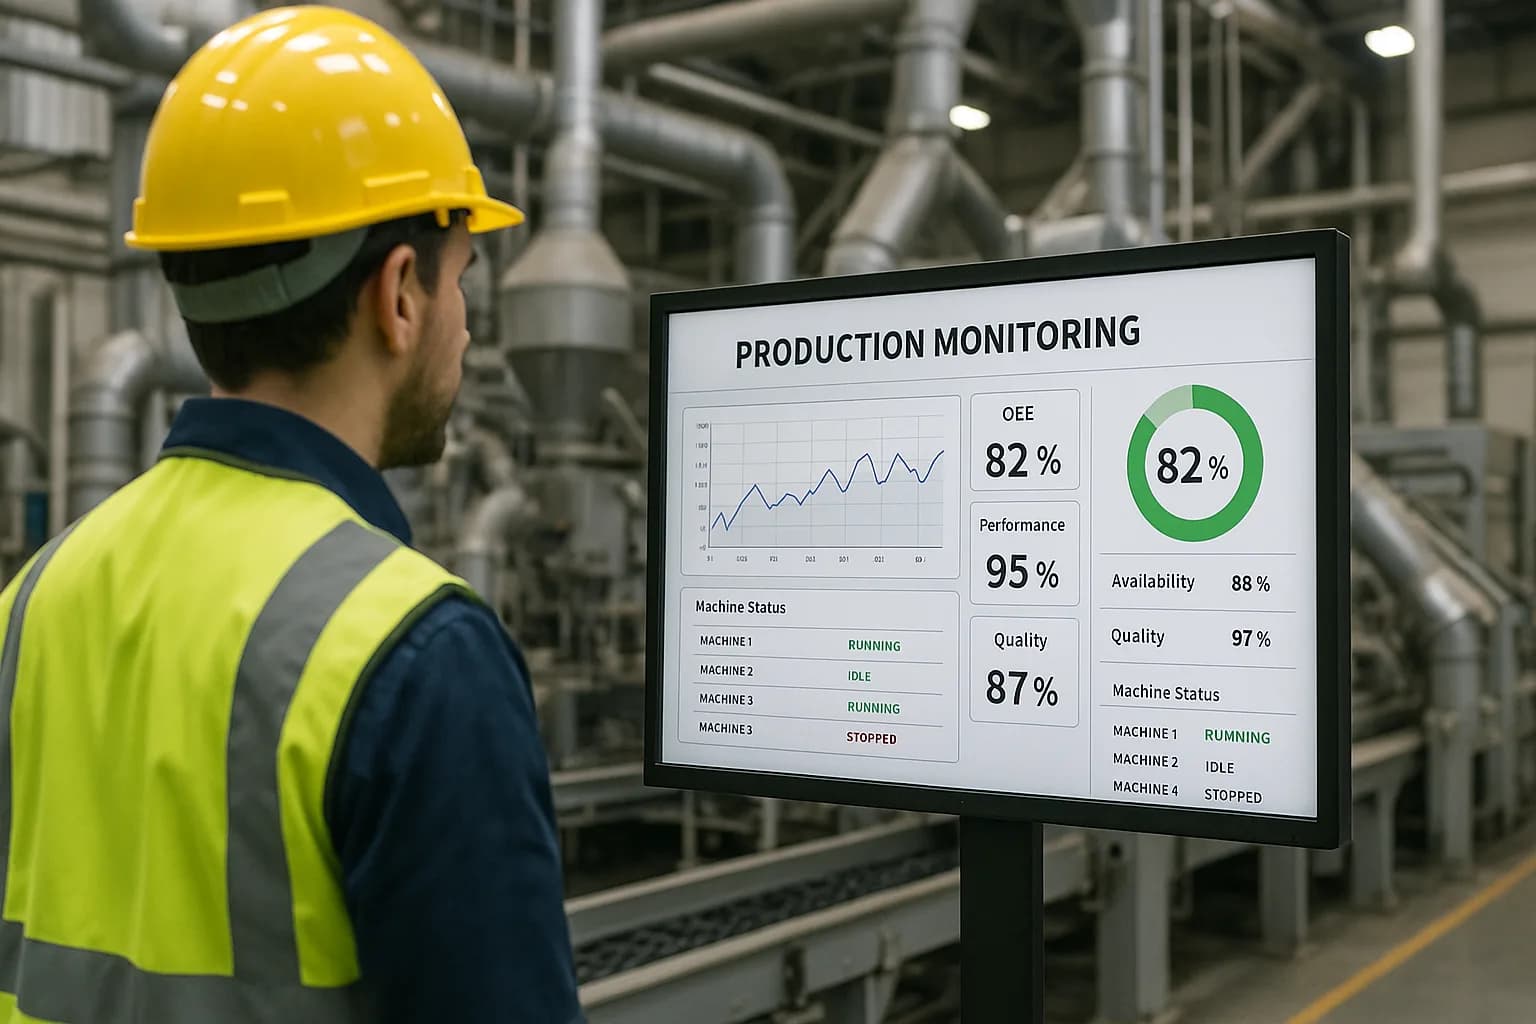
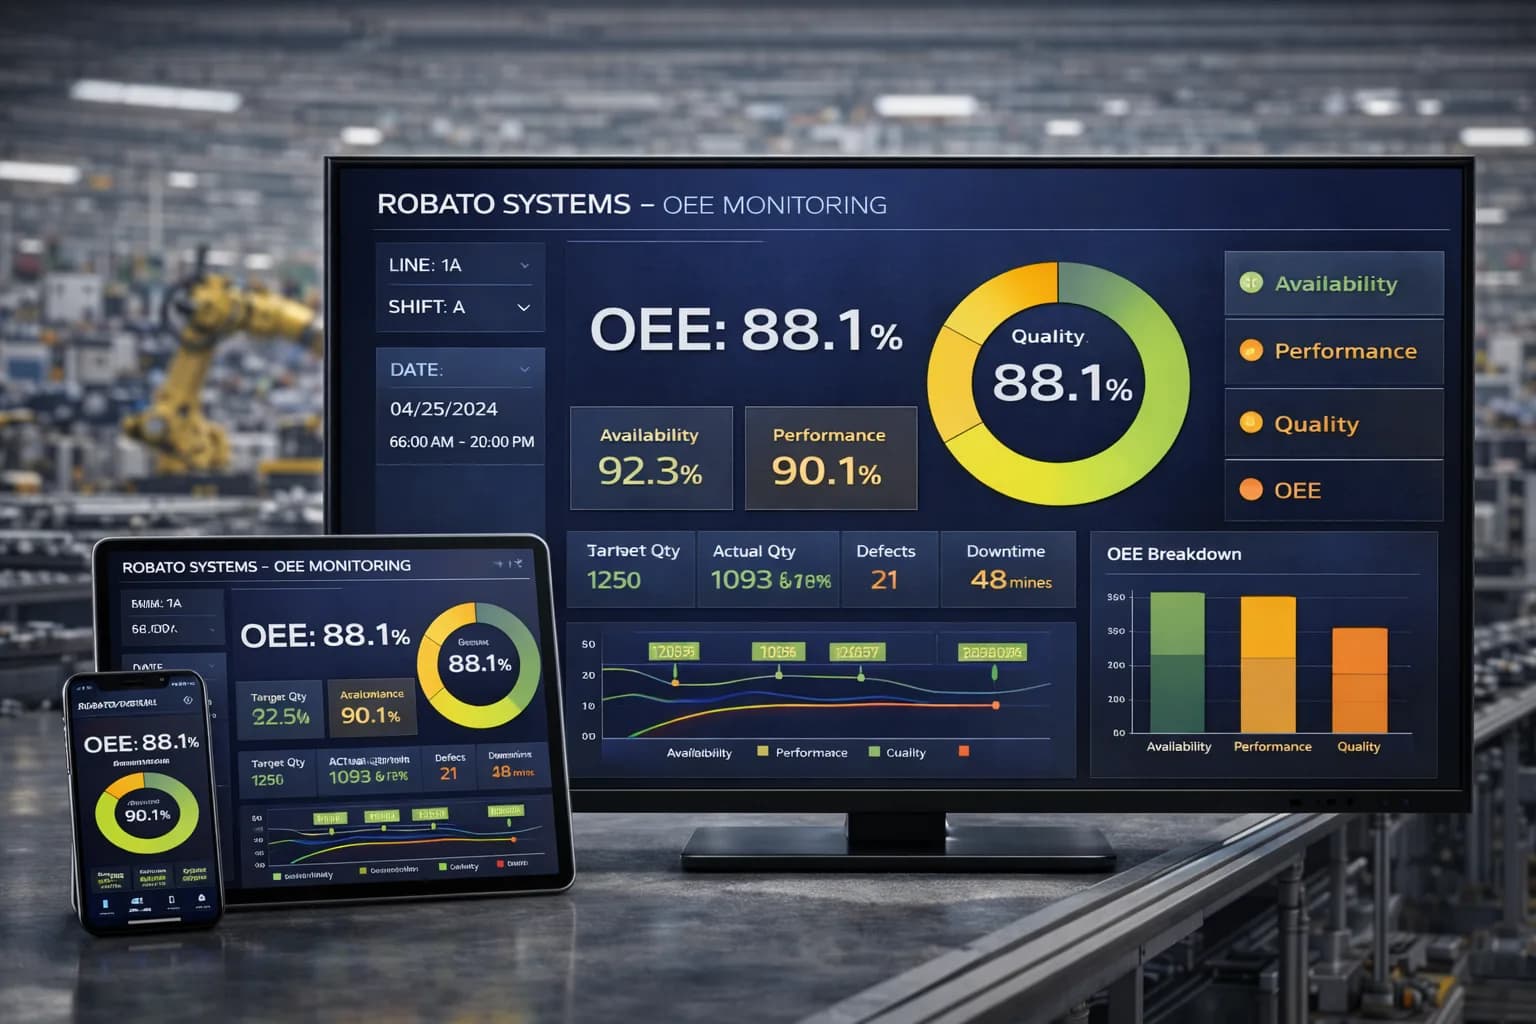
Overall Equipment Effectiveness, or OEE, combines availability, performance, and quality into one equipment effectiveness measure.
OEE = Availability × Performance × Quality
The three components are normally expressed as percentages or decimal values consistently.
OEE is useful for understanding equipment losses, but it does not replace every factory-level productivity metric.
Factory Productivity Monitoring vs. Machine Productivity Monitoring
The two approaches are closely related, but they operate at different levels.
| Factory Productivity Monitoring | Machine Productivity Monitoring |
|---|---|
| Focuses on factory-wide performance | Focuses on individual machine performance |
| Production-line output | Machine output |
| Overall production target achievement | Machine-level target achievement |
| Workflow and bottlenecks | Cycle time and machine interruptions |
| Shift and factory comparisons | Machine-level runtime and output |
| Cross-department coordination | Equipment-level operational analysis |
Factory productivity monitoring can combine information from machine-level monitoring systems to provide a broader view of manufacturing operations.
This is particularly useful when production results depend on several interconnected machines or processes.
Benefits of Factory Productivity Monitoring
1. Improved Production Visibility
Centralized monitoring helps managers understand current production conditions without relying entirely on separate manual reports.
2. Faster Identification of Bottlenecks
Production data can reveal where output is being constrained and where further investigation is needed.
3. Better Production Planning
Historical performance information can support more realistic production targets and capacity planning.
4. Reduced Reporting Effort
Automated data collection and reporting can reduce the time required to compile production information manually.
5. Improved Shift Coordination
Shared production information helps teams communicate about current status, unresolved issues, and production priorities.
6. More Effective Resource Utilization
Understanding machine usage, output, and delays can help manufacturers investigate how existing production resources are being used.
7. Better Performance Measurement
Consistent KPIs allow organizations to evaluate whether production improvements are delivering measurable results.
8. Stronger Continuous Improvement
Historical data provides a baseline against which corrective actions and process changes can be evaluated.
How to Implement Factory Productivity Monitoring
A structured implementation approach helps manufacturers avoid collecting large amounts of data without a clear operational purpose.
Step 1: Define Business Objectives
Identify the problems the monitoring system should help solve.
Examples include:
Improving production target achievement
Reducing avoidable downtime
Increasing production visibility
Identifying bottlenecks
Improving shift reporting
Understanding equipment utilization
Step 2: Map the Production Process
Document the production flow, key machines, workstations, material movements, and dependencies between processes.
This helps identify where monitoring will provide the greatest value.
Step 3: Identify Available Data Sources
Review existing PLCs, controllers, sensors, machine counters, production systems, and reporting tools.
Determine what information is already available and where additional data collection may be required.
Step 4: Define KPIs and Calculations
Establish consistent definitions for production output, downtime, utilization, target achievement, cycle time, and other required metrics.
Different departments should use the same calculation rules when comparing results.
Step 5: Establish Machine Connectivity
Connect the required equipment and data sources to the monitoring platform.
Legacy equipment may need additional sensors, interfaces, or industrial gateways.
Step 6: Configure Dashboards
Build dashboards around the information needed by operators, supervisors, production managers, and plant management.
Avoid overwhelming users with metrics that do not support their decisions.
Step 7: Validate the Data
Compare dashboard results with actual production activity and available records.
Correct missing signals, inconsistent timestamps, or calculation errors before relying on the reports.
Step 8: Establish Performance Baselines
Collect enough historical data to understand normal production patterns.
Use these baselines when setting improvement targets.
Step 9: Train the Team
Ensure that users understand the metrics, machine states, reporting rules, and procedures for investigating production problems.
Step 10: Review and Improve
Review performance regularly, investigate significant deviations, and measure the effect of corrective actions.
Common Challenges in Factory Productivity Monitoring
Inconsistent Data Sources
Factories may use equipment from multiple manufacturers, with different communication methods and signal definitions.
Integration and standardization are therefore important.
Legacy Machinery
Older equipment may not expose the information required for automated monitoring.
Additional sensors or connectivity hardware may be necessary.
Inaccurate Production Targets
Targets that do not account for product type, changeovers, planned maintenance, or operating conditions can produce misleading comparisons.
Poor Machine-State Definitions
If running, idle, stopped, and fault conditions are not defined consistently, production reports may be inaccurate.
Limited Root-Cause Information
Monitoring may identify that production fell behind target without automatically explaining why.
Additional downtime reason codes, material data, operator inputs, or maintenance information may be needed.
Information Overload
Collecting every available signal can make dashboards complicated and reduce their practical value.
Focus on metrics that help teams make decisions.
Low User Adoption
Monitoring systems are more effective when operators and managers understand how to interpret the data and use it in their daily work.
Best Practices for Factory Productivity Monitoring
Start with clear objectives. Identify the operational decisions the monitoring system needs to support.
Use consistent KPI definitions. Standardize formulas and reporting rules across departments and production lines.
Combine factory-level and machine-level information. Factory-wide output should be analyzed alongside machine activity where possible.
Separate planned and unplanned losses. This helps distinguish expected production interruptions from problems requiring corrective action.
Include quality metrics. High output alone does not indicate good productivity if a large proportion of products require rework or are rejected.
Make dashboards actionable. Highlight significant deviations and provide access to the details needed for investigation.
Validate machine data regularly. Check the accuracy of signals, counters, timestamps, and calculations.
Review historical trends. Use consistent reporting periods to identify recurring patterns.
Assign responsibility for corrective actions. Ensure that production issues identified by monitoring are investigated by the appropriate teams.
Measure results after changes. Compare performance with the baseline to determine whether improvement initiatives are effective.
Choosing Factory Productivity Monitoring Software
When evaluating a monitoring solution, manufacturers should consider how well it fits their production environment.
Machine Connectivity
Check compatibility with the factory's equipment, controllers, sensors, and communication interfaces.
Dashboard Flexibility
Look for configurable views that support machine-level, production-line-level, and factory-level reporting.
Reporting Capabilities
The system should support the production reports, historical analysis, and shift comparisons required by the business.
Integration Options
Consider whether the platform can connect with MES, ERP, quality, maintenance, or other manufacturing systems.
Scalability
The architecture should support additional machines, production lines, or facilities as operational requirements grow.
Data Reliability
The platform should provide appropriate mechanisms for validating machine states, handling missing data, and maintaining consistent calculations.
Security
Consider authentication, role-based access, network protection, and the security requirements of the factory's operational technology environment.
Ease of Use
Operators and managers should be able to understand the information without unnecessary complexity.
The right solution depends on the factory's size, equipment, production processes, data requirements, and improvement objectives.
Frequently Asked Questions
What is factory productivity monitoring?
Factory productivity monitoring is the process of collecting and analyzing production and operational data to understand how effectively a manufacturing facility uses its resources and achieves its production targets.
Why is factory productivity monitoring important?
It helps manufacturers improve production visibility, identify bottlenecks, compare actual output with targets, understand operational losses, and make better-informed production decisions.
What KPIs should a factory productivity monitoring system track?
Common KPIs include production output, target achievement, production rate, cycle time, machine utilization, downtime, first-pass yield, and OEE where appropriate.
Can factory productivity monitoring work with existing machines?
Yes. Depending on the equipment, data can be collected through PLCs, machine controllers, sensors, counters, industrial gateways, or existing production systems. Legacy machines may require additional connectivity hardware.
What is the difference between factory productivity and machine productivity?
Machine productivity focuses on the output and performance of individual equipment. Factory productivity considers the wider production process, including multiple machines, production lines, workflows, and resource coordination.
Can factory productivity monitoring reduce production delays?
Monitoring helps identify when and where delays occur. Reducing those delays requires investigating their causes and implementing appropriate operational improvements.
Is real-time monitoring necessary?
Not every factory requires real-time monitoring for every metric. Real-time or near-real-time information is useful for responding to current problems, while historical reporting supports trend analysis and long-term improvement.
Can factory productivity monitoring improve production planning?
Yes. Historical output, cycle time, downtime, and utilization data can help planners understand actual production capabilities and develop more realistic schedules.
Does factory productivity monitoring replace production managers?
No. Monitoring provides data and visibility. Production managers remain responsible for interpreting the information, coordinating teams, making decisions, and implementing improvements.
Conclusion
Factory productivity monitoring helps manufacturers build a clearer and more consistent understanding of production performance.
By combining production output, machine activity, downtime, cycle time, utilization, quality information, and shift-level reporting, organizations can identify operational constraints and investigate why production results differ from expectations.
The most effective monitoring solutions are built around reliable data, meaningful KPIs, accessible dashboards, and a defined process for acting on the information.
For manufacturers looking to improve production visibility and make better use of existing resources, factory productivity monitoring provides a practical foundation for data-driven operational improvement.
The objective is not simply to measure how much a factory produces. It is to understand the conditions that influence production results and use that understanding to make manufacturing operations more consistent, predictable, and effective.
Suggested CTA: Explore machine efficiency software to gain better visibility into factory operations, monitor equipment performance, and support data-driven production improvement.