Introduction
Manufacturing companies invest heavily in machinery and production equipment, but owning capable equipment does not automatically mean that its available capacity is being used effectively.
A machine can be operational yet underutilized. It can run for long periods while producing below its expected rate. It can also experience repeated short stops that are difficult to identify through manual production reports.
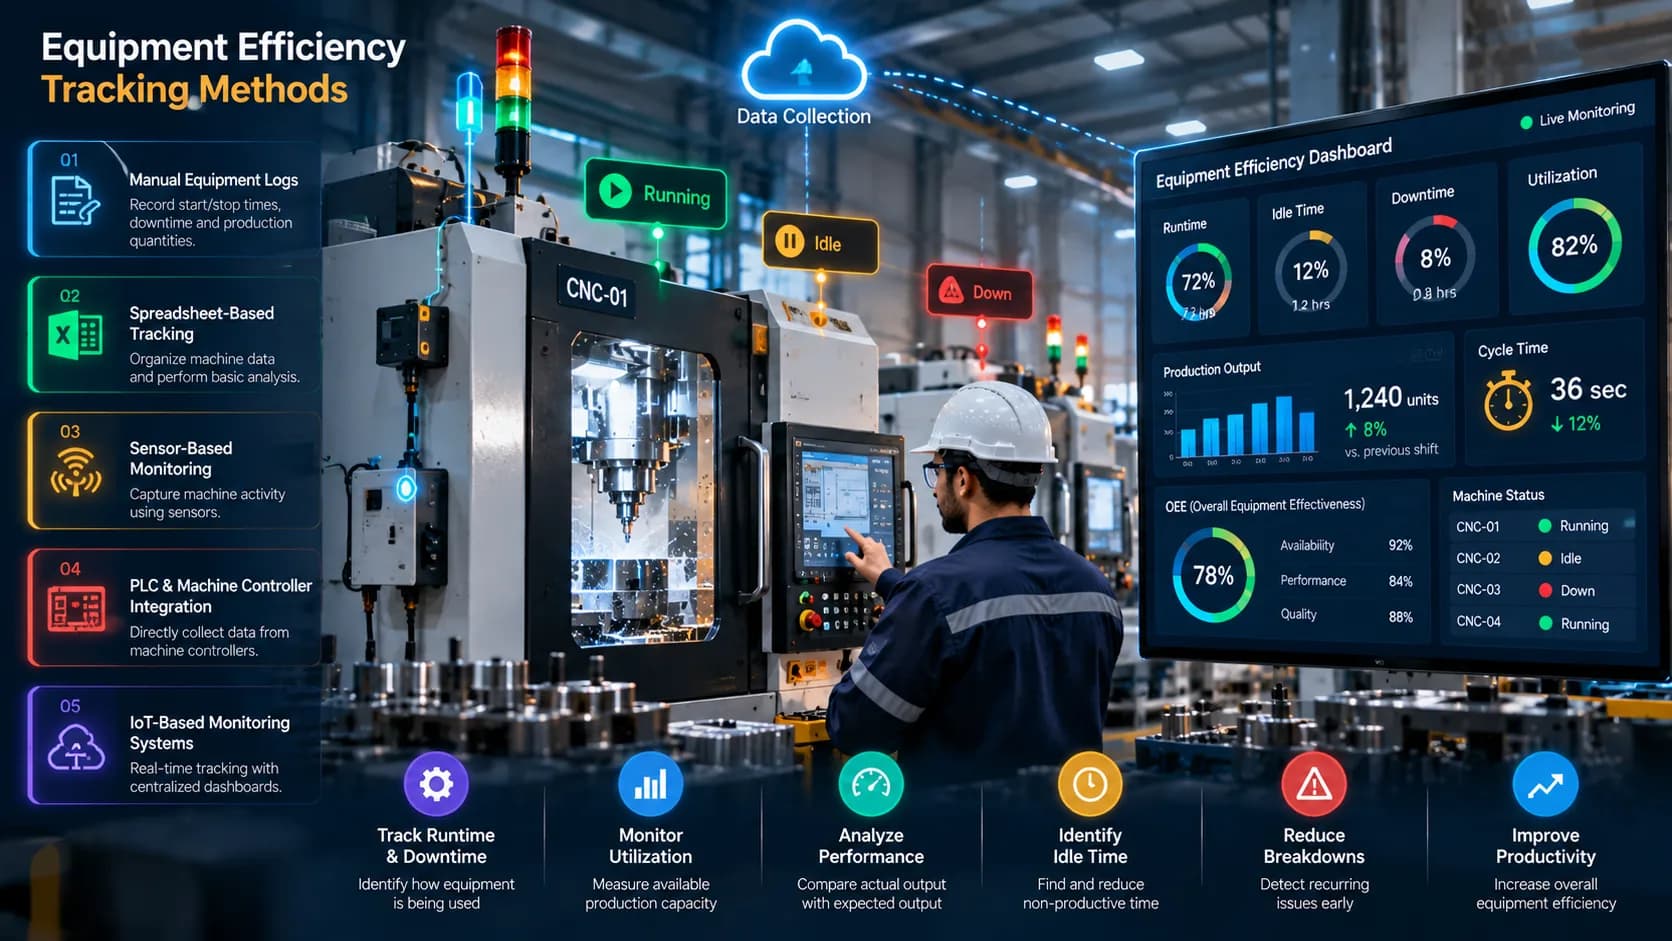
Equipment Efficiency Tracking provides a structured approach to measuring how effectively industrial equipment is being used and where production capacity may be lost.
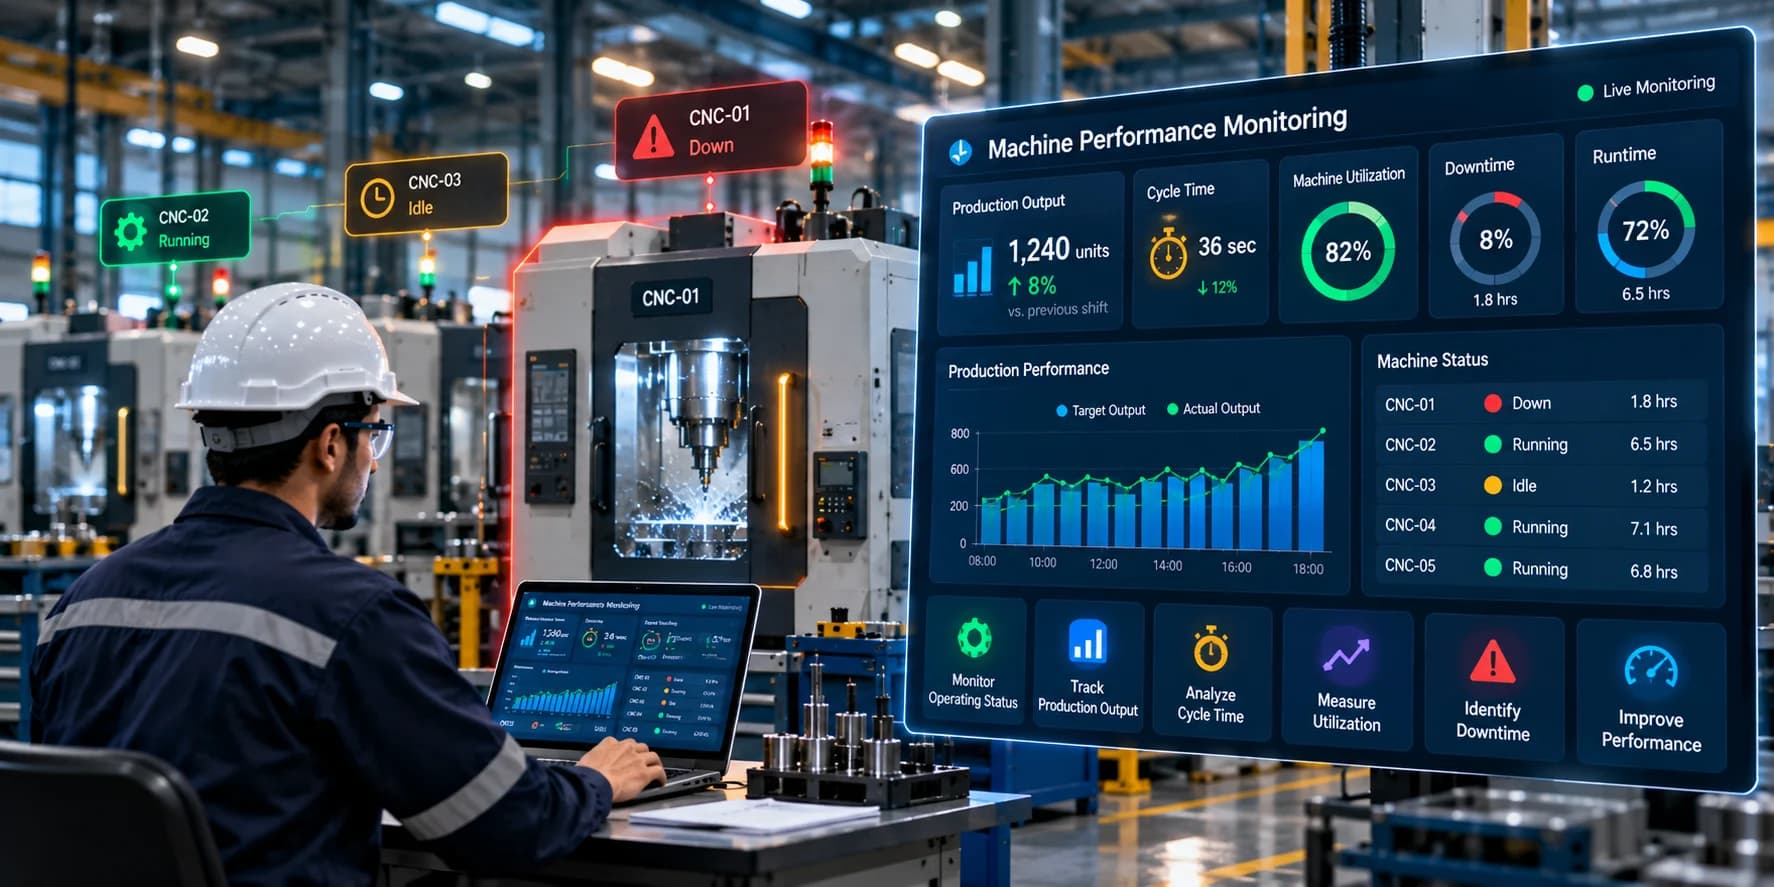
By tracking equipment runtime, downtime, utilization, production output, cycle time, availability, and other relevant indicators, manufacturers can build a clearer picture of actual equipment performance.
This guide explains the most useful equipment efficiency tracking methods, the metrics behind them, how digital monitoring improves tracking accuracy, and how manufacturers can turn equipment data into practical operational improvements.
What Is Equipment Efficiency Tracking?
Equipment efficiency tracking is the process of measuring and analyzing how effectively production equipment performs during its available operating time.
It typically involves monitoring factors such as:
Equipment runtime
Downtime
Idle time
Production output
Equipment utilization
Cycle time
Availability
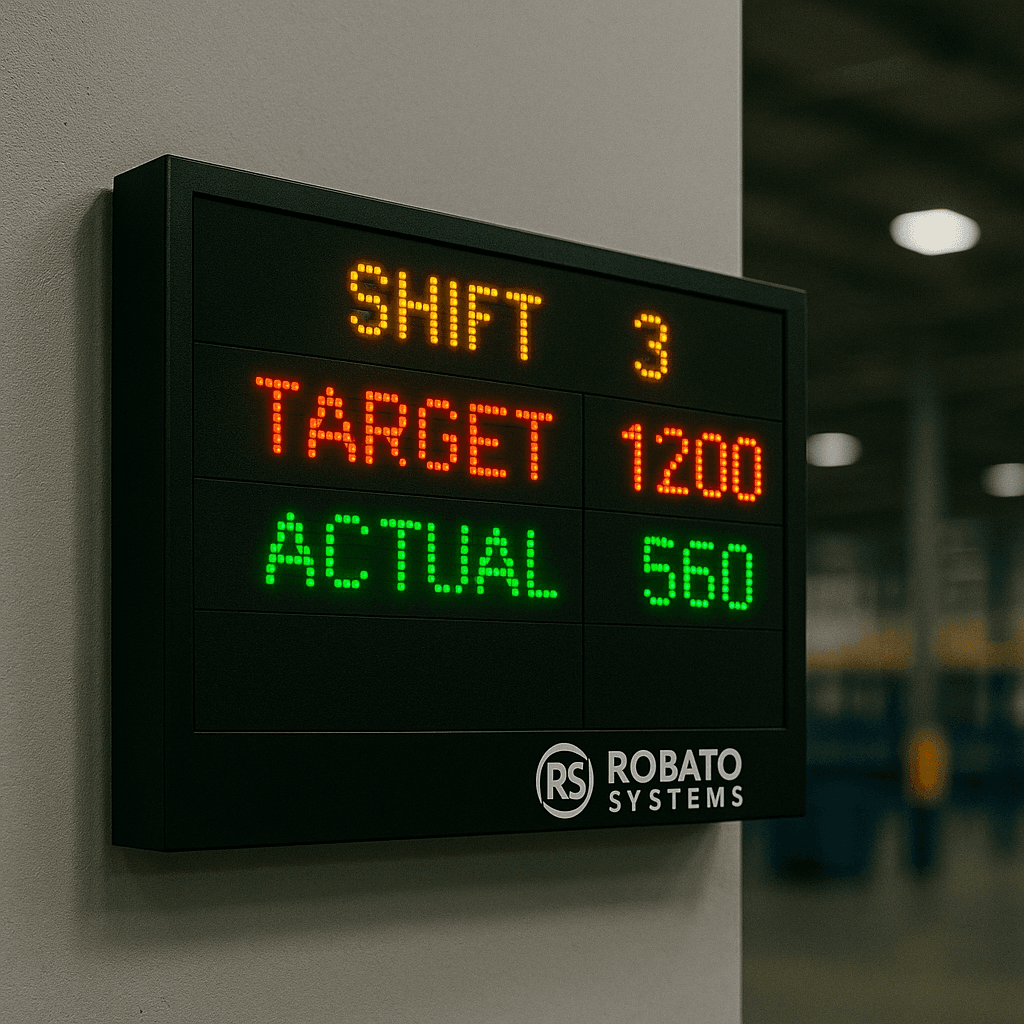
Performance against target
Maintenance-related interruptions
The objective is to compare actual equipment behavior with expected operating conditions.
For example, if a machine is scheduled to operate for 10 hours but spends two hours stopped and another hour idle, its available production capacity is not being fully utilized.
Tracking this information makes the loss visible and provides a basis for investigation.
Why Equipment Efficiency Tracking Matters
Production capacity is a valuable resource.
When equipment is underutilized or operating below expected performance, manufacturers may need additional shifts, overtime, new machinery, or other investments to compensate for lost capacity.
Before making those investments, organizations should understand how effectively their existing equipment is being used.
Equipment efficiency tracking can help answer questions such as:
Which equipment is underutilized?
Which machines experience the most downtime?
Which production lines have recurring interruptions?
How much runtime is available?
How much time is lost to idle conditions?
Is actual production meeting expected output?
Which equipment requires further investigation?
These insights can support better production planning and continuous improvement.
Key Equipment Efficiency Tracking Methods
There is no single tracking method suitable for every manufacturing environment. Different methods provide different levels of visibility.
1. Manual Equipment Logs
Manual logs are one of the simplest equipment tracking methods.
Operators or supervisors record information such as:
Start and stop times
Downtime
Production quantities
Maintenance events
Machine problems
Shift information
Advantages
Manual tracking is inexpensive and can be implemented without significant technology investment.
Limitations
It depends heavily on employee consistency and can introduce:
Delayed entries
Missing information
Incorrect timestamps
Inconsistent terminology
Limited real-time visibility
Manual logs can be useful for small operations or as a supplementary source of information, but they become difficult to scale across large factories.
2. Spreadsheet-Based Tracking
Some organizations collect machine information using spreadsheets.
A typical spreadsheet may contain:
| Date | Machine | Shift | Runtime | Downtime | Output |
|---|---|---|---|---|---|
| 01-Oct | Machine A | Morning | 7.2 hrs | 0.8 hrs | 420 |
| 01-Oct | Machine B | Morning | 6.5 hrs | 1.5 hrs | 350 |
Spreadsheets provide more structure than paper-based logs and can support basic calculations.
However, they still depend on manual data collection and usually do not provide real-time equipment visibility.
3. Sensor-Based Monitoring
Sensors can be used to capture equipment activity when machines do not expose the required digital information.
Sensors may detect conditions such as:
Machine vibration
Electrical current
Rotation
Temperature
Motion
Operating state
Sensor data can then be transmitted to a monitoring platform for analysis.
This approach is particularly useful for legacy equipment that lacks modern digital connectivity.
4. PLC-Based Tracking
Programmable Logic Controllers, or PLCs, are commonly used in industrial environments.
When machine status and production information are available through a PLC, a monitoring system can collect relevant signals and convert them into equipment metrics.
For example, PLC signals can help identify:
Running status
Stop conditions
Cycle completion
Production counts
Fault states
PLC-based tracking can provide more reliable and detailed machine data than manual recording when the equipment is properly integrated.
5. IoT-Based Equipment Monitoring
Industrial IoT enables equipment to send operational data to centralized software platforms.
An IoT architecture may include:
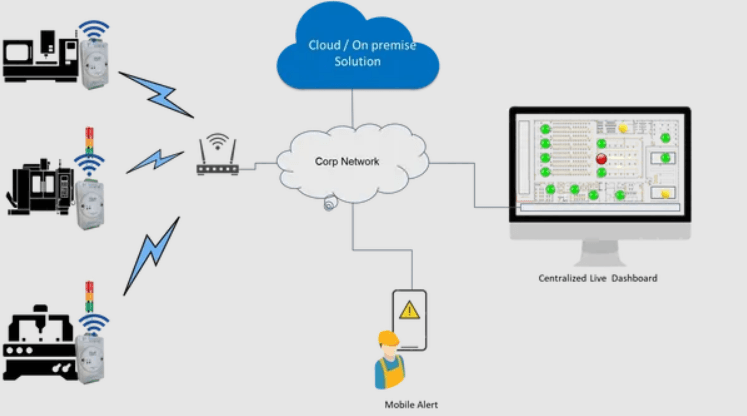
Machine → Sensor/PLC → Industrial Gateway → Network → Monitoring Platform → Dashboard
This approach can support centralized monitoring across multiple machines and production lines.
6. Machine Efficiency Software
Dedicated machine efficiency software combines equipment data collection, processing, visualization, and reporting in one environment.
Depending on the solution, it may provide:
Real-time machine status
Runtime tracking
Equipment utilization
Production monitoringHistorical reports
Performance dashboards
Alerts
Data analysis
This approach is useful when manufacturers need scalable, centralized equipment visibility.
Important Equipment Efficiency Metrics
Choosing the right metrics is essential.
Collecting large amounts of equipment data is not useful if teams cannot turn that information into decisions.
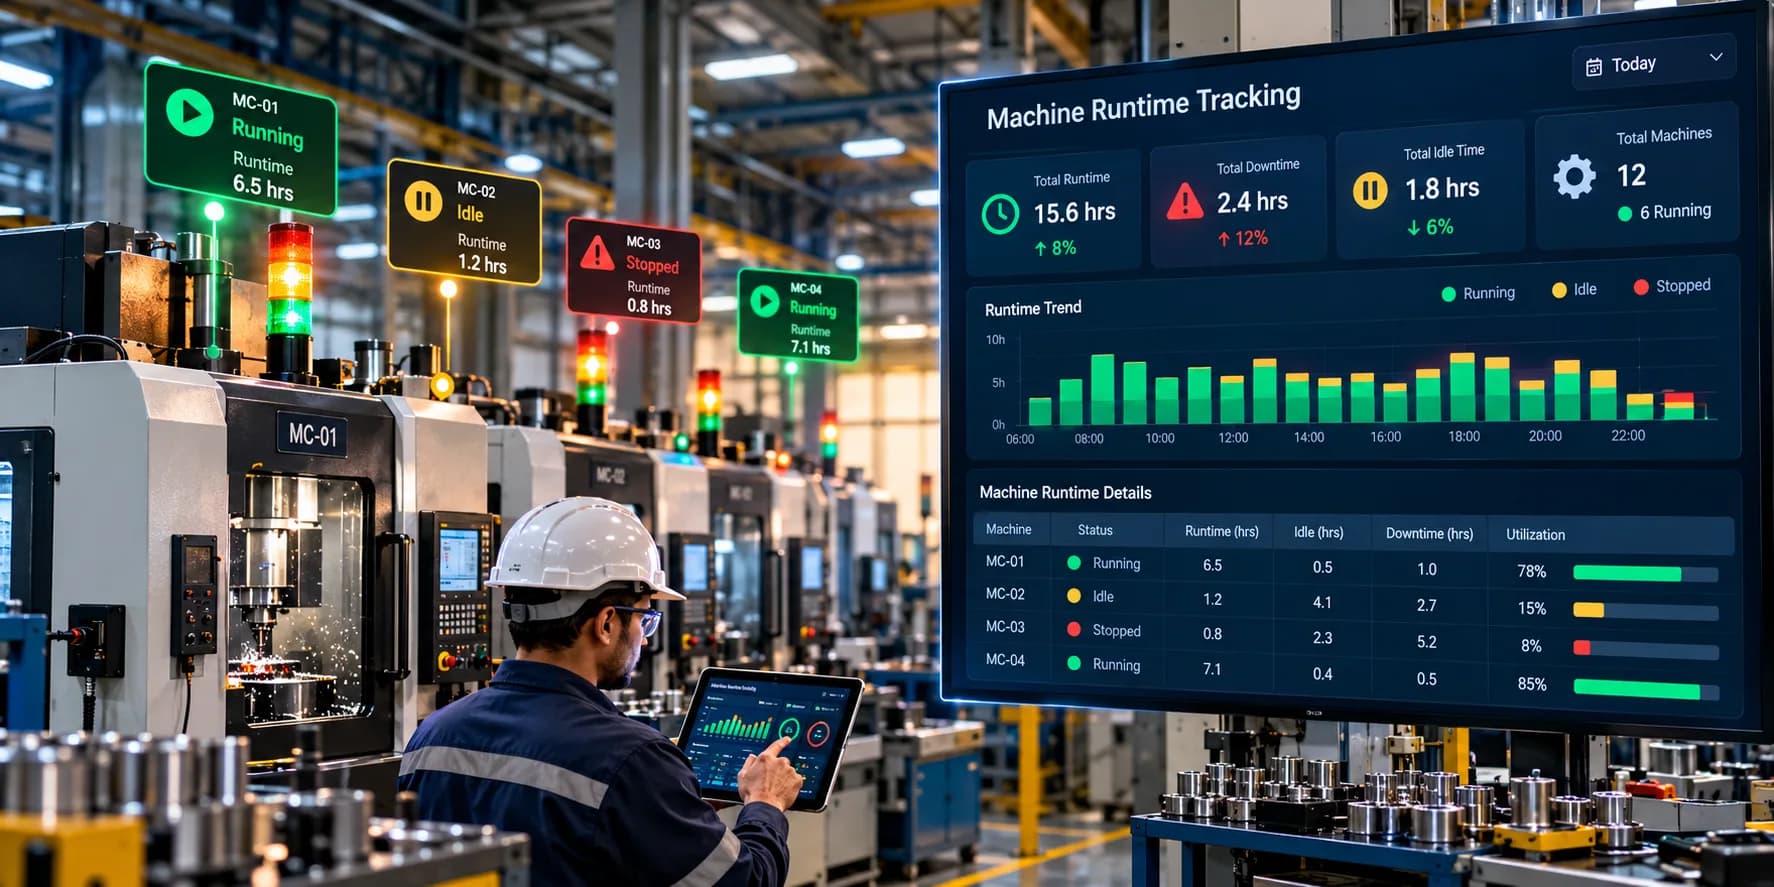
Equipment Runtime
Runtime represents the amount of time equipment actively operates.
For example, if equipment is scheduled for eight hours and operates for 6.5 hours, the recorded runtime is 6.5 hours.
Runtime can be analyzed by:
Machine
Production line
Shift
Day
Week
Month
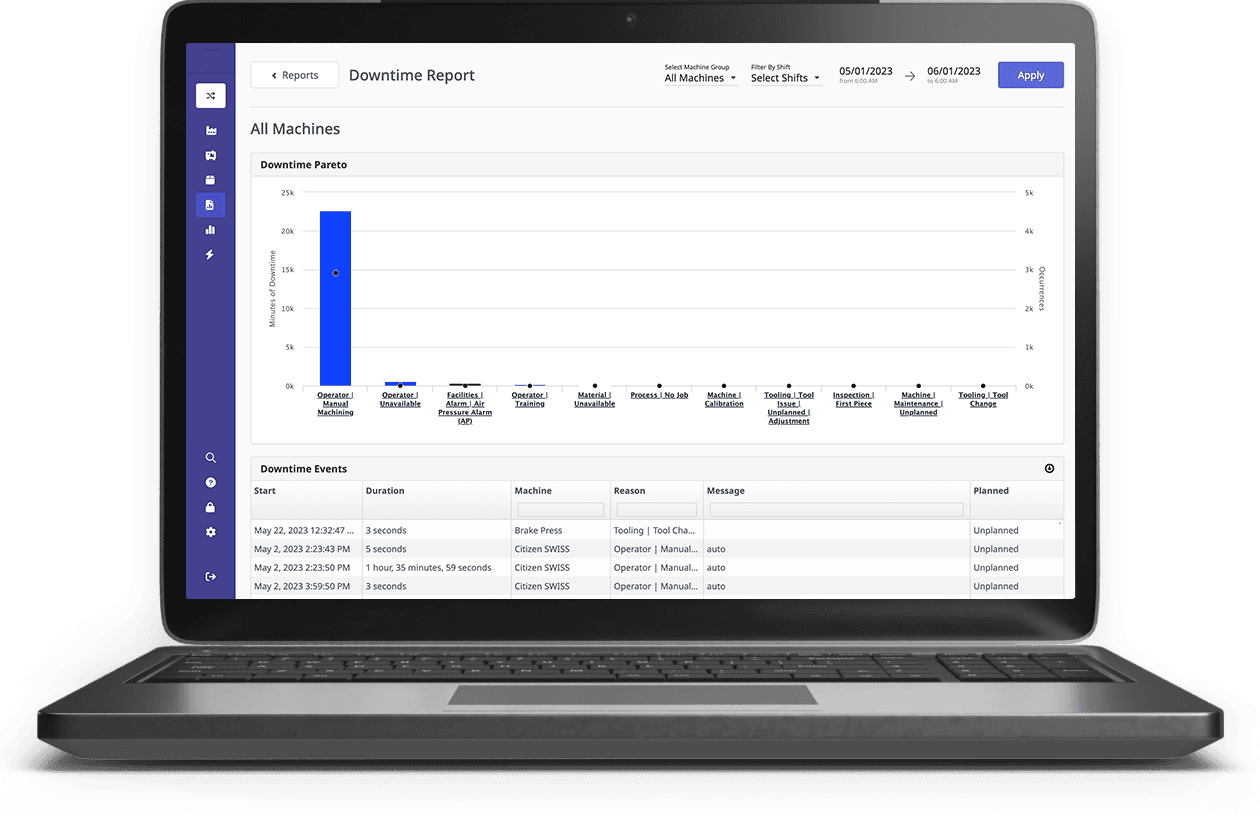
Equipment Downtime
Downtime represents periods when equipment is stopped or unavailable for production.
Downtime should ideally be categorized to provide additional context.
Common categories include:
Equipment failure
Maintenance
Material shortage
Changeover
Operator-related delay
Quality issue
Planned production stop
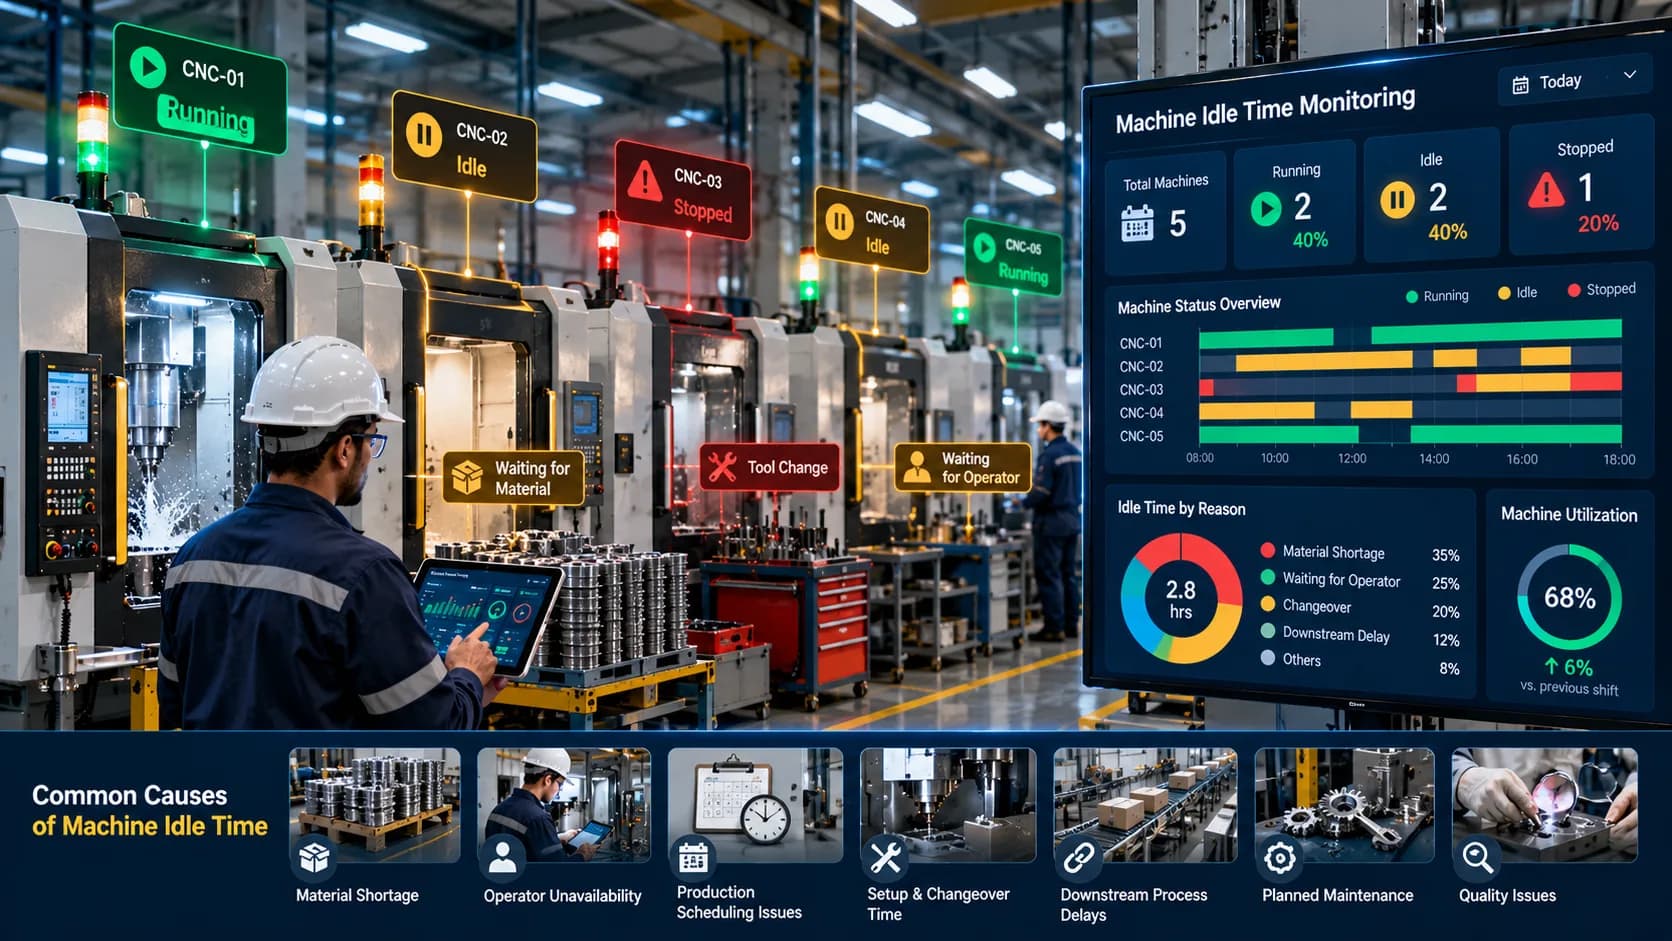
Equipment Idle Time
Idle time is different from downtime in many production environments.
A machine may be available and operational but not producing because it is waiting for material, an operator, a production order, or another process.
Tracking idle time separately can reveal hidden capacity losses.
Equipment Utilization
Equipment utilization indicates how much of the available equipment capacity is actually being used.
A simple utilization calculation can be expressed as:
Equipment Utilization = Actual Operating Time ÷ Available Production Time × 100
For example, if equipment is available for 10 hours and operates for 8 hours:
8 ÷ 10 × 100 = 80% utilization
The exact definition should be standardized within the organization because different production environments may calculate utilization differently.
Production Output
Output measures the quantity produced by equipment during a defined period.
Output becomes more useful when evaluated alongside runtime and utilization.
Cycle Time
Cycle time represents the time required to complete a production cycle.
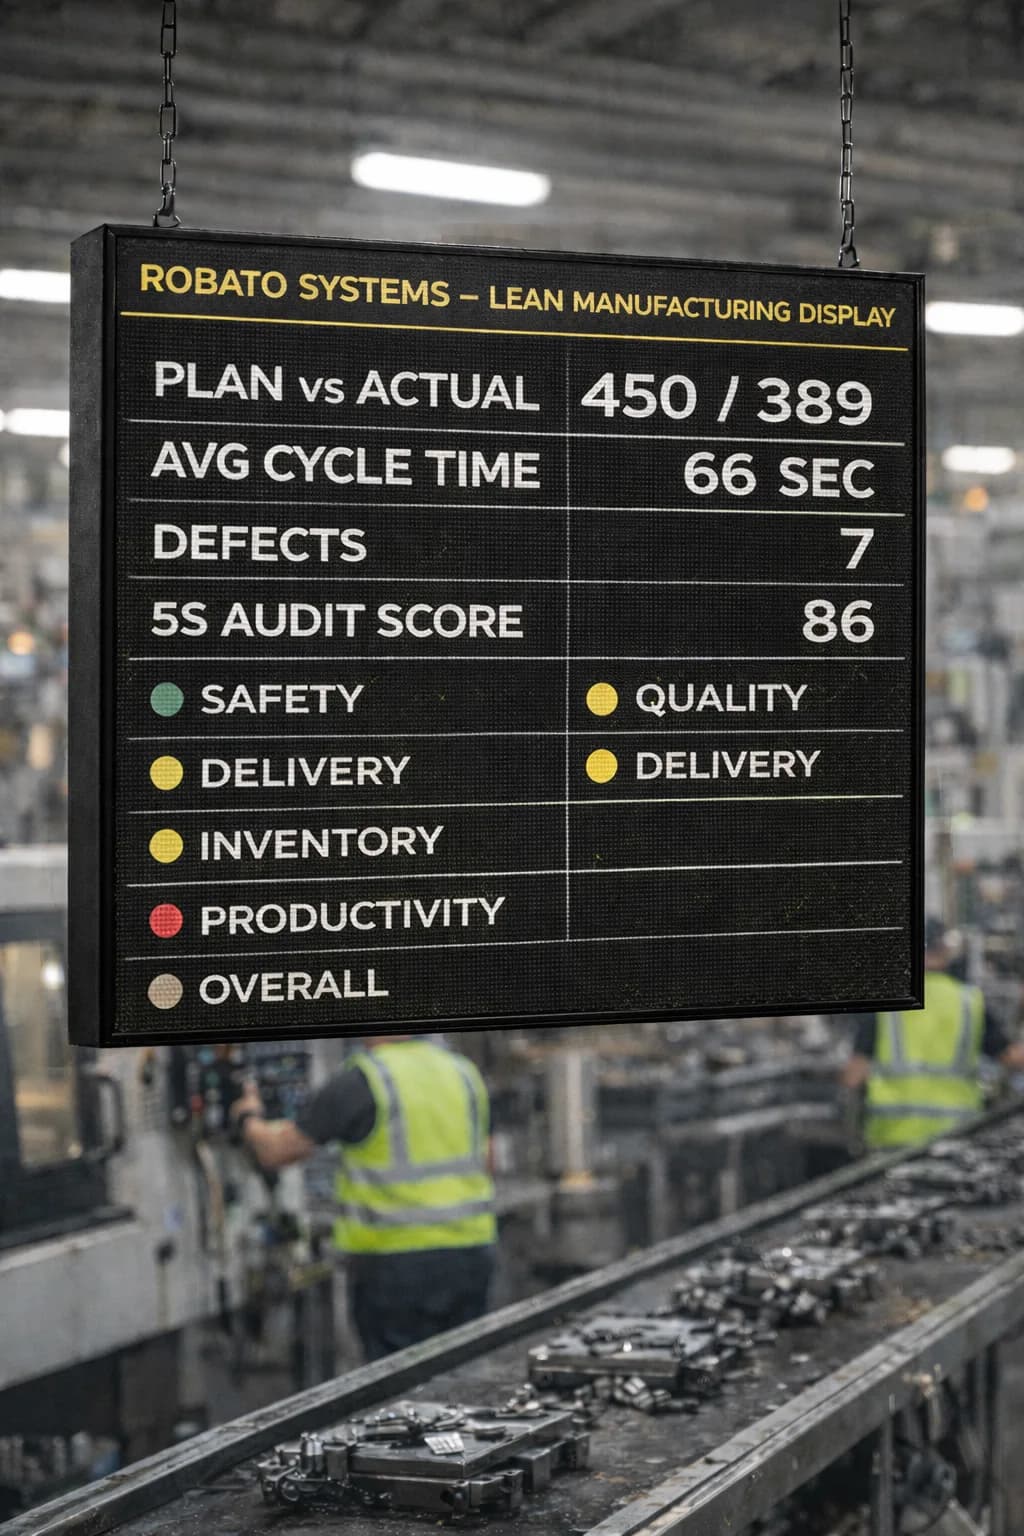
Comparing actual cycle time against the expected cycle time can reveal performance losses even when the machine remains operational.
Availability
Availability measures how much scheduled production time equipment is ready and available for operation.
It is particularly useful when evaluating the impact of breakdowns and maintenance interruptions.
Equipment Efficiency Tracking Using OEE
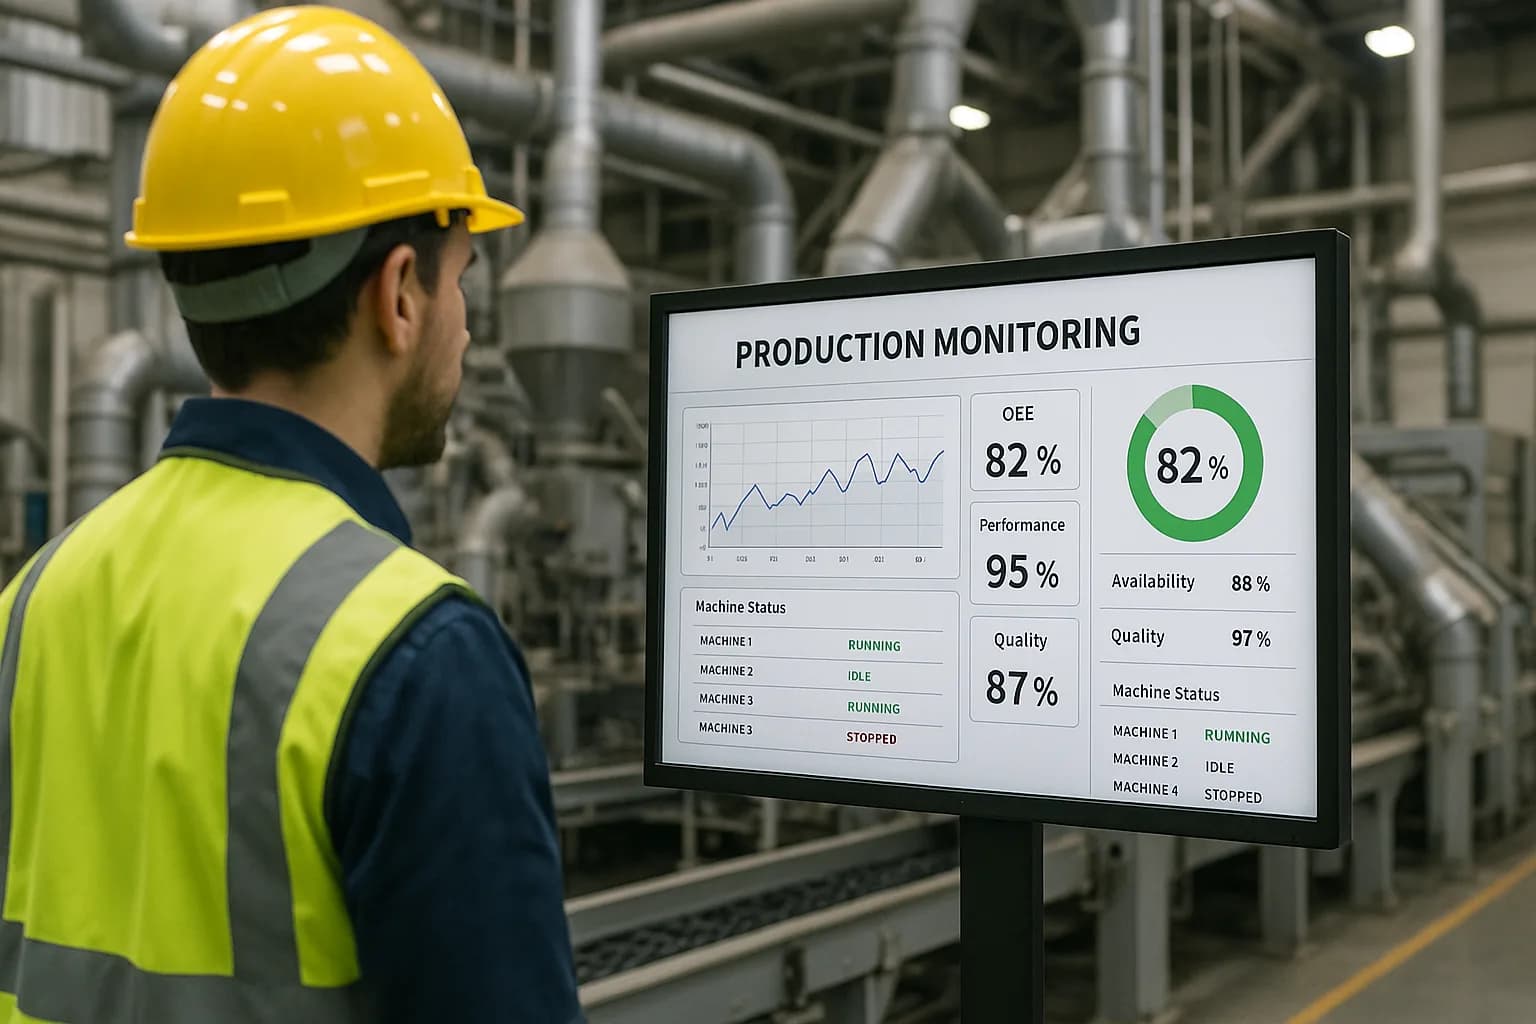
Overall Equipment Effectiveness, commonly known as OEE, is one of the most widely used frameworks for evaluating manufacturing equipment performance.
OEE considers three dimensions:
Availability
Performance
Quality
A commonly used representation is:
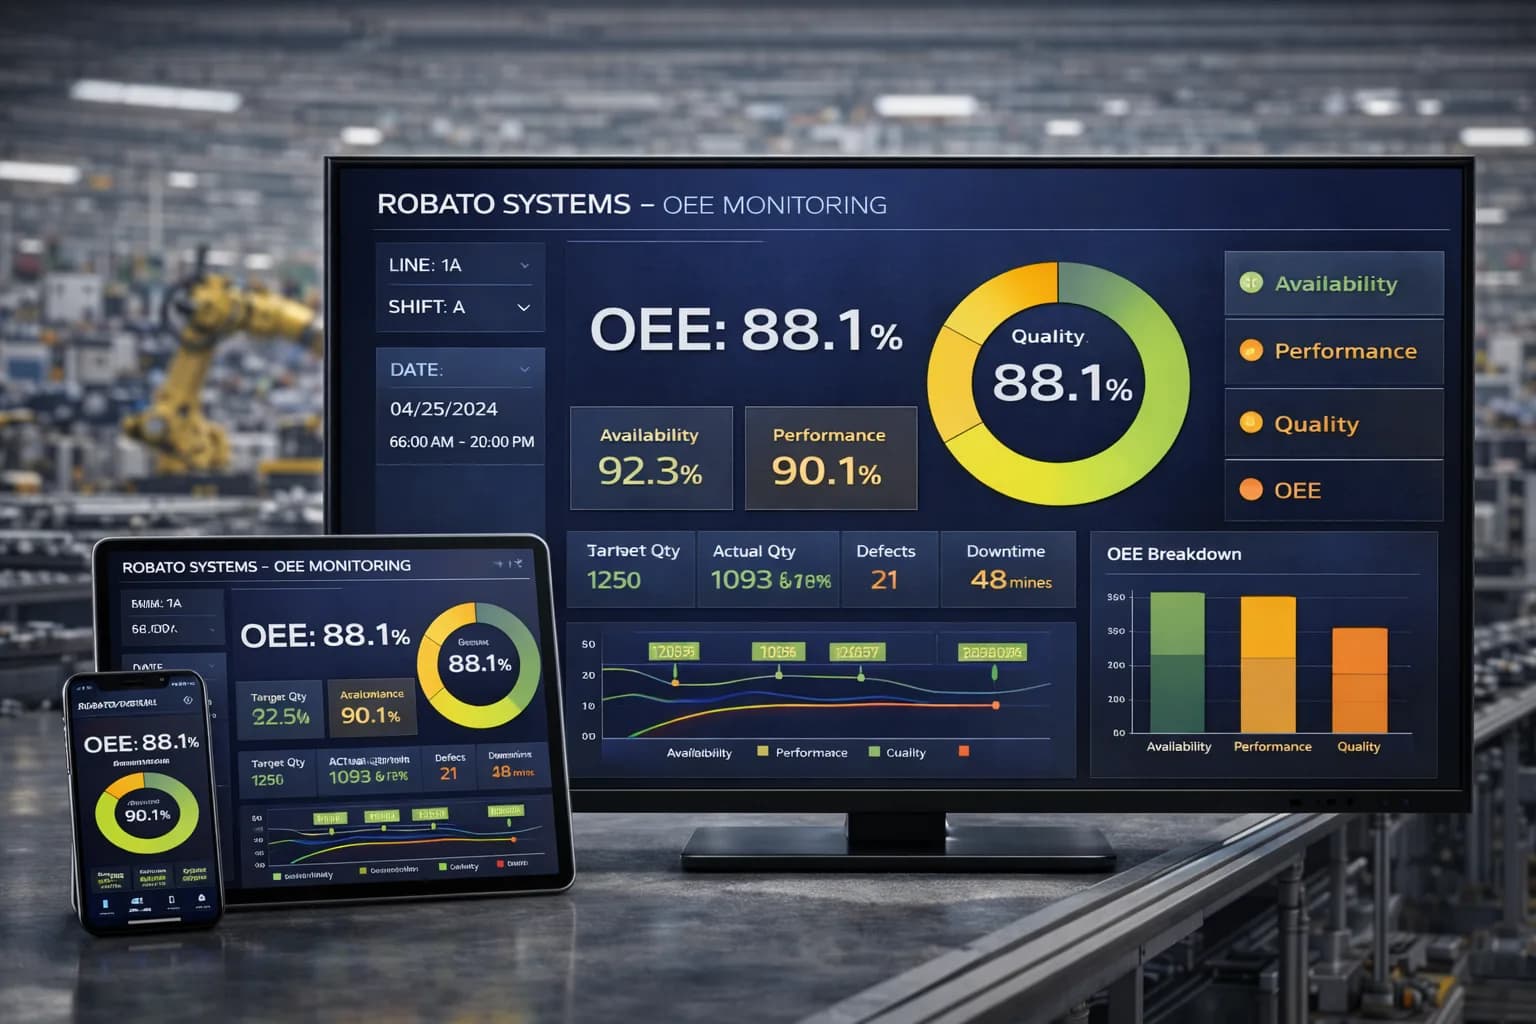
OEE = Availability × Performance × Quality
Equipment efficiency tracking can provide much of the operational information needed to understand these components.
For example:
Runtime and downtime support availability analysis.
Cycle time and production rate support performance analysis.
Good production and rejected production support quality analysis.
However, OEE should not automatically replace other equipment metrics. Organizations should select measurements based on their specific production objectives.
Real-Time Equipment Efficiency Tracking
Traditional equipment tracking often provides information after a shift or production period.
Real-time monitoring changes the timing of that information.
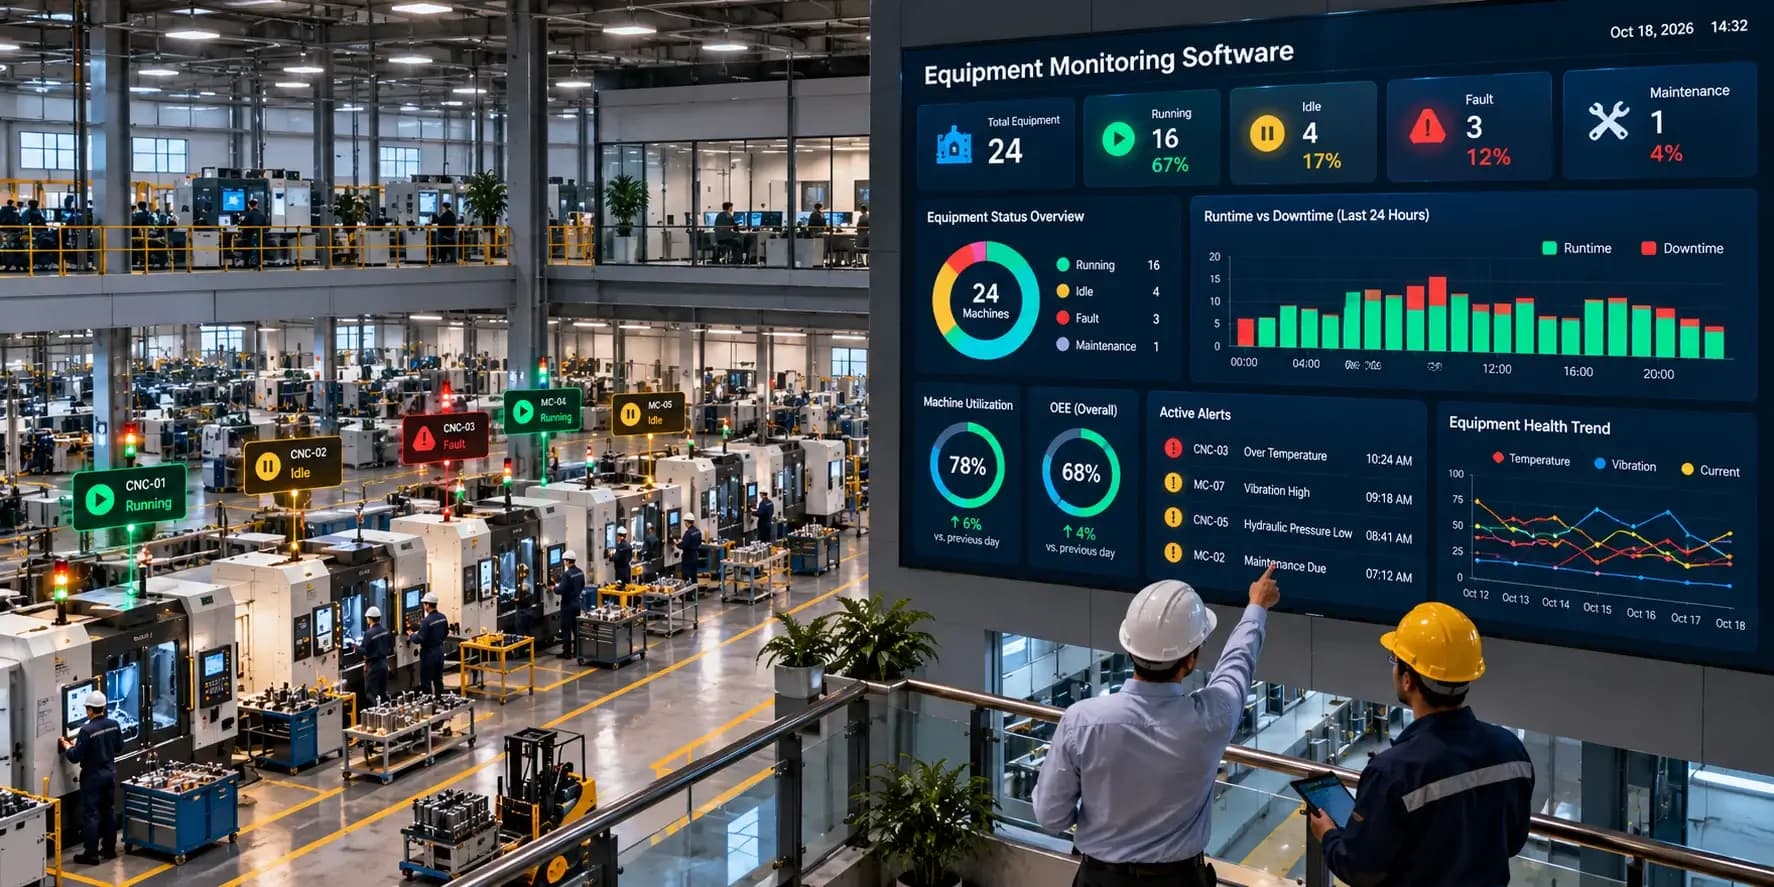
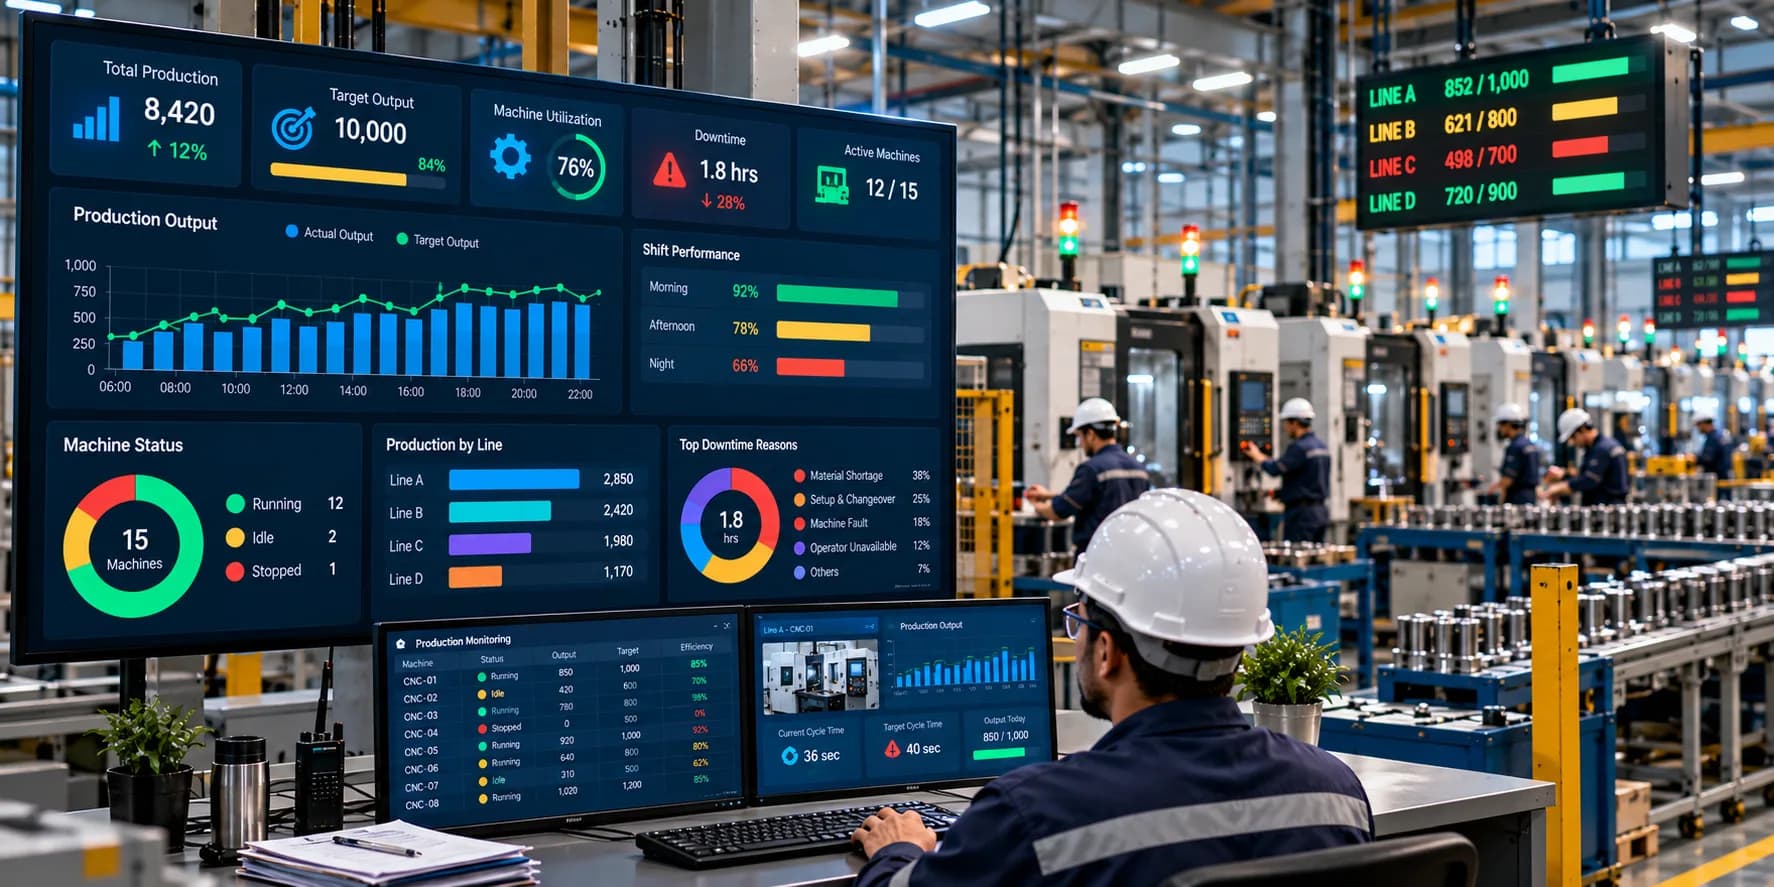
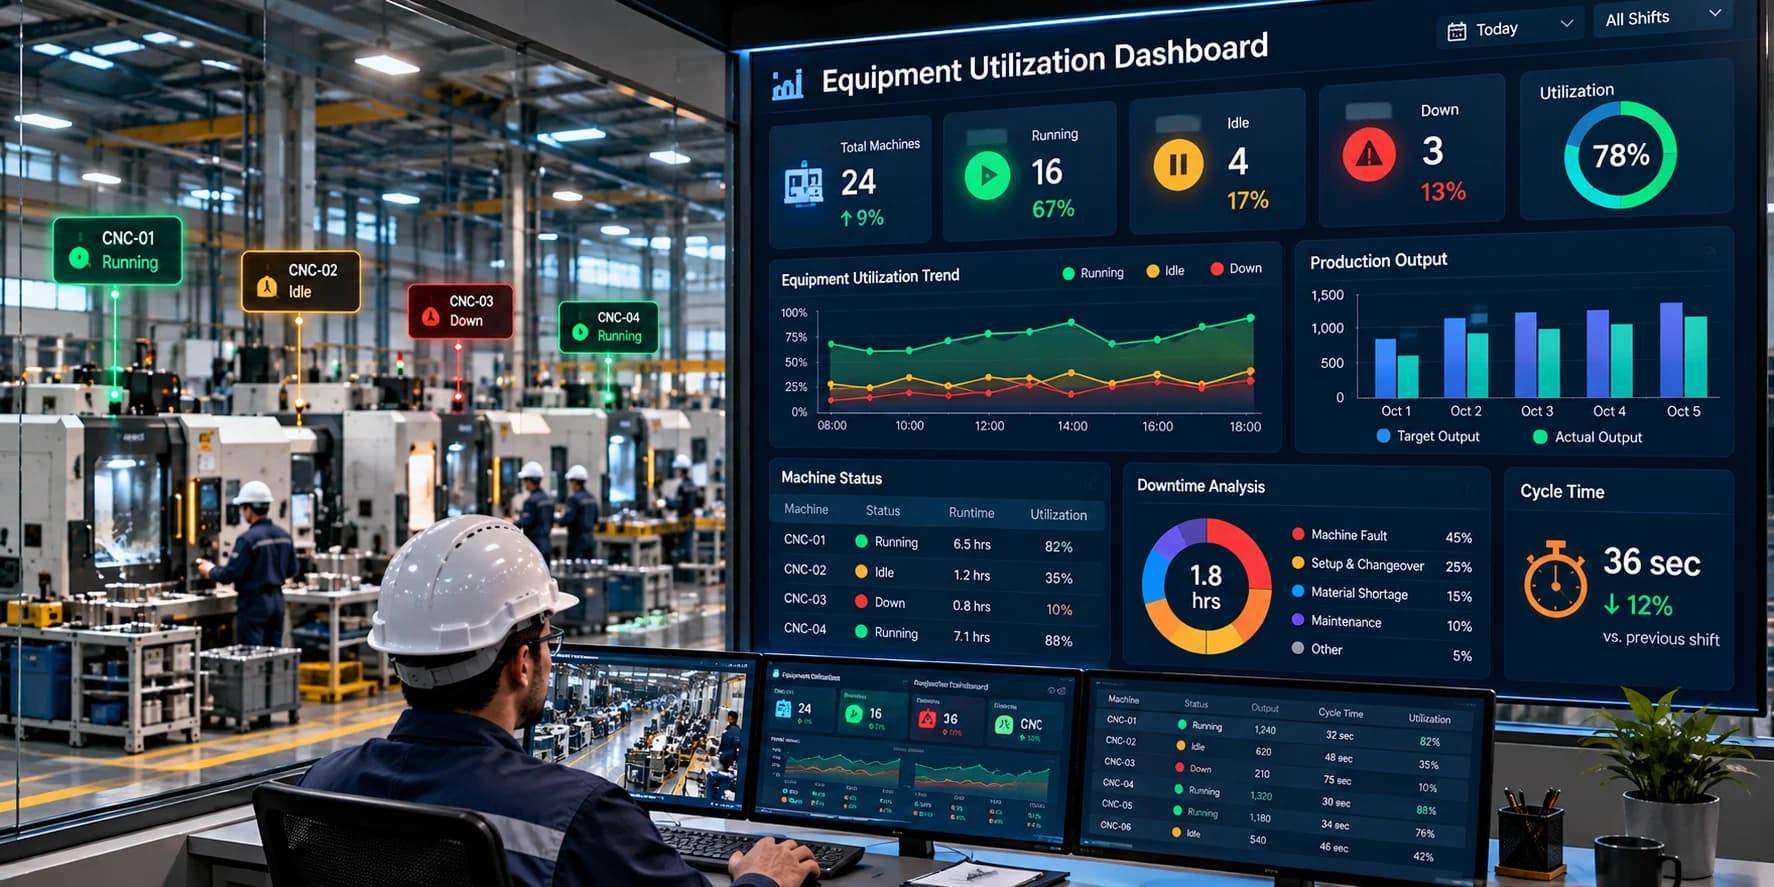
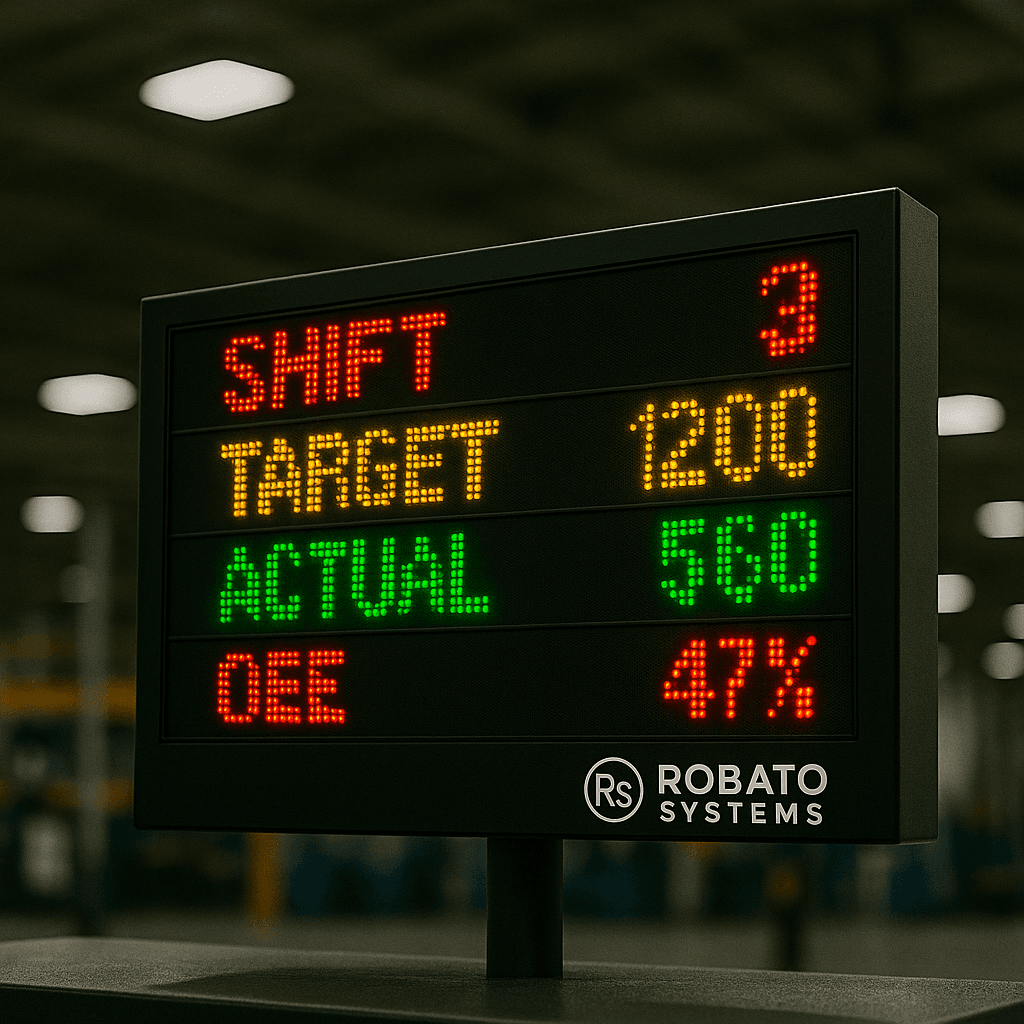
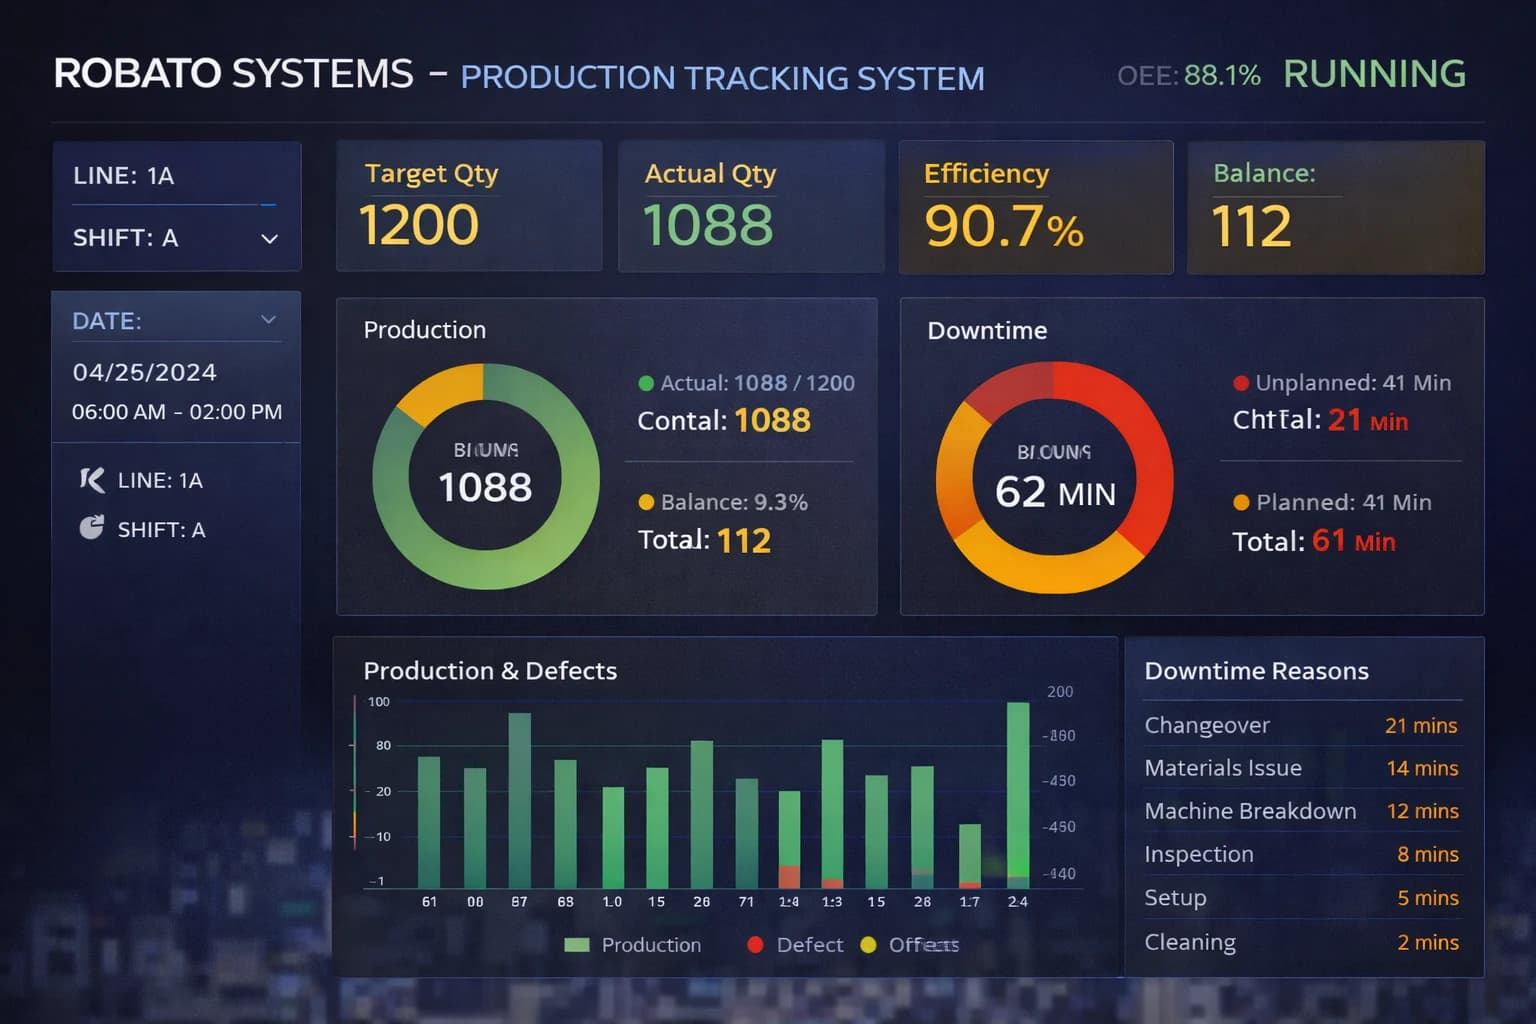
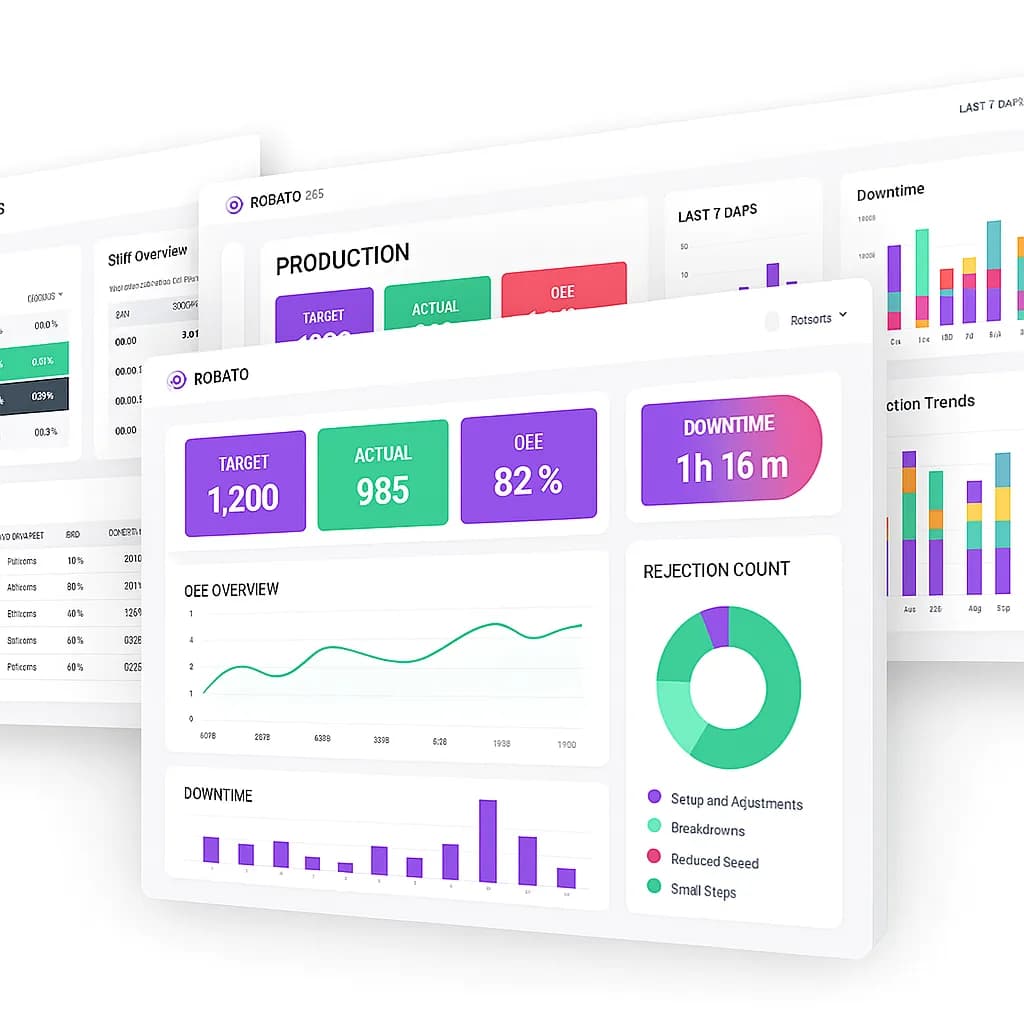
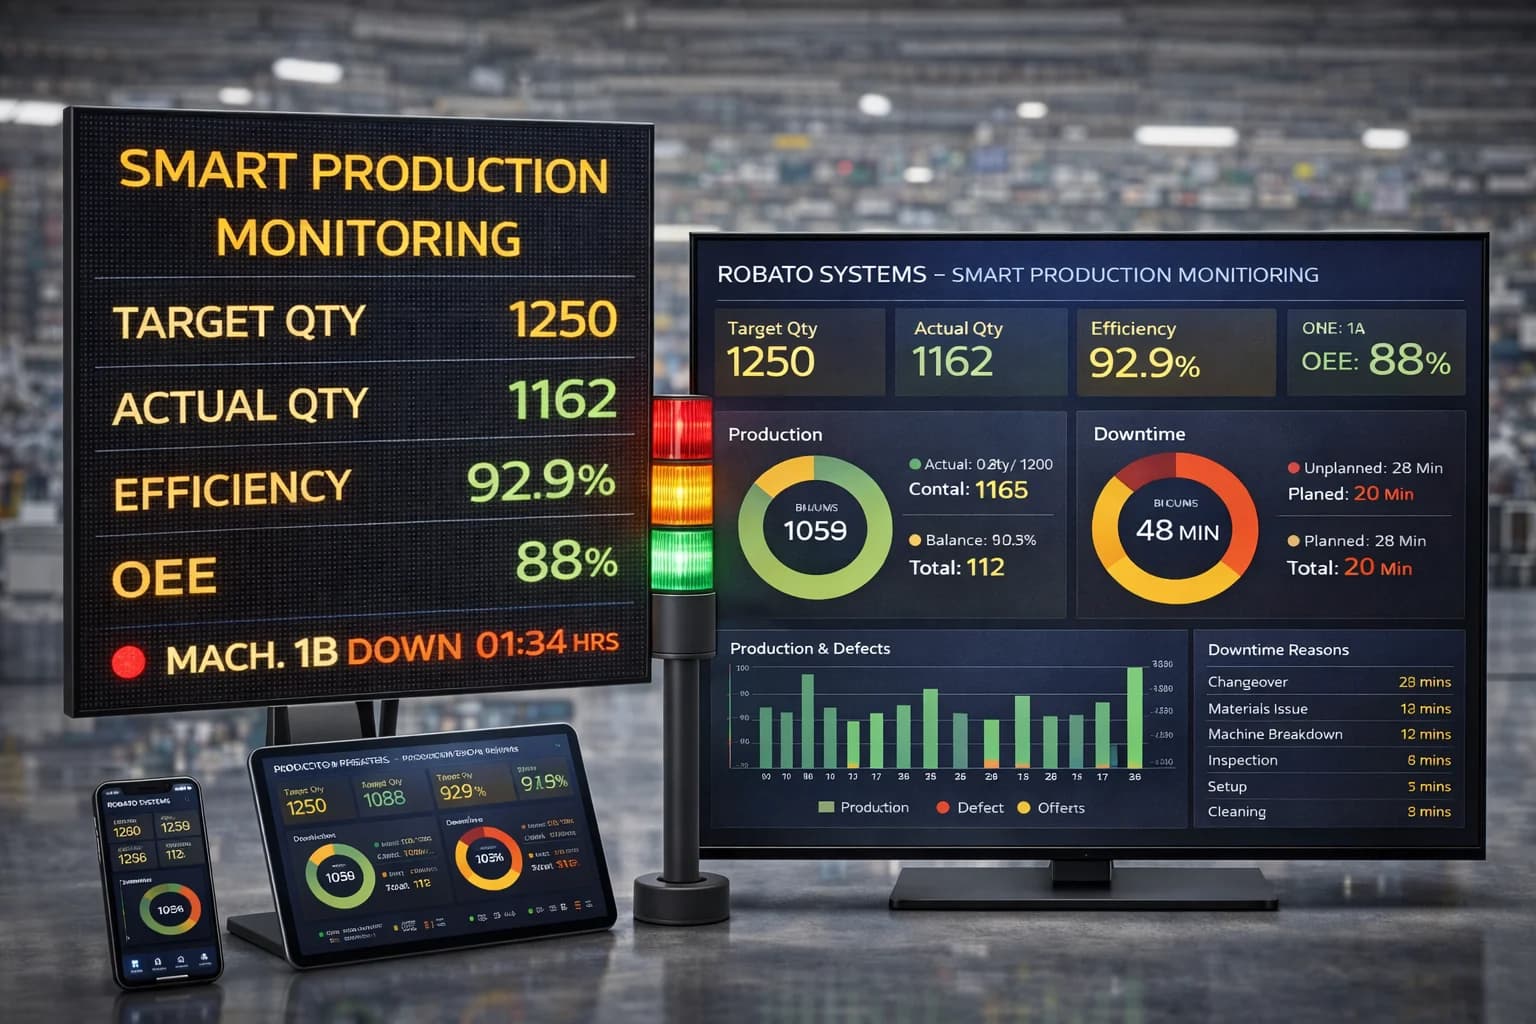
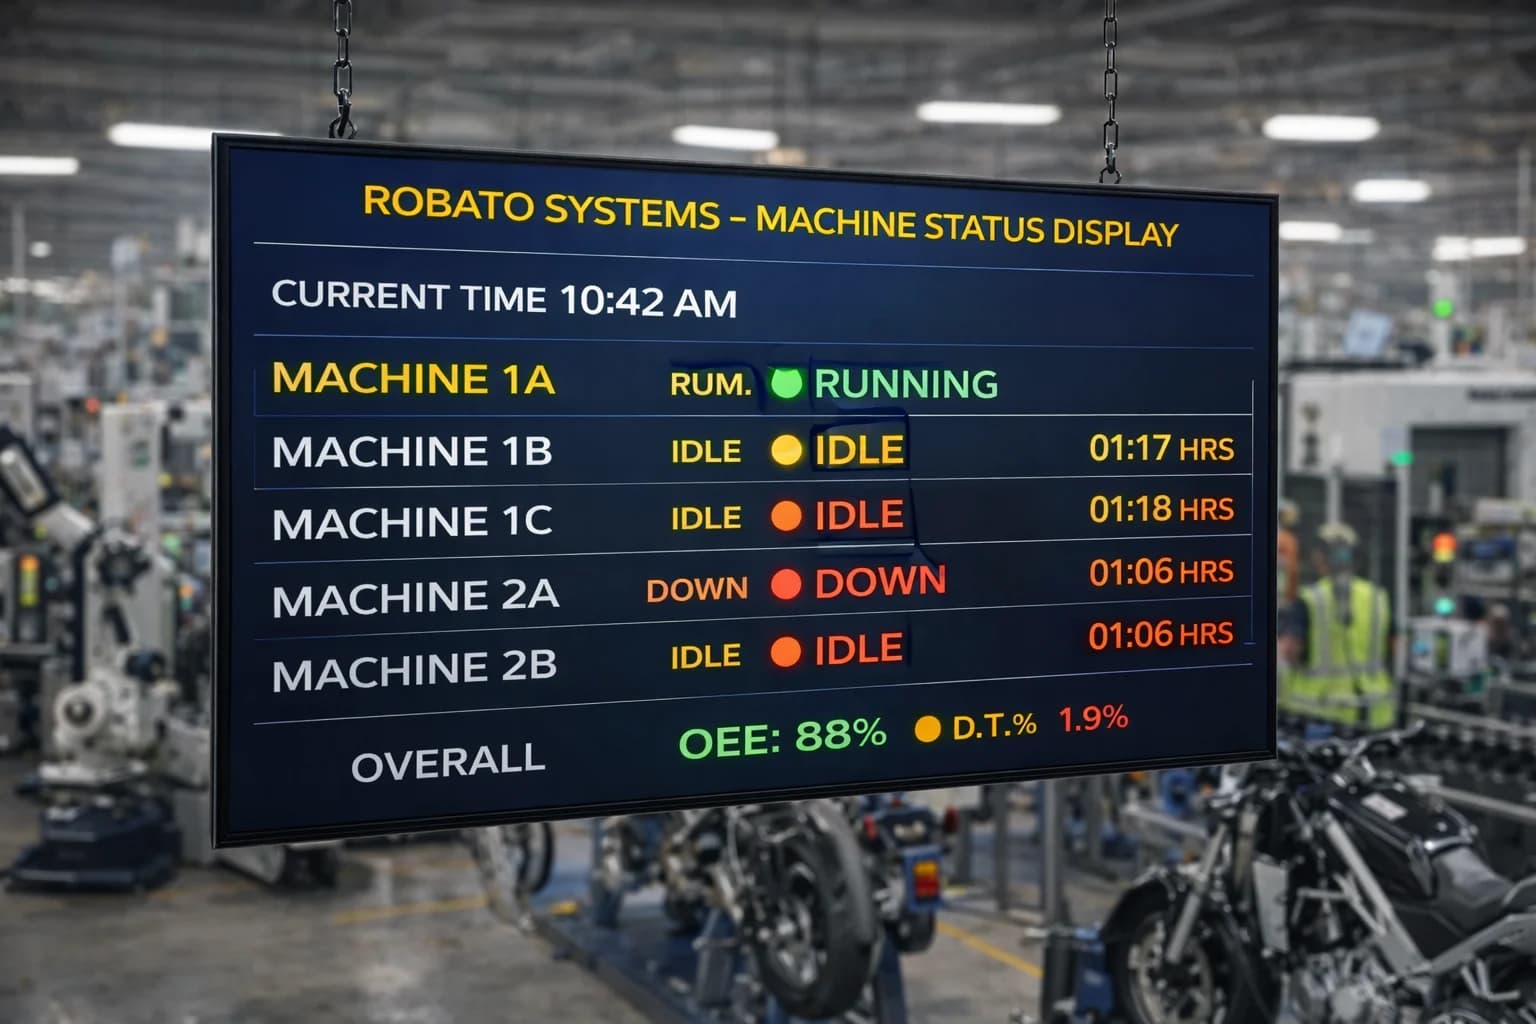
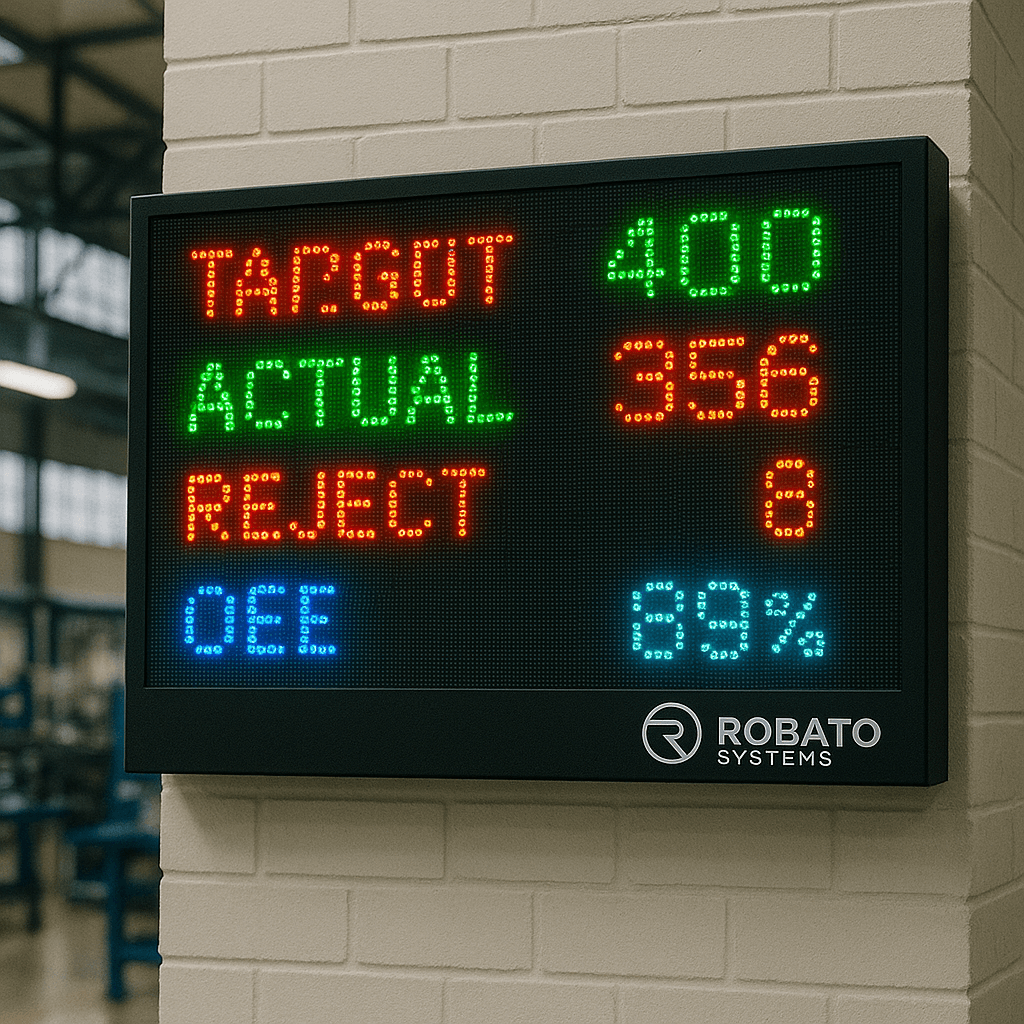
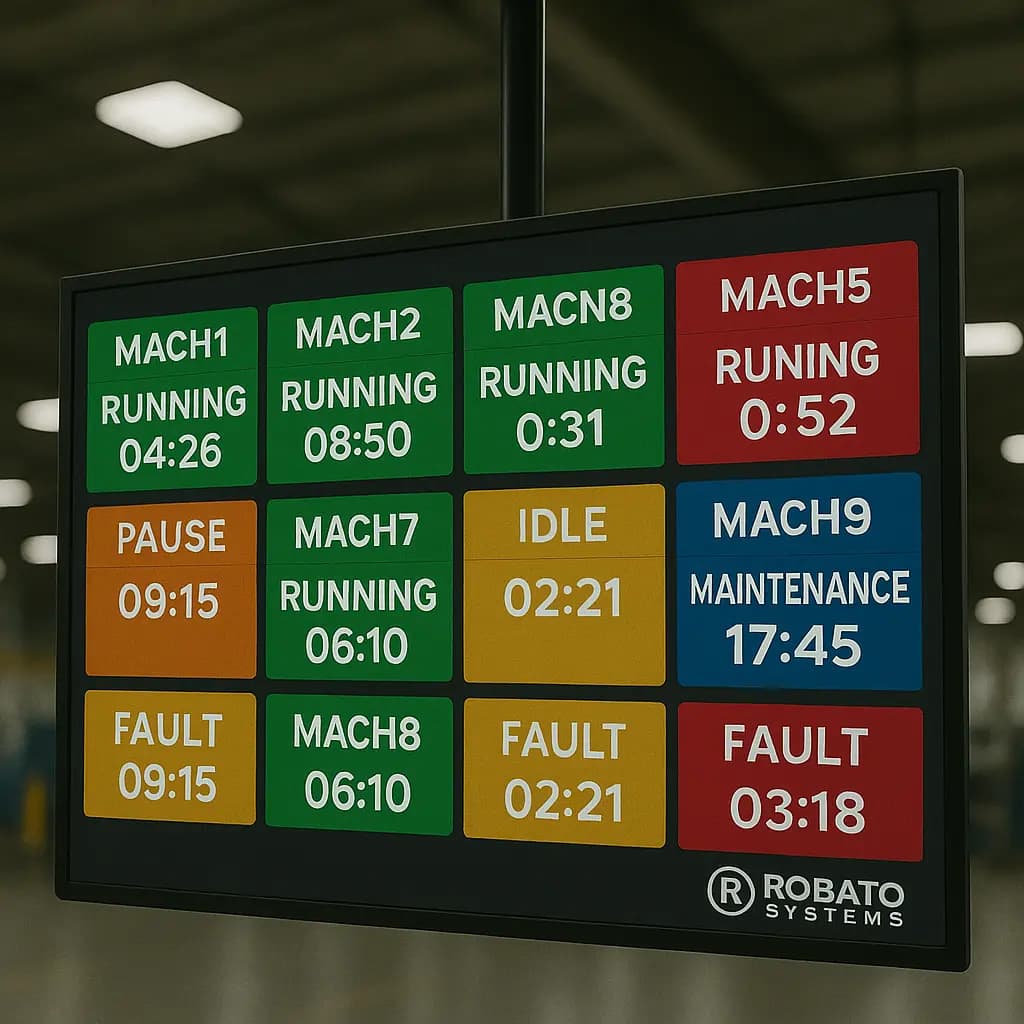
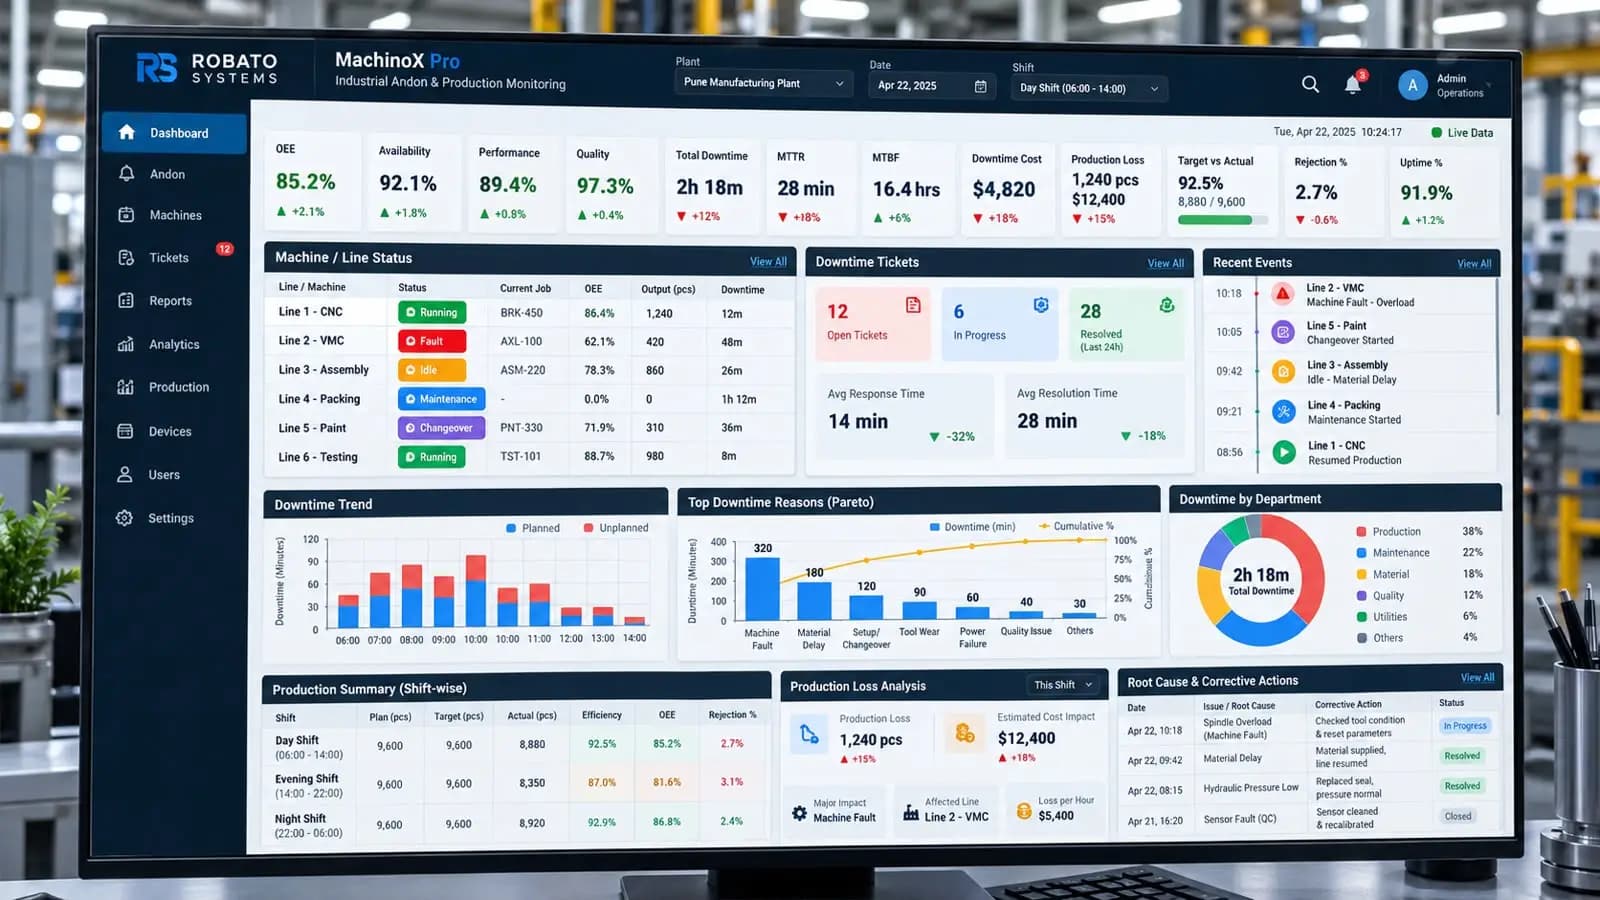
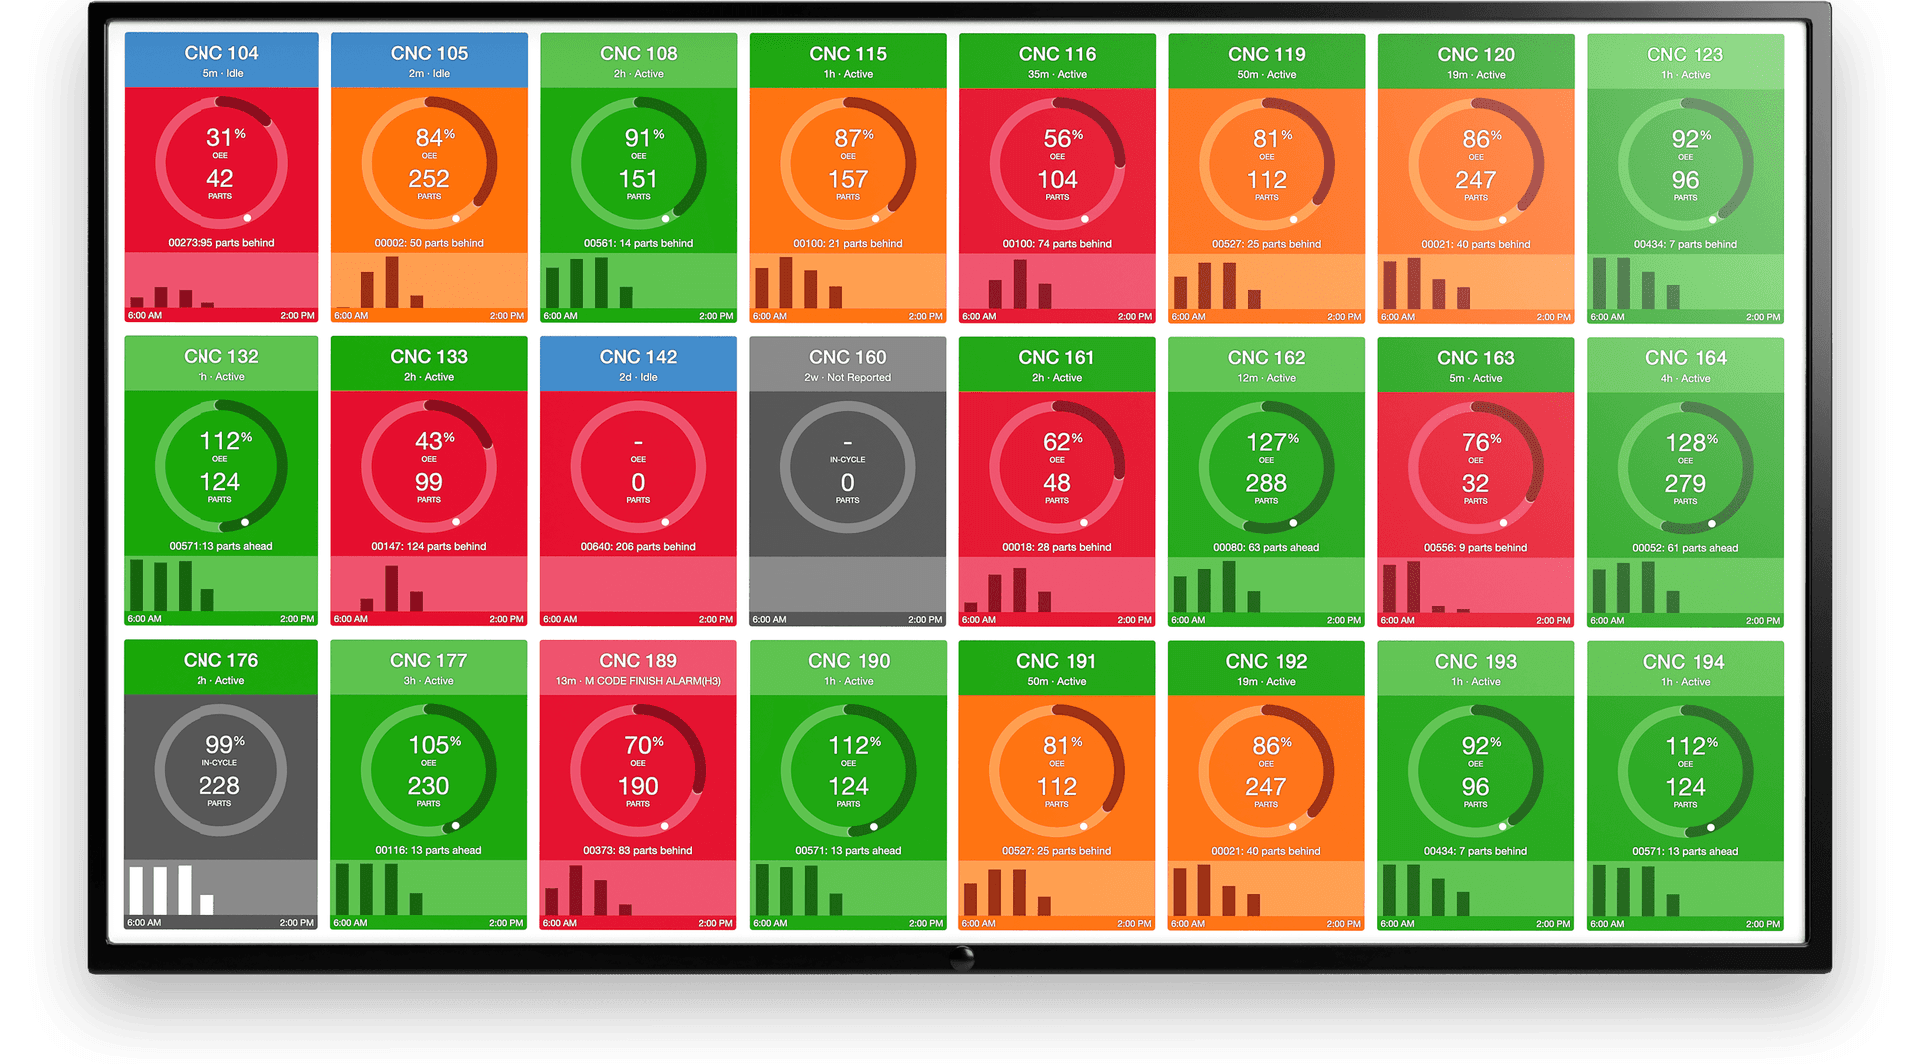
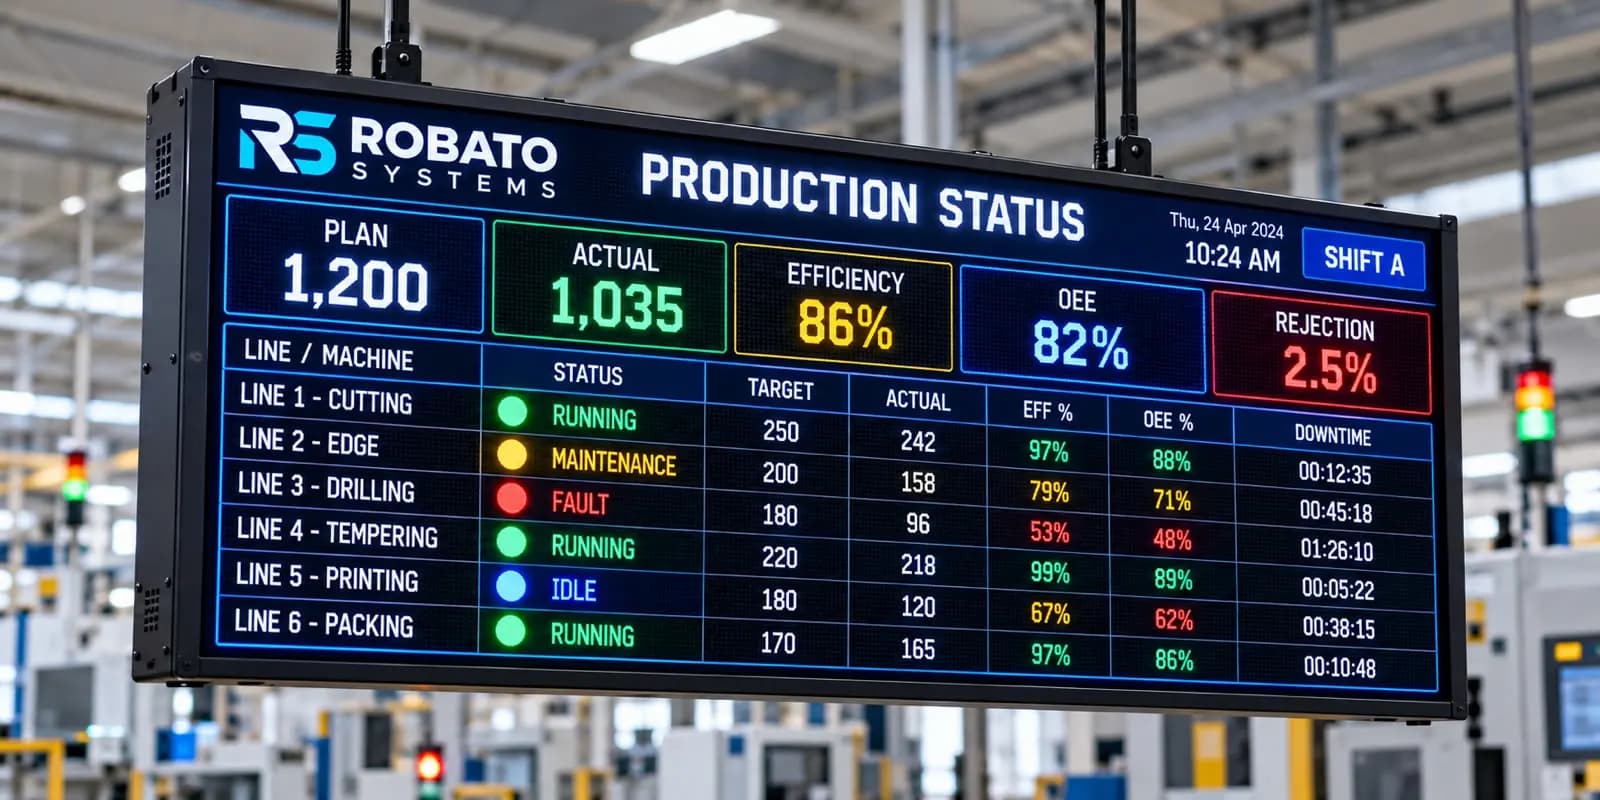
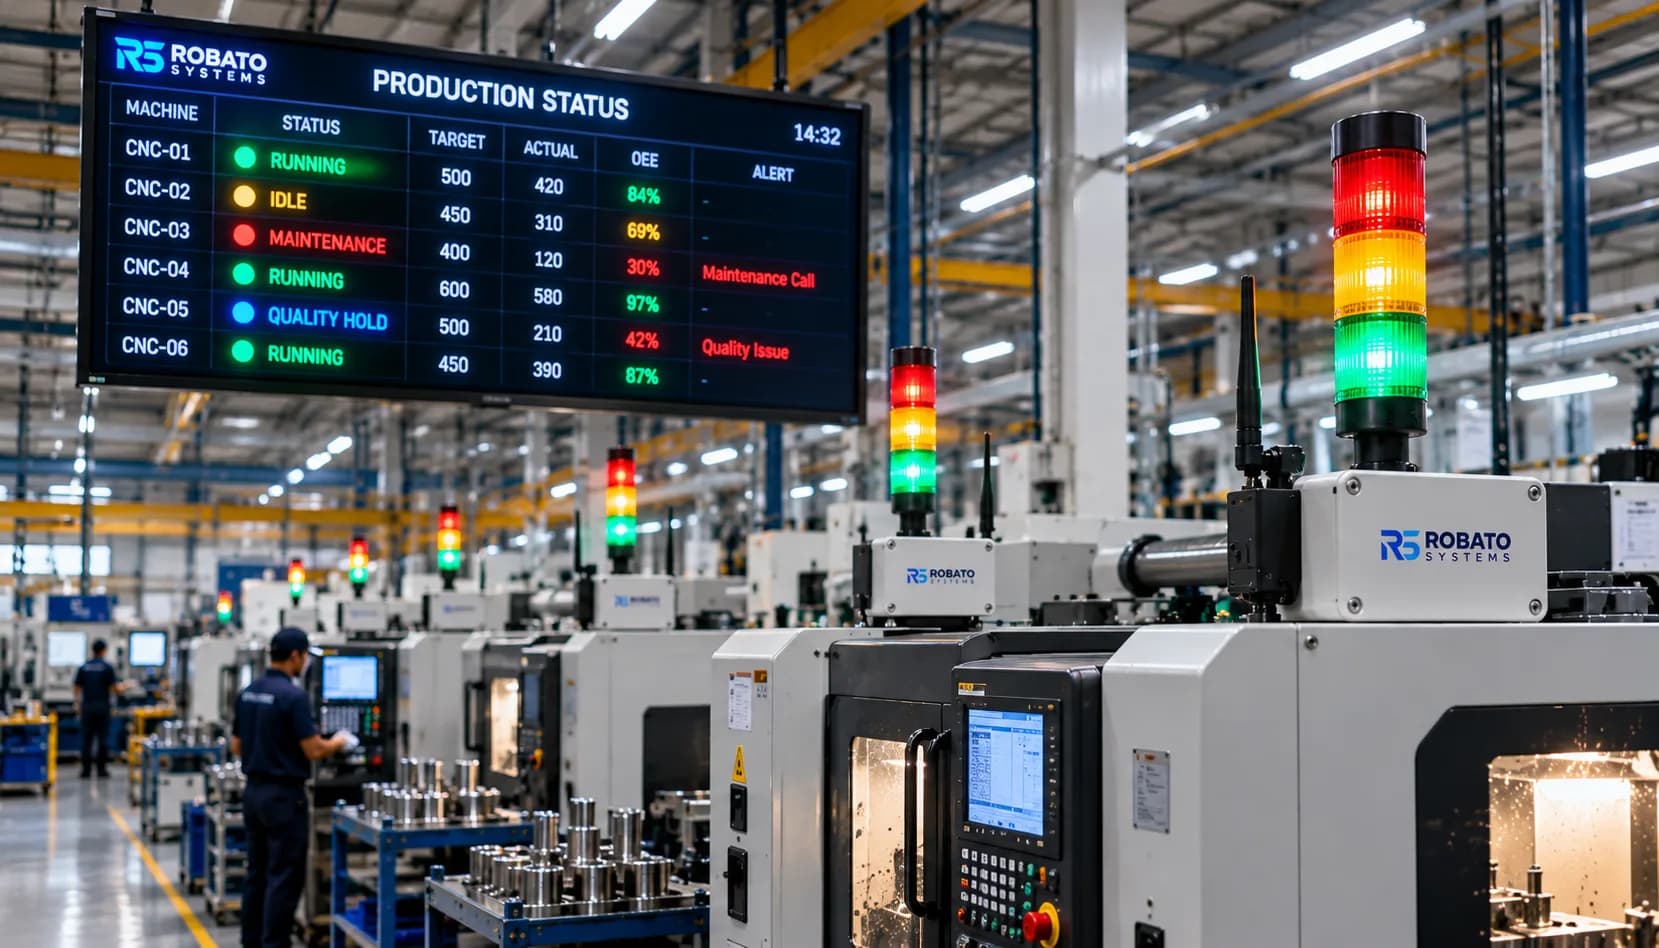
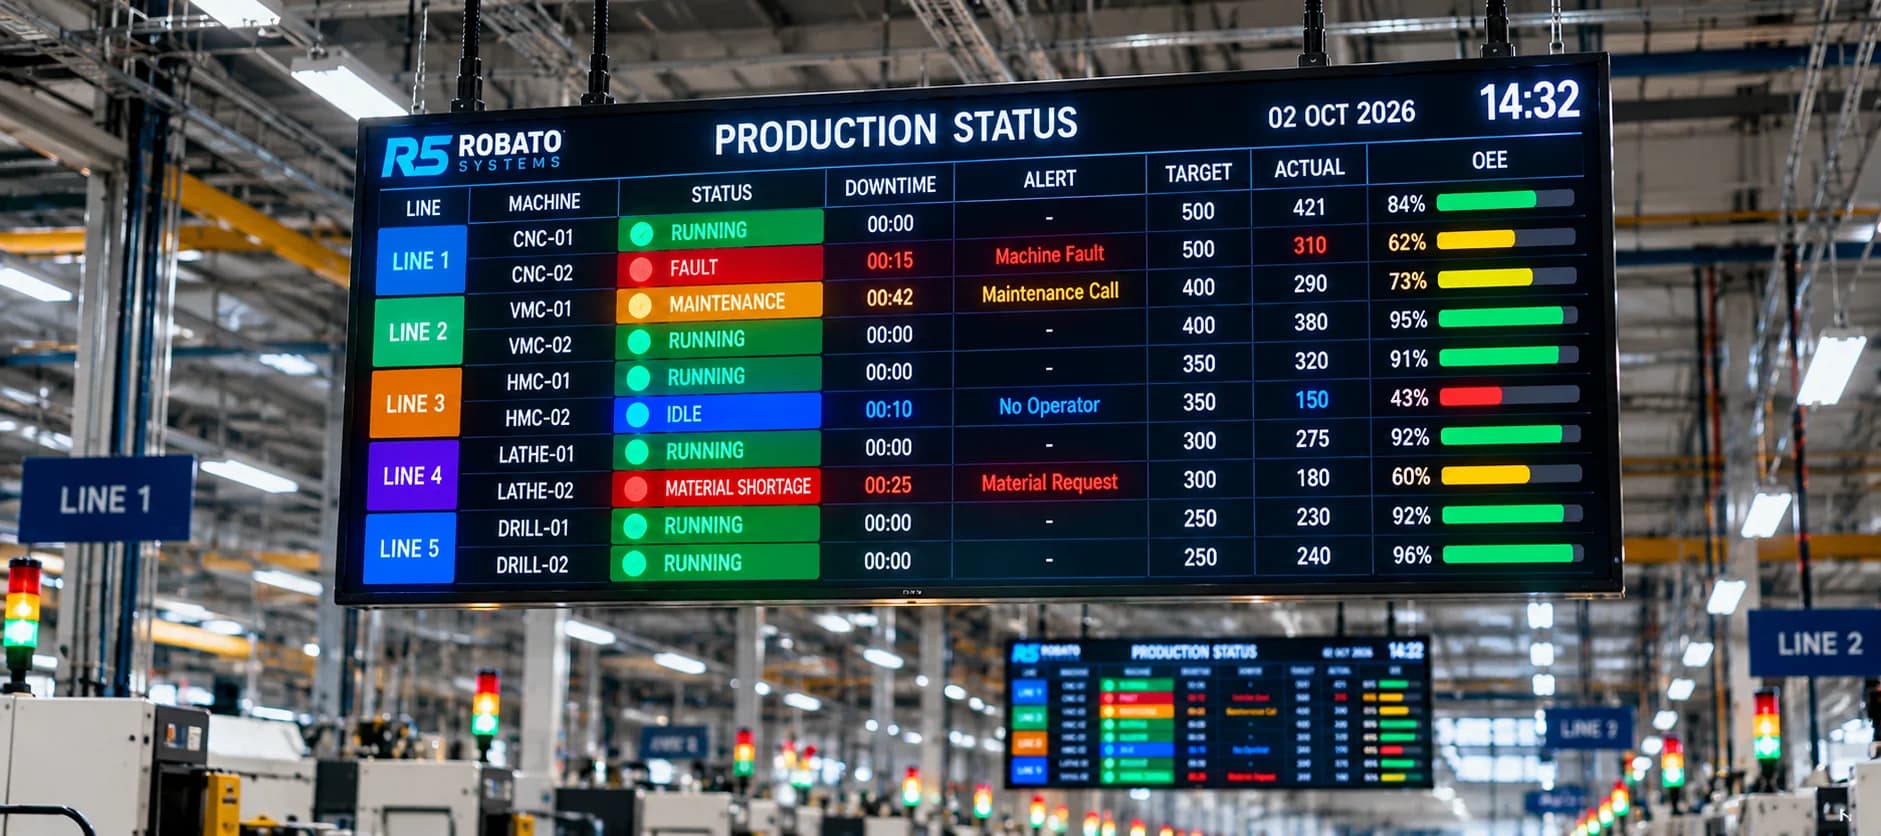
A dashboard may show:
Machines currently running
Machines currently idle
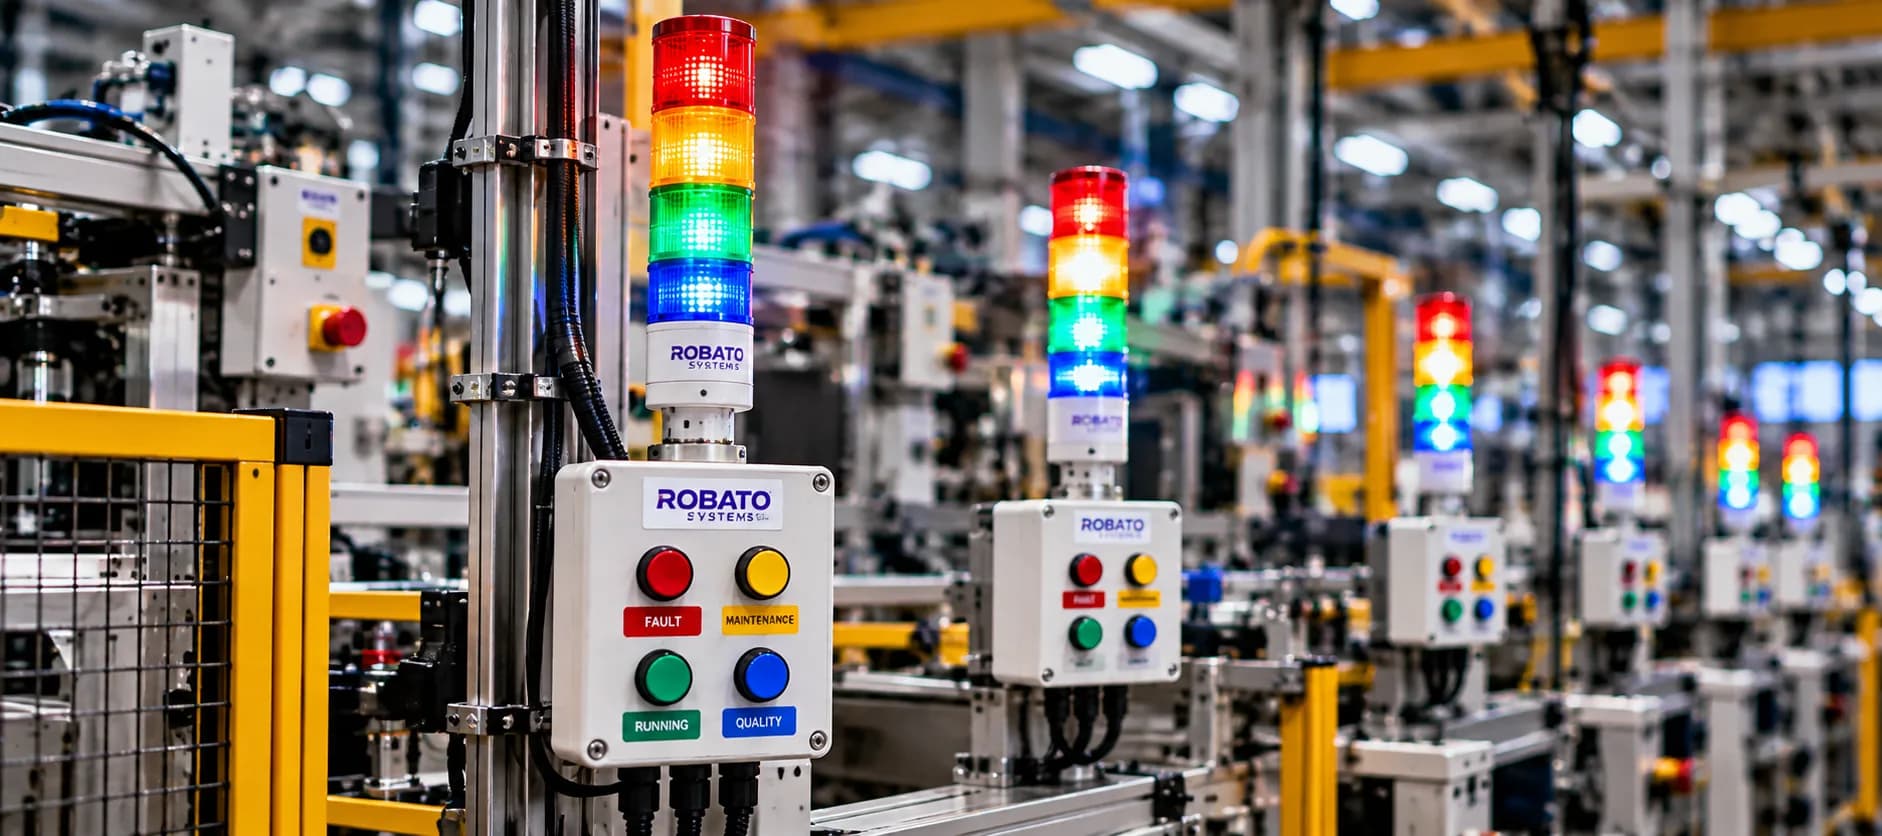
Machines currently stopped
Active production lines
Current production counts
Current downtime
Production alerts
This visibility can help supervisors respond more quickly to operational problems.
For example, if a machine remains stopped for 20 minutes, a real-time monitoring system can make that event visible while the production team still has an opportunity to respond.
Historical Equipment Efficiency Tracking
Real-time visibility is useful for immediate response, but historical analysis is essential for long-term improvement.
Historical equipment data can reveal:
Recurring downtime
Shift-level differences
Weekly utilization trends
Equipment performance changes
Repeated short stops
Long-term production patterns
A machine that appears to perform normally during one shift may reveal a recurring problem when its data is analyzed over several weeks.
Equipment Efficiency Tracking by Shift
Shift-based analysis can help manufacturers identify differences in equipment performance.
Useful comparisons include:
Runtime by shift
Downtime by shift
Output by shift
Utilization by shift
Average cycle time
Production target achievement
However, shift comparisons should consider differences in product mix, production orders, planned maintenance, staffing, and machine availability.
A lower output does not necessarily indicate poor performance if the shift had different production requirements.
Equipment Efficiency Tracking by Production Line
Tracking individual machines is useful, but production lines should also be analyzed as complete systems.
A production line can be affected by bottlenecks where one machine limits the output of other equipment.
Line-level monitoring can help identify:
Bottleneck equipment
Underutilized machines
Repeated line interruptions
Imbalanced production capacity
Dependencies between equipment
This broader view can prevent teams from optimizing one machine while leaving the overall production process unchanged.
How Digital Equipment Tracking Improves Accuracy
Digital monitoring can reduce several weaknesses associated with manual tracking.
Automatic Data Collection
Where machine connectivity is available, operational data can be collected without requiring operators to record every event manually.
Consistent Timestamps
Machine events can be associated with system timestamps, improving the accuracy of historical analysis.
Centralized Information
Equipment data from multiple machines can be viewed in one environment.
Automated Calculations
Metrics such as runtime, downtime, utilization, and production rates can be calculated automatically based on configured rules.
Historical Storage
Equipment information can be retained for trend analysis and reporting.
How to Implement Equipment Efficiency Tracking
Step 1: Define the Objective
Start with the business problem.
Examples include:
Improve machine utilization
Reduce downtime
Increase production capacity
Improve production reporting
Identify bottlenecks
Step 2: Inventory the Equipment
Create a list of machines and document:
Machine type
Manufacturer
Controller
Available signals
Existing connectivity
Production role
Step 3: Select the Required Metrics
Decide which metrics will be used to evaluate equipment efficiency.
Avoid implementing unnecessary measurements simply because they are available.
Step 4: Choose the Data Collection Method
Depending on the equipment, select an appropriate approach:
Manual data
Sensors
PLC integration
Industrial gateways
IoT devices
Existing production systems
Step 5: Standardize Machine States
Define what constitutes:
Running
Idle
Stopped
Maintenance
Fault
Production
Consistent definitions are essential for meaningful reporting.
Step 6: Build the Monitoring Dashboard
Create dashboards that provide the information required by different users.
Operators may need current status, while management may need long-term trends.
Step 7: Establish Baselines
Collect historical data before setting aggressive improvement targets.
A baseline provides a realistic reference point.
Step 8: Identify Efficiency Losses
Look for patterns such as:
High downtime
Extended idle time
Low utilization
Slow cycle times
Repeated machine stops
Step 9: Take Corrective Action
Investigate the operational causes behind the identified losses.
Step 10: Measure the Results
Compare equipment performance before and after improvements.
Continuous tracking allows organizations to determine whether corrective actions actually produced measurable results.
Common Equipment Efficiency Tracking Challenges
Legacy Equipment
Older machines may not have modern communication interfaces.
Sensors or industrial gateways may be required to capture useful data.
Inconsistent Data
Different machines may report information using different formats or signal definitions.
Standardization is therefore important.
Data Quality
Incorrect machine signals can produce misleading efficiency calculations.
Data should be validated before being used for important operational decisions.
Connectivity Problems
Unreliable industrial networks can interrupt data collection.
Too Much Data
Collecting every possible signal can create complexity without improving decision-making.
The focus should remain on useful operational information.
Lack of Root-Cause Information
A monitoring platform may identify that a machine stopped but not automatically explain why it stopped.
Additional reason codes, operator inputs, maintenance records, or process information may be required.
Best Practices for Equipment Efficiency Tracking
1. Define Metrics Before Collecting Data
Know what decisions the data needs to support.
2. Standardize Equipment States
Use consistent definitions across machines and production lines.
3. Separate Planned and Unplanned Events
This prevents planned maintenance or scheduled production stops from being interpreted as unexpected equipment failures.
4. Track Idle Time Separately
Idle time can represent significant hidden capacity loss.
5. Monitor Short Stops
Frequent short interruptions can accumulate into substantial production losses.
6. Combine Machine and Production Data
Equipment status alone may not explain production performance.
Combine machine activity with production output where possible.
7. Use Role-Based Dashboards
Different users need different levels of information.
8. Review Historical Trends
Avoid making decisions based on isolated events.
9. Validate Calculations
Ensure utilization, runtime, downtime, and other metrics use clearly defined formulas.
10. Connect Tracking to Action
The objective of equipment efficiency tracking is improvement—not simply measurement.
Equipment Efficiency Tracking Software
For factories with multiple machines or production lines, software-based equipment efficiency tracking can simplify data collection and analysis.
A modern platform may combine:
Machine connectivity
Real-time monitoring
Equipment utilization tracking
Runtime and downtime monitoring
Production data
Dashboards
Historical reports
Alerts
Analytics
This provides a centralized environment for understanding equipment performance.
When evaluating such software, manufacturers should consider:
Machine connectivity
Scalability
Dashboard flexibility
Reporting capabilities
Integration options
Security
Ease of deployment
Ease of use
The right solution depends on the organization's equipment, production environment, data requirements, and improvement objectives.
Frequently Asked Questions
What is equipment efficiency tracking?
Equipment efficiency tracking is the process of measuring and analyzing equipment runtime, downtime, utilization, output, cycle time, and other operational metrics to understand how effectively production equipment is being used.
Why is equipment efficiency tracking important?
It helps manufacturers identify unused capacity, recurring downtime, low utilization, slow production cycles, and other factors that can reduce production efficiency.
How is equipment utilization calculated?
A simple calculation is:
Equipment Utilization = Actual Operating Time ÷ Available Production Time × 100
Organizations should define the calculation consistently across their production environment.
Can old machines be monitored?
Yes. Legacy machines can often be monitored using sensors, industrial gateways, PLC connections, or other suitable data collection methods.
What is the difference between equipment efficiency and equipment utilization?
Equipment utilization focuses primarily on how much available equipment capacity is being used. Equipment efficiency can cover a broader set of factors, including utilization, downtime, runtime, cycle time, output, and performance.
Is manual equipment tracking still useful?
Manual tracking can be useful for smaller operations or as a supplementary source of information. However, it becomes harder to maintain accuracy and scalability as the number of machines increases.
Can equipment efficiency tracking reduce downtime?
Tracking itself does not physically reduce downtime. It provides visibility that helps teams identify recurring downtime patterns and investigate their causes so corrective actions can be implemented.
Can equipment efficiency tracking support multiple production lines?
Yes. A centralized system can collect and display information from multiple machines and production lines when the required connectivity and infrastructure are available.
Conclusion
Equipment Efficiency Tracking gives manufacturers a practical framework for understanding how effectively their production equipment is being used.
From simple manual logs and spreadsheets to sensor-based monitoring, PLC integration, industrial IoT, and dedicated machine efficiency software, organizations can choose different tracking methods depending on their equipment and operational requirements.
The most valuable approach is not necessarily the one that collects the most data. It is the approach that produces reliable information, makes equipment losses visible, and helps production teams take measurable action.
By tracking runtime, downtime, idle time, utilization, output, cycle time, and other relevant metrics, manufacturers can establish meaningful performance baselines and identify opportunities to use existing equipment capacity more effectively.
When equipment efficiency tracking becomes part of the regular production improvement process, machine data can move from being a passive record to becoming a practical tool for better manufacturing decisions.