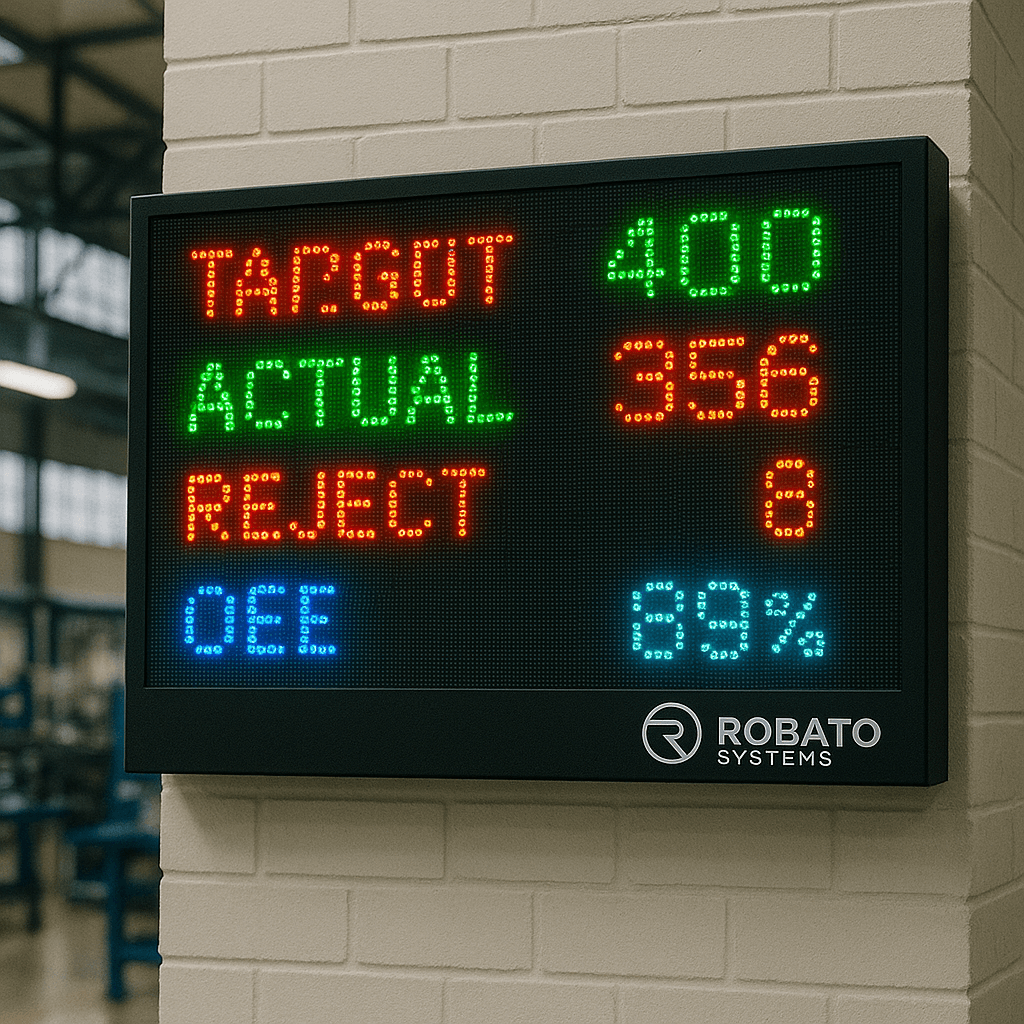
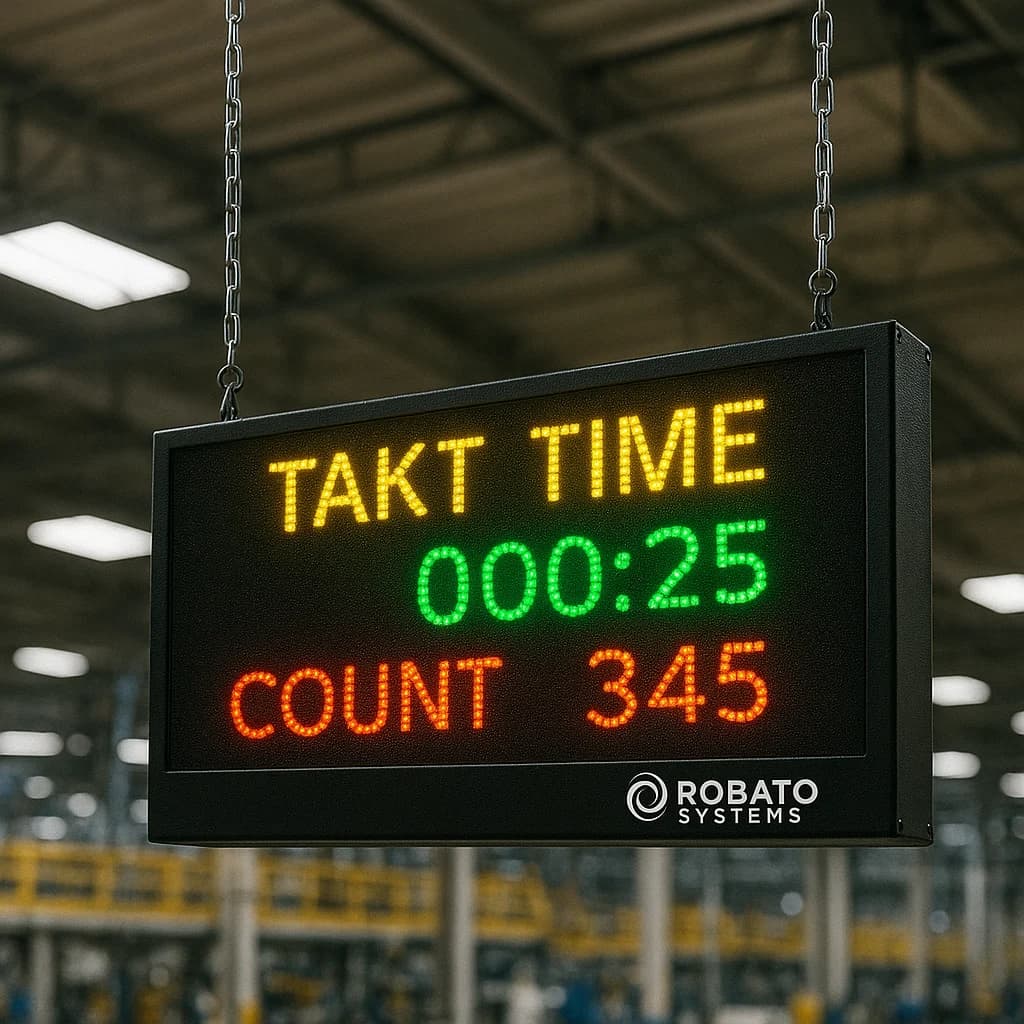
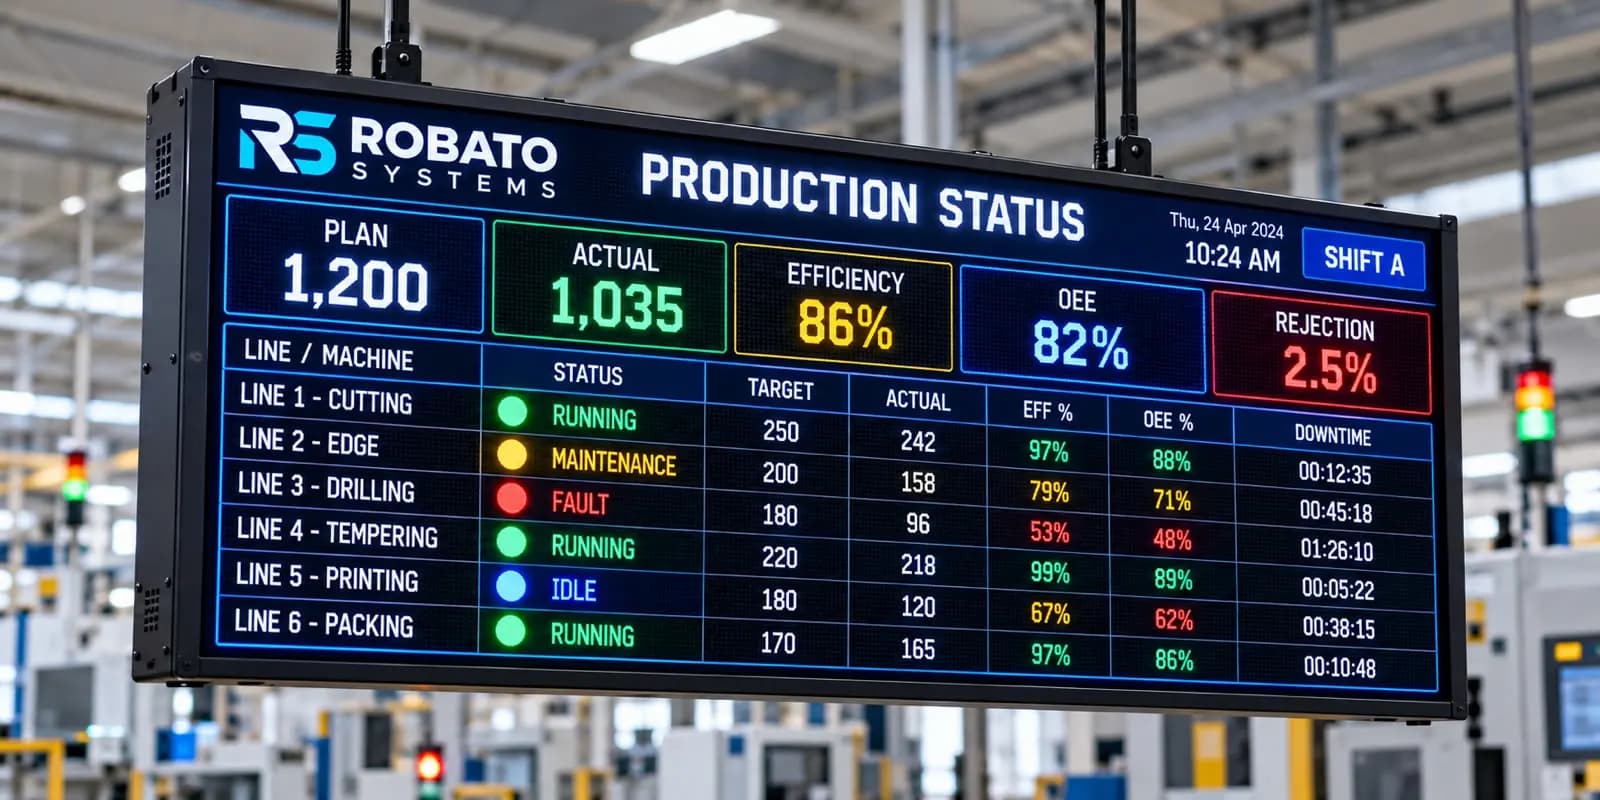
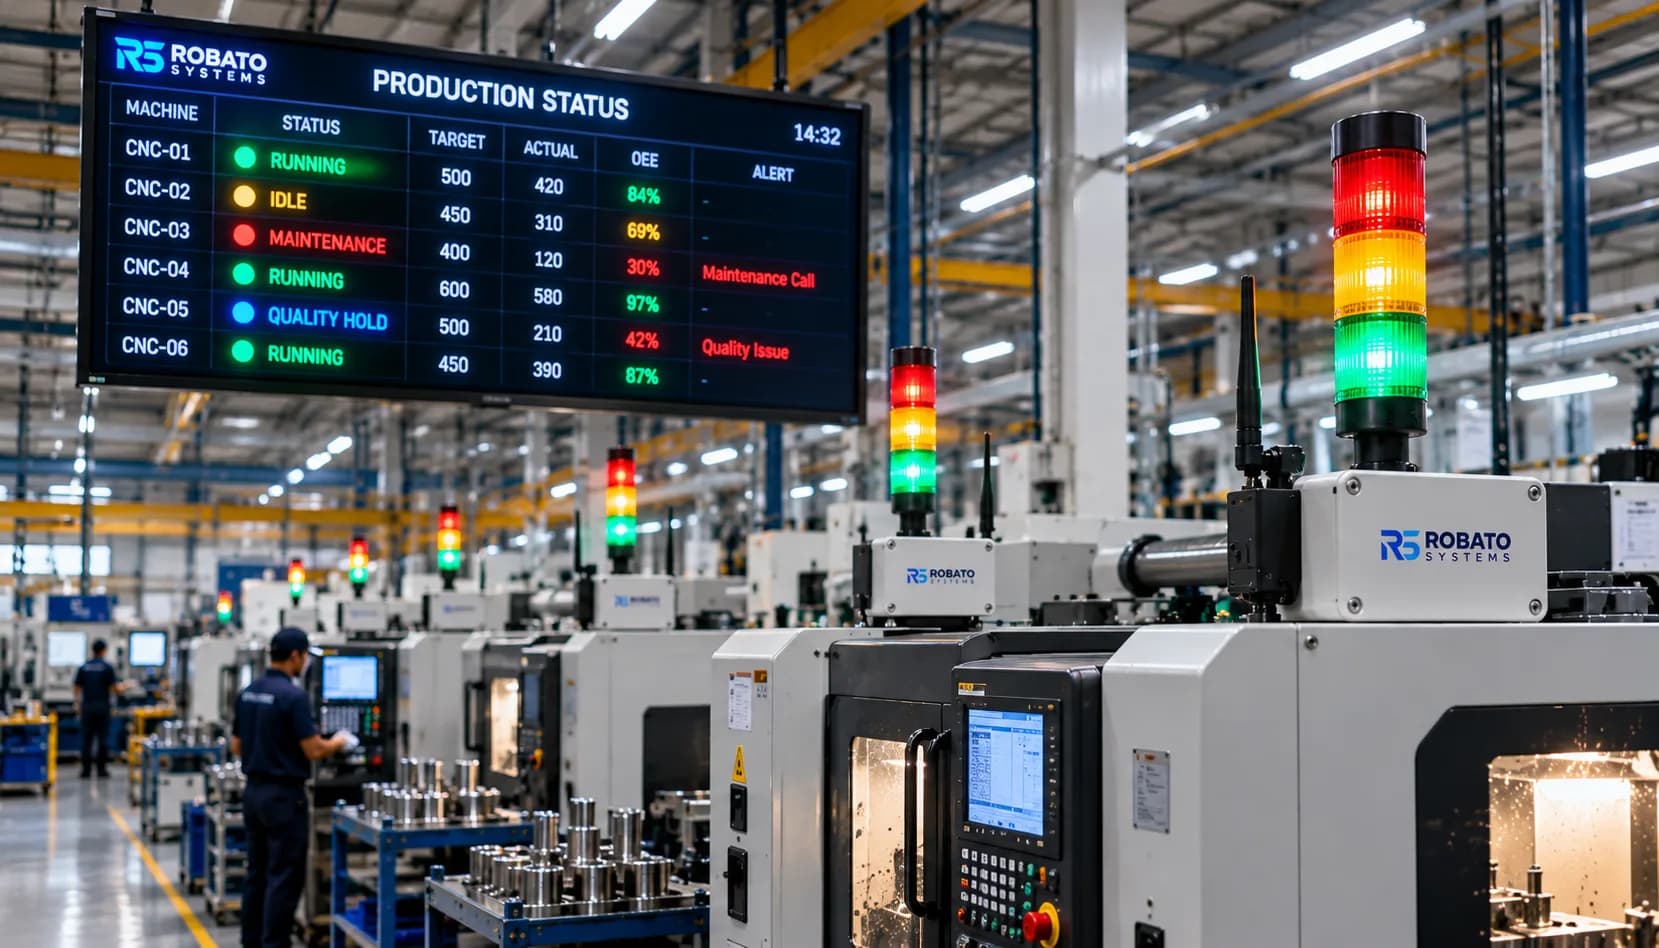
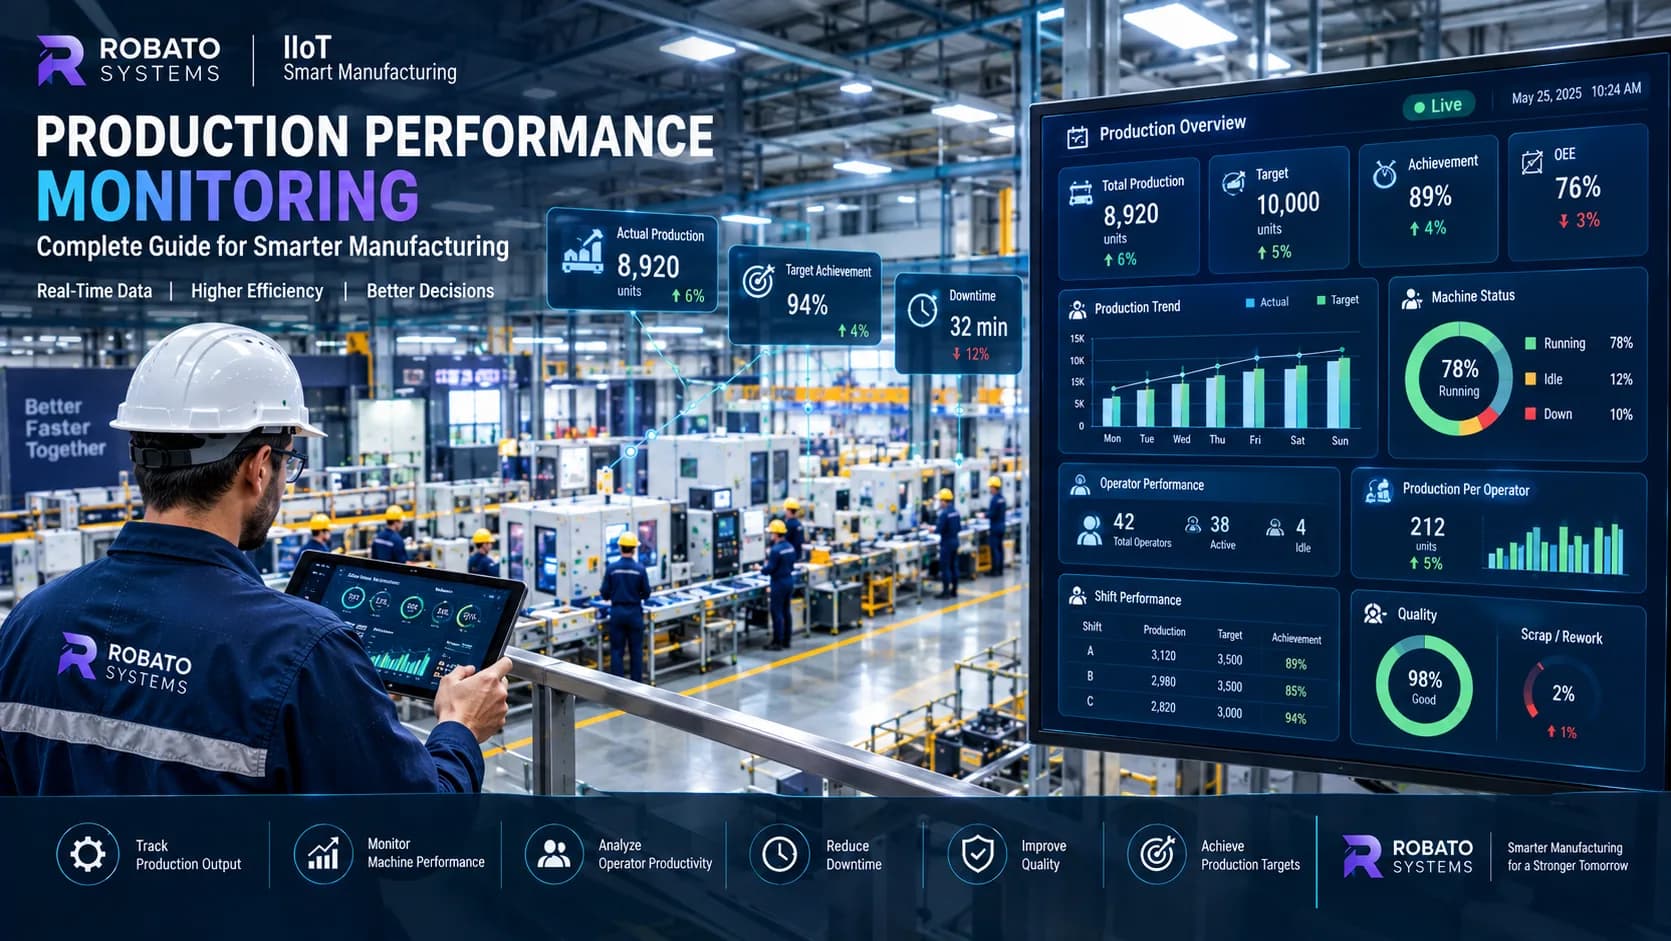
Production Performance Monitoring: Complete Guide
Manufacturing performance depends on how effectively a plant converts machines, materials, labor, and available production time into finished products. When production data is collected manually or reviewed only at the end of a shift, managers may struggle to identify performance losses while they are happening.
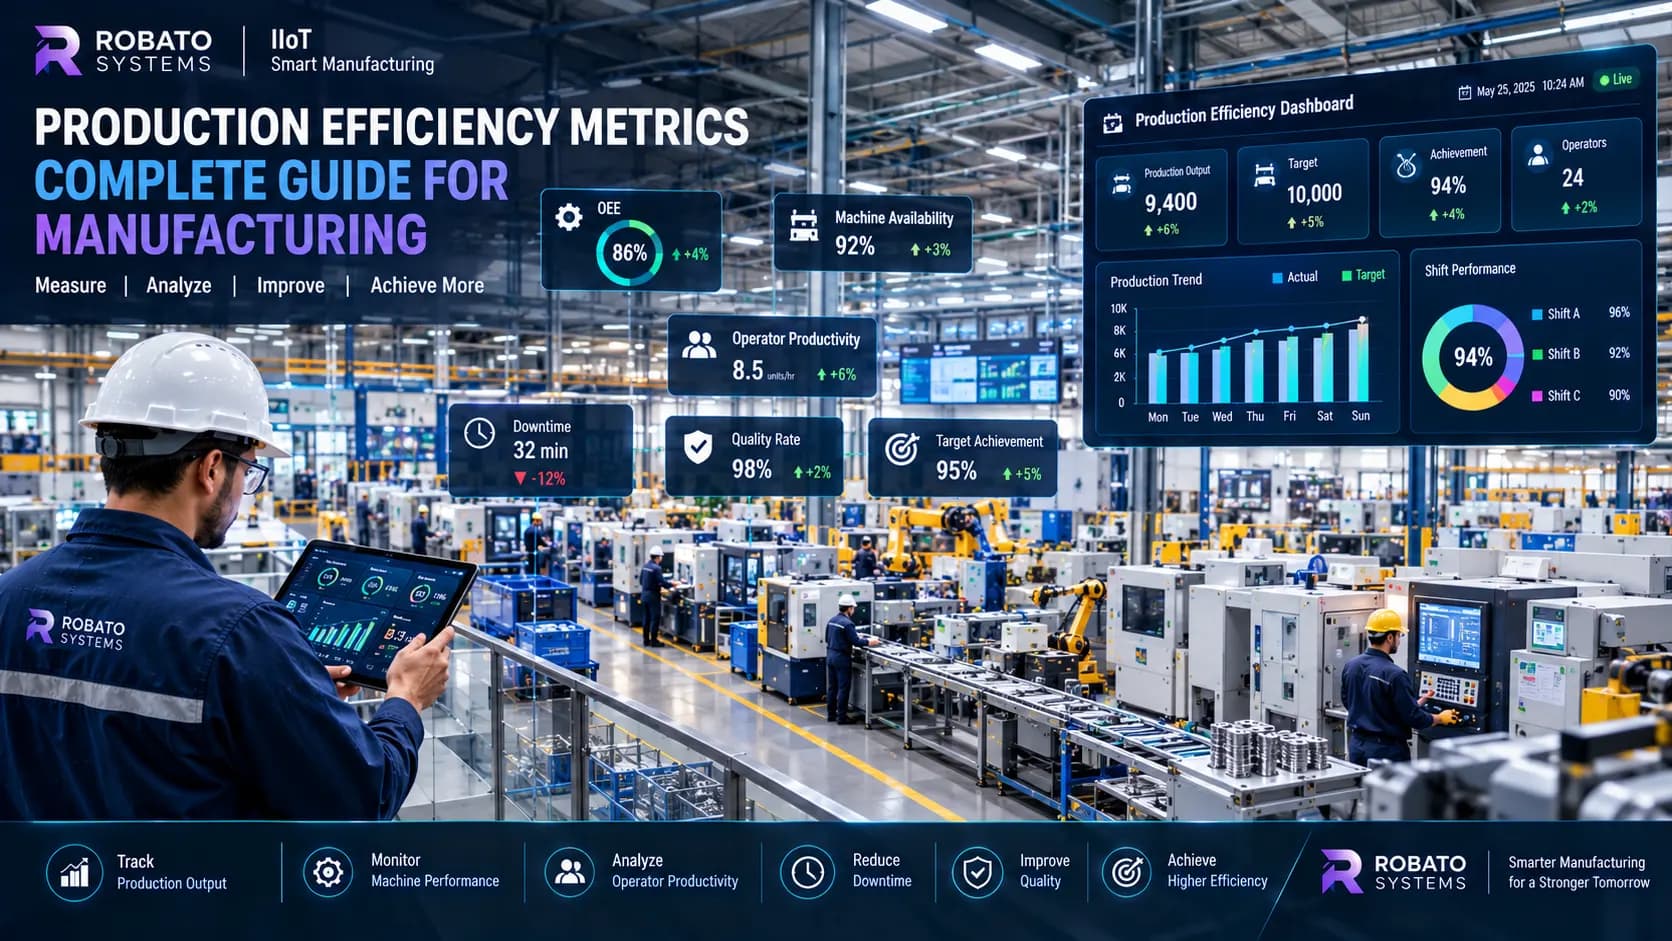
Production Performance Monitoring provides a structured way to track production activity, machine performance, output, downtime, targets, and operational efficiency. With real-time production data and centralized dashboards, manufacturing teams can understand what is happening on the shop floor and respond to problems faster.
Modern production performance monitoring systems can connect machine data, production counts, operator information, downtime events, and performance KPIs into a single digital platform. This makes it easier to compare actual production against targets and identify opportunities for improvement.
What Is Production Performance Monitoring?
Production performance monitoring is the continuous tracking and analysis of manufacturing activities to understand how efficiently a production process is performing.
It can include monitoring:
- Actual production output
- Planned production targets
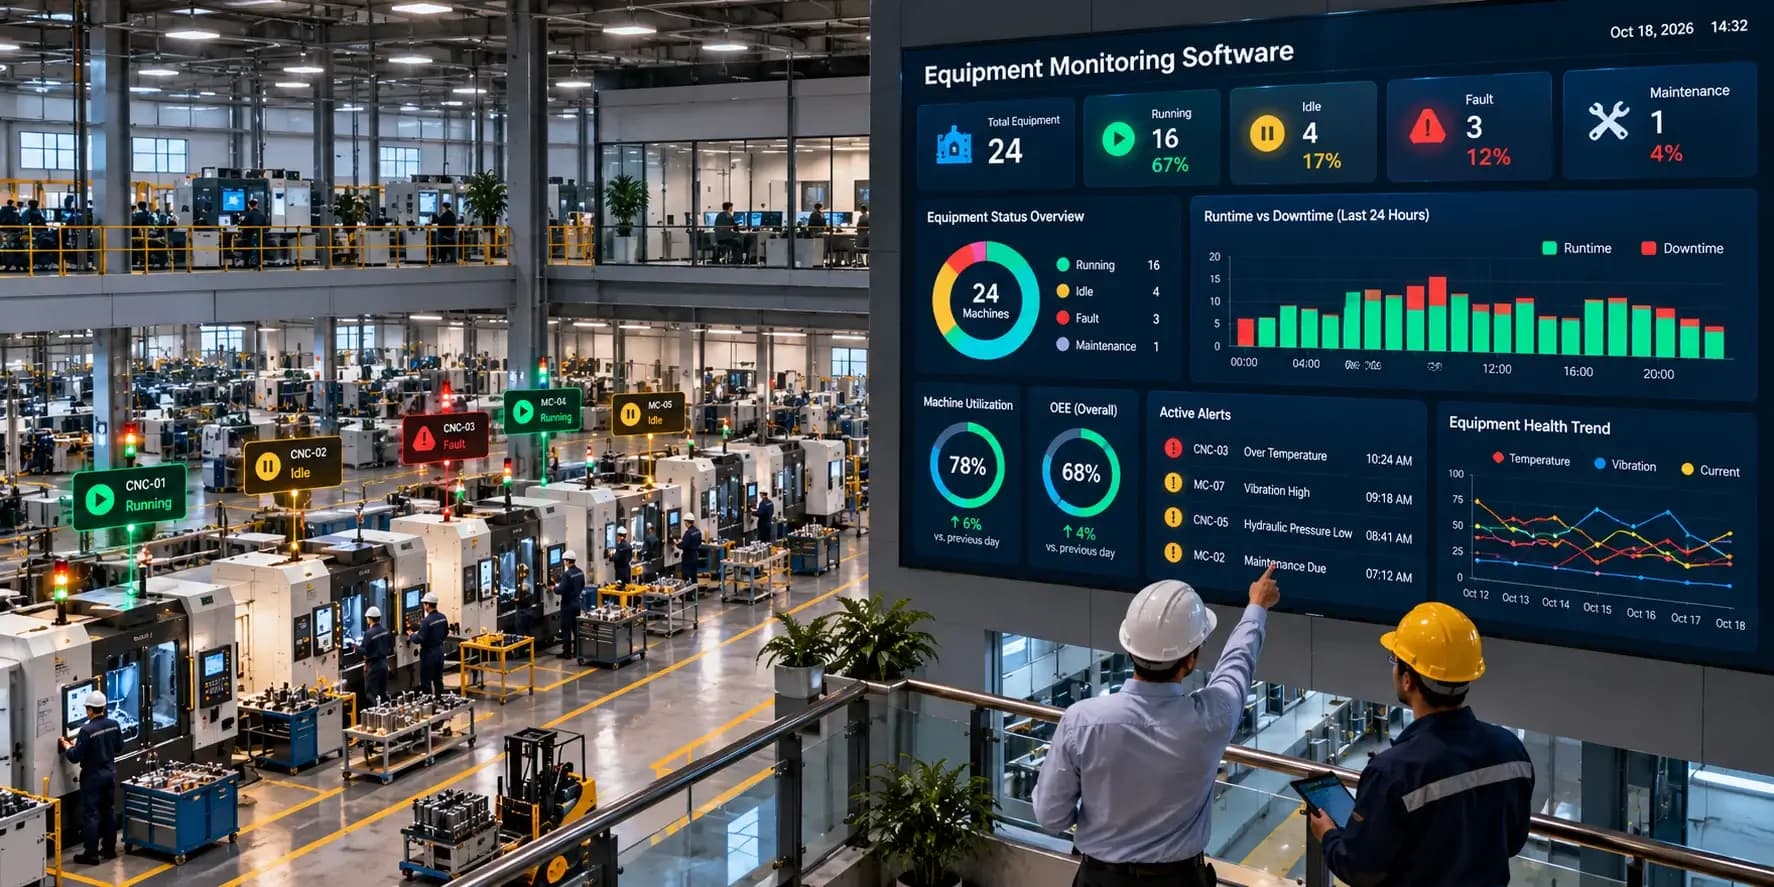
- Machine running status
- Machine downtime
- Production cycle time
- Production speed
- Shift performance
- Operator performance
- Rejected and good production
- Production efficiency OEE
- Availability
- Performance
- Quality
- Production losses
A production performance monitoring system collects relevant shop floor data and presents it through dashboards, reports, alerts, and analytics.
Instead of waiting for manual reports, production managers can access current performance information and investigate deviations much earlier.
Why Is Production Performance Monitoring Important?
Manufacturing plants generate large amounts of operational data every day. The challenge is turning this data into information that production teams can actually use.
Without effective monitoring, common problems can remain hidden:
- Production targets are missed without an immediate explanation.
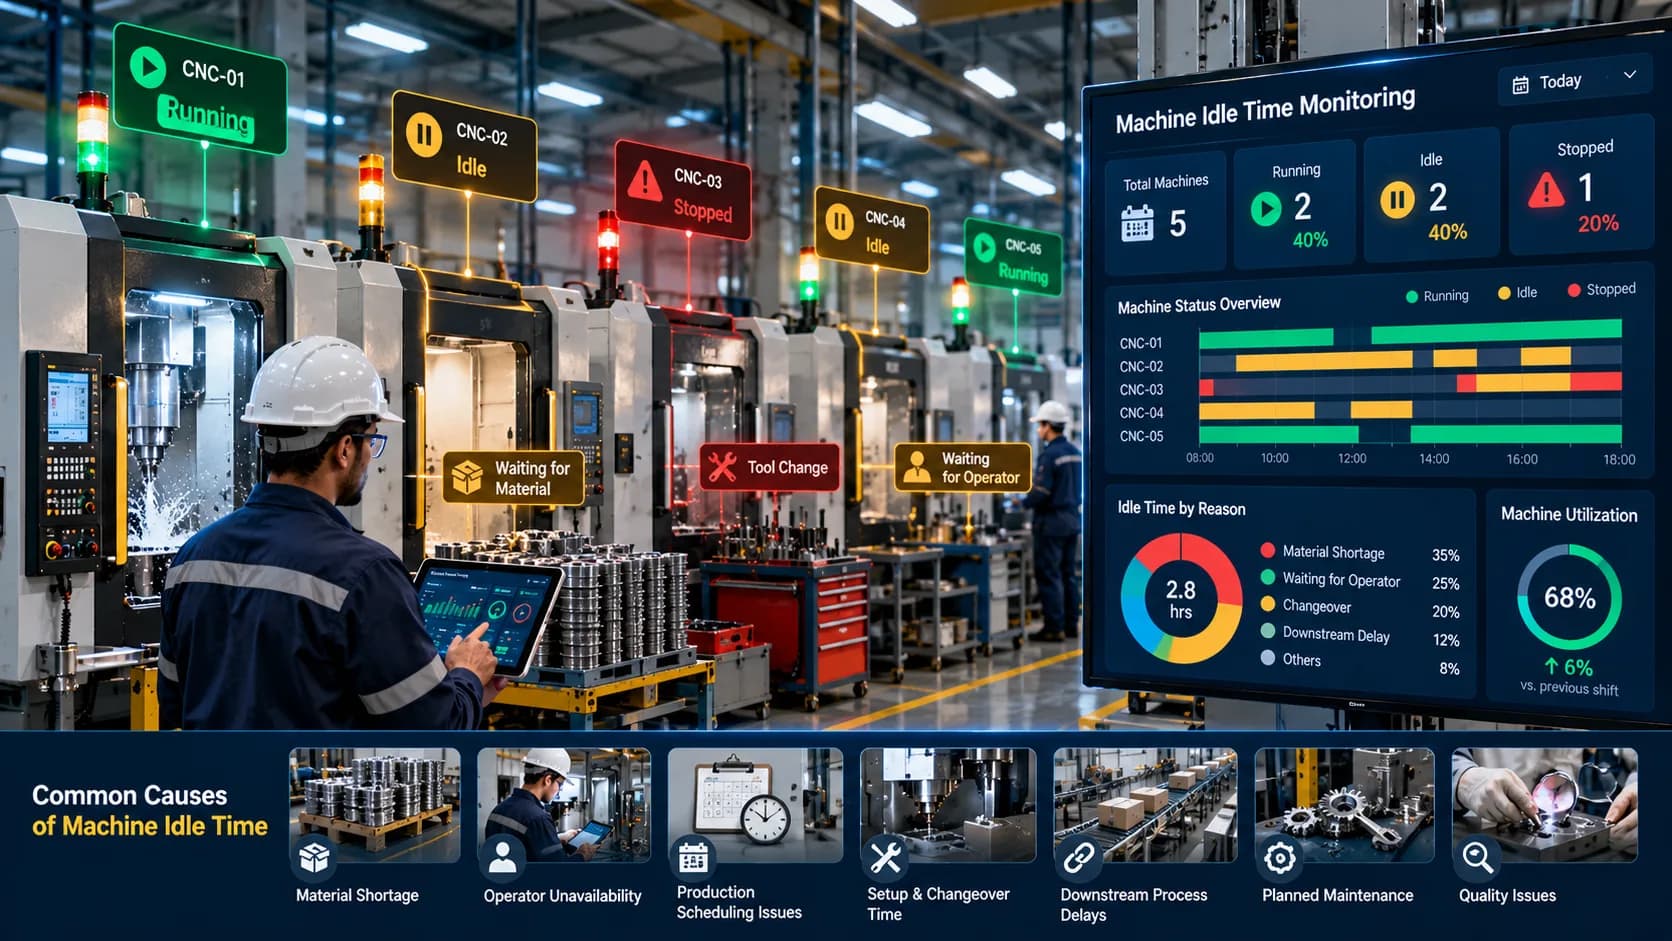
- Machines remain idle for extended periods.
- Minor stoppages accumulate throughout a shift.
- Production losses are identified too late.
- Operators spend time preparing manual reports.
- Supervisors have limited visibility into live production.
- Management receives delayed performance information.
- Bottlenecks are difficult to identify.
Production performance monitoring addresses these challenges by providing greater visibility into the relationship between planned production and actual results.
For example, if a machine is expected to produce 500 units during a shift but has produced only 320 units, the monitoring system can help identify whether the difference is related to downtime, reduced speed, changeovers, quality losses, or another production issue.
Production Performance Monitoring vs Manual Tracking
Many factories still depend on spreadsheets, paper production sheets, whiteboards, or manually entered shift reports.
These methods can provide basic production information, but they often have limitations when real-time visibility is required.
Manual Production Tracking
Manual tracking generally involves:
- Operators record production information.
- Supervisors collect the information.
- Data is entered into spreadsheets or reports.
- Production teams analyze the results.
- Management receives the final report.
By the time the information reaches management, the production condition may have already changed.
Digital Production Performance Monitoring
A digital system can continuously collect and organize production information.
The workflow can look like:
- Machines generate production data.
- Sensors, PLCs, or connected systems capture relevant information.
- Production data is processed.
- The monitoring platform updates the dashboard.
- Supervisors identify deviations.
- Teams take corrective action.
- Historical data is analyzed for continuous improvement.
This reduces the dependence on delayed manual reporting.
Key Metrics in Production Performance Monitoring
An effective production performance monitoring system should provide more than a simple production counter.
1. Actual Production
Actual production represents the quantity produced during a specific period.
It can be analyzed by:
- Machine
- Production line
- Product
- Shift
- Operator
- Hour
- Day
- Plant
Tracking actual production helps teams understand the current output level.
2. Planned vs Actual Production
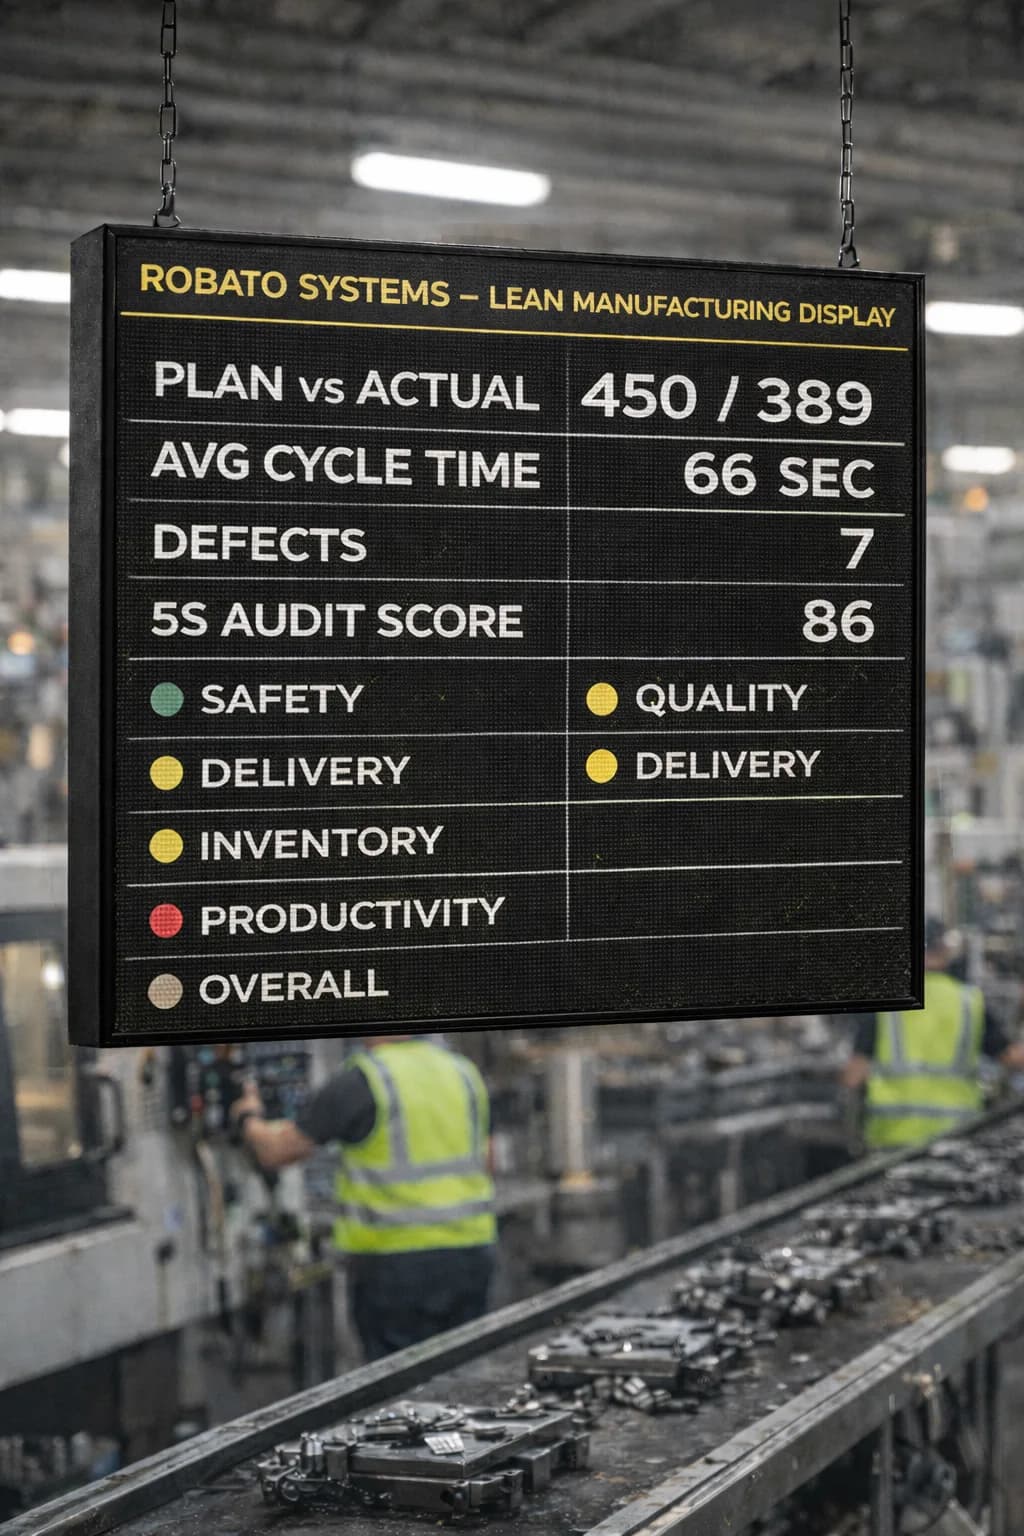
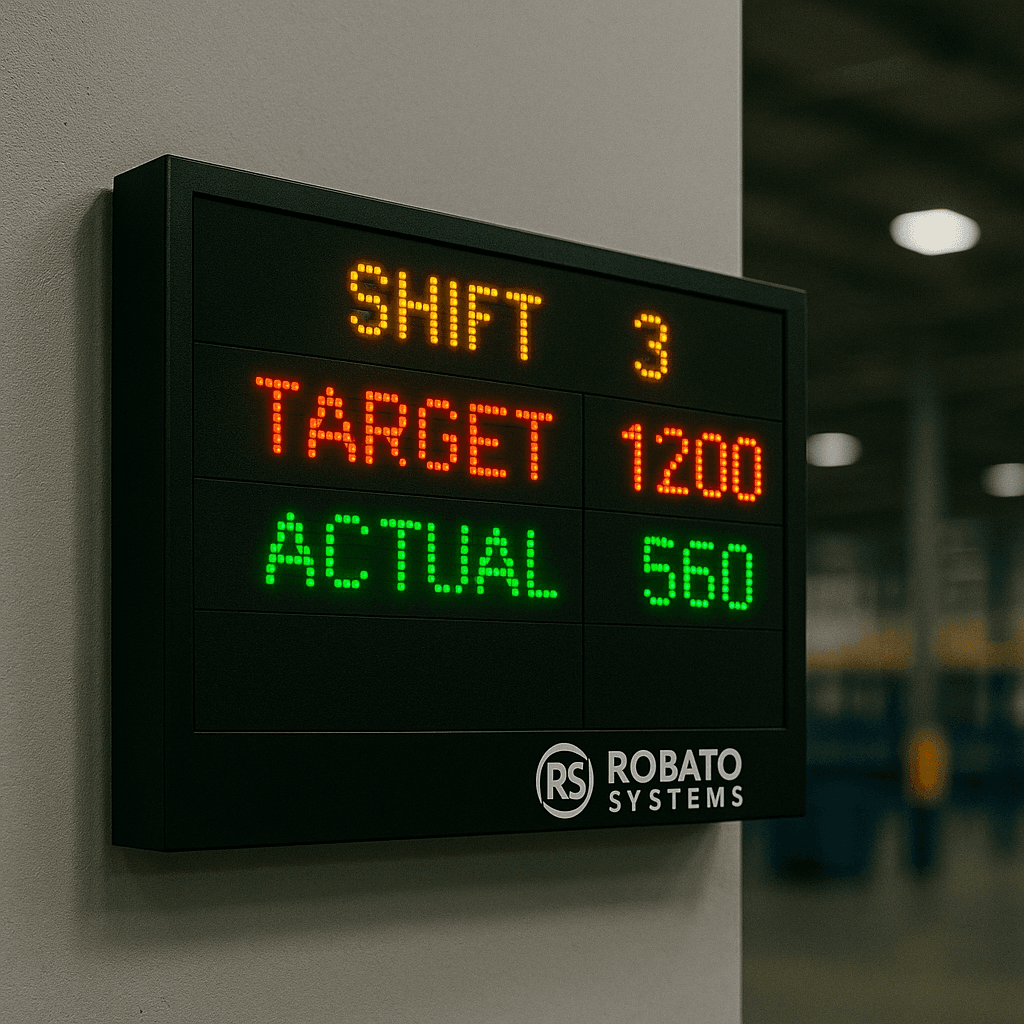
One of the most useful production KPIs is the comparison between planned and actual output.
For example:
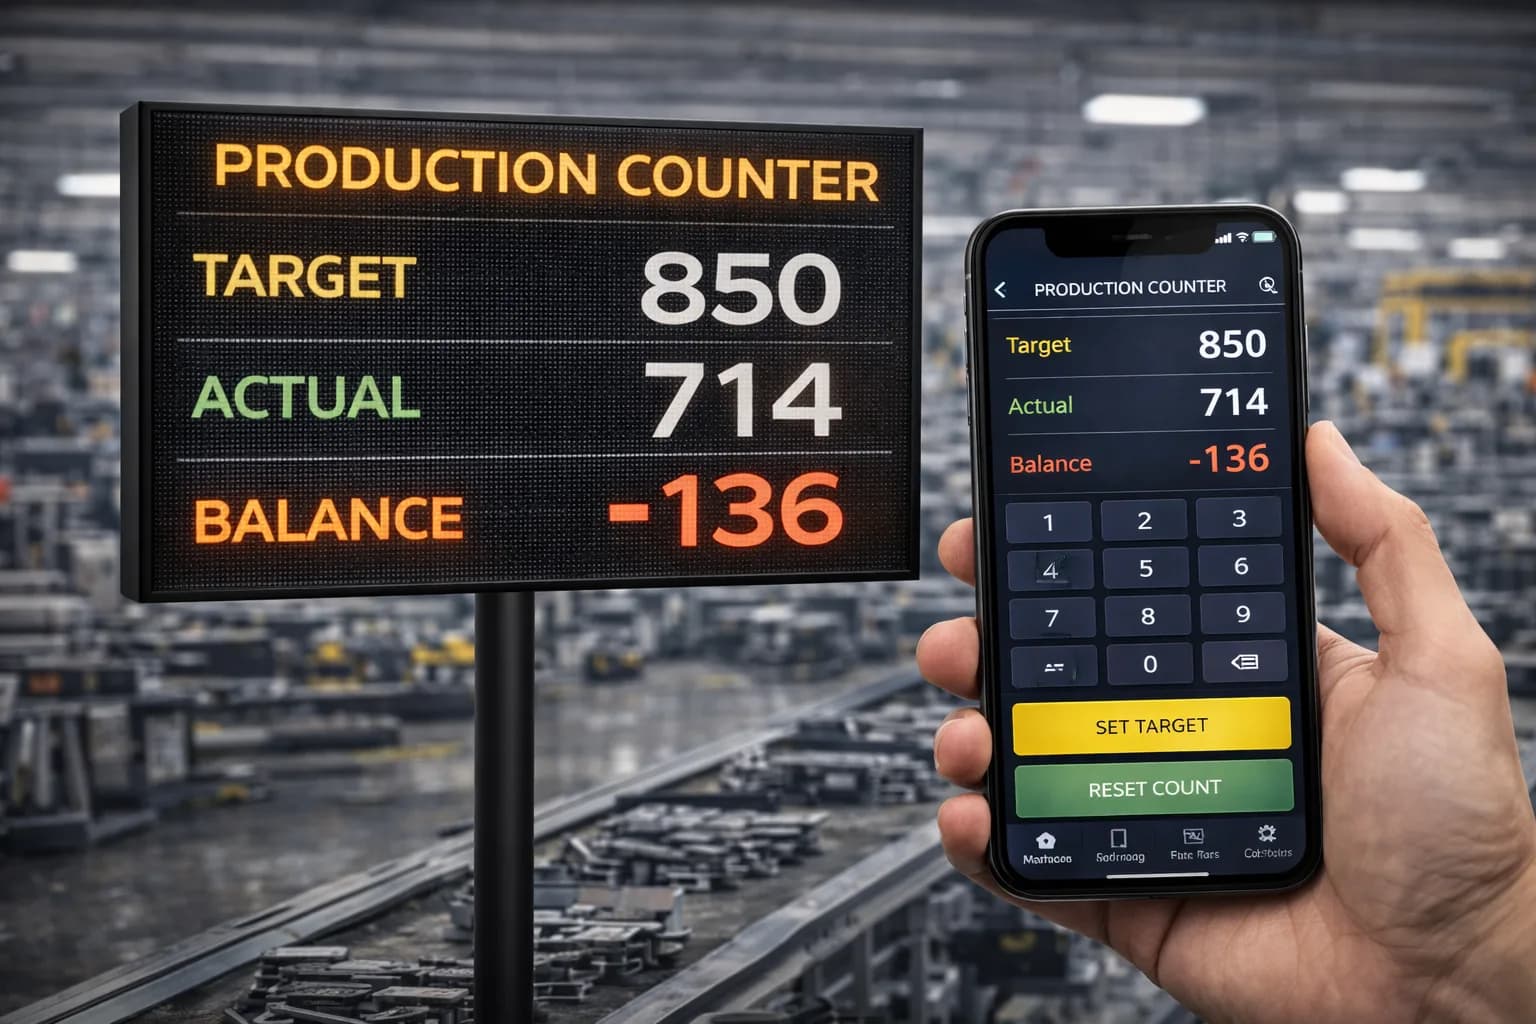
Planned Production: 1,000 units
Actual Production: 850 units
The difference immediately indicates that production is behind the planned target.
However, the important next step is identifying why the gap occurred.
3. Production Achievement
Production achievement indicates how much of the planned target has been completed.
A production monitoring dashboard can show achievement throughout the shift instead of only at the end.
This allows supervisors to see whether production is progressing according to plan.
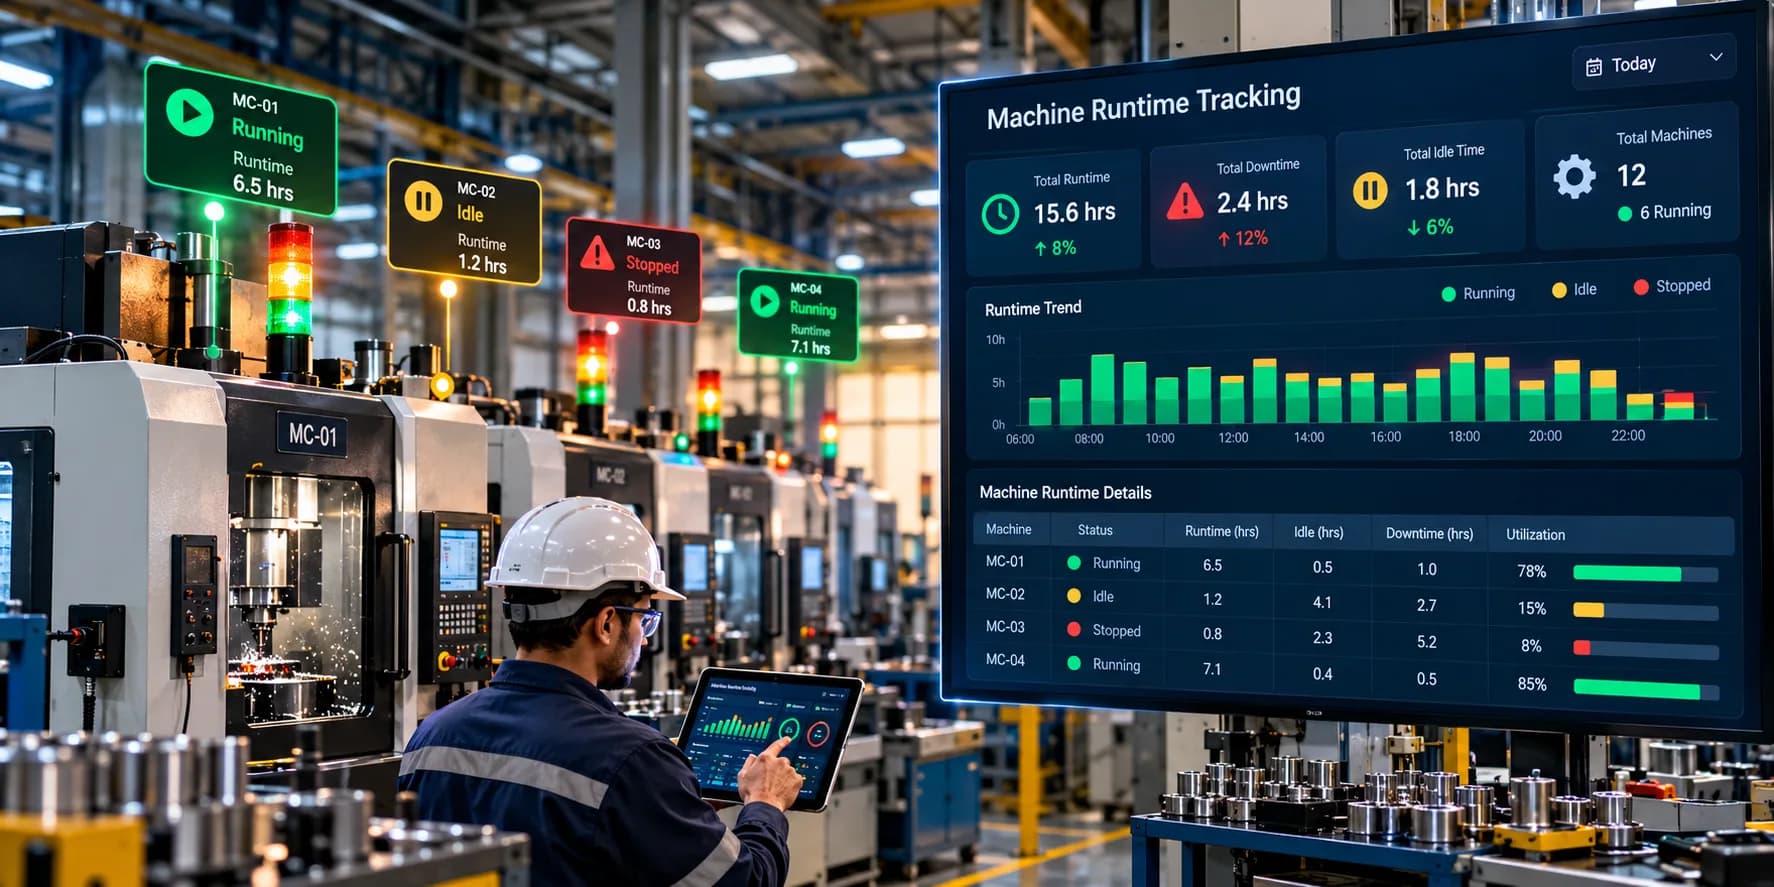
4. Machine Running Time
Machine running time helps determine how long equipment was actively producing.
Comparing running time against available production time can reveal opportunities to improve utilization.
5. Downtime
Downtime is one of the most important performance indicators in manufacturing.
A monitoring system can track:
- Breakdown downtime
- Material shortage
- Changeover
- Quality issues
- Operator-related downtime
- Planned maintenance
- Unplanned stoppages
- Other production losses
Reason-wise downtime analysis makes it easier to prioritize improvement activities.
6. Cycle Time
Cycle time represents the time required to produce one unit or complete a defined production cycle.
Monitoring actual cycle time against the ideal or standard cycle time can help identify slow-running equipment and process inefficiencies.
7. Quality
Production quantity alone does not provide a complete picture of manufacturing performance.
A plant may produce a high number of units while also generating excessive rejection.
Therefore, production monitoring should consider:
- Total production
- Good production
- Rejected production
- Rework
- Scrap
This provides a more meaningful view of production effectiveness.
8. OEE
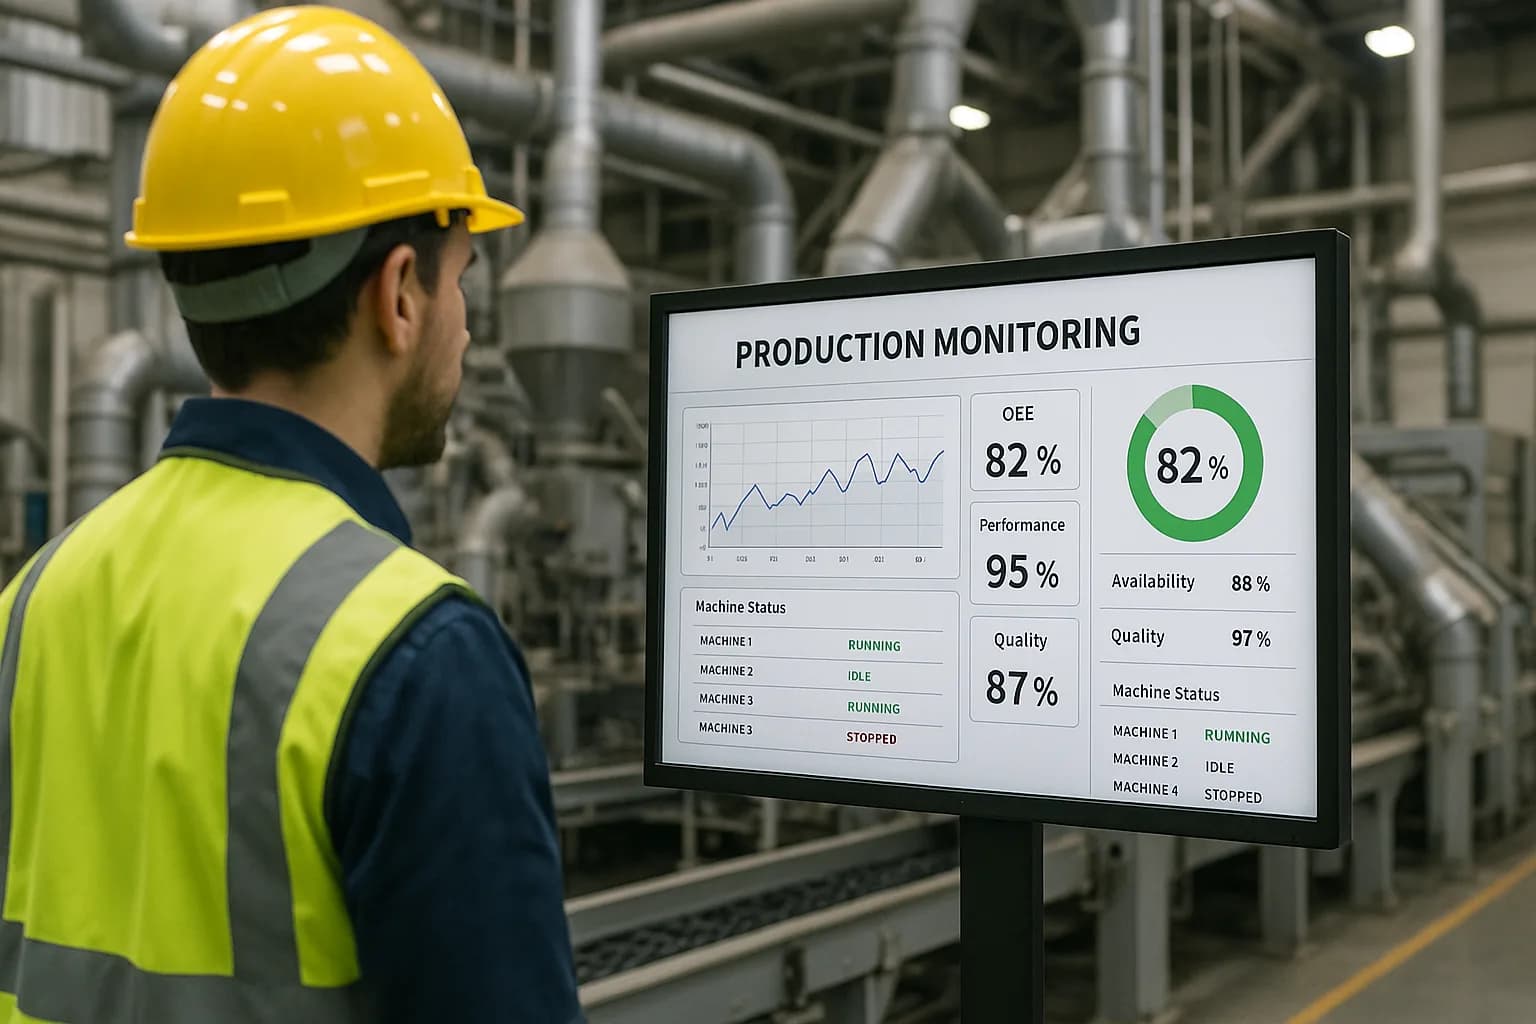
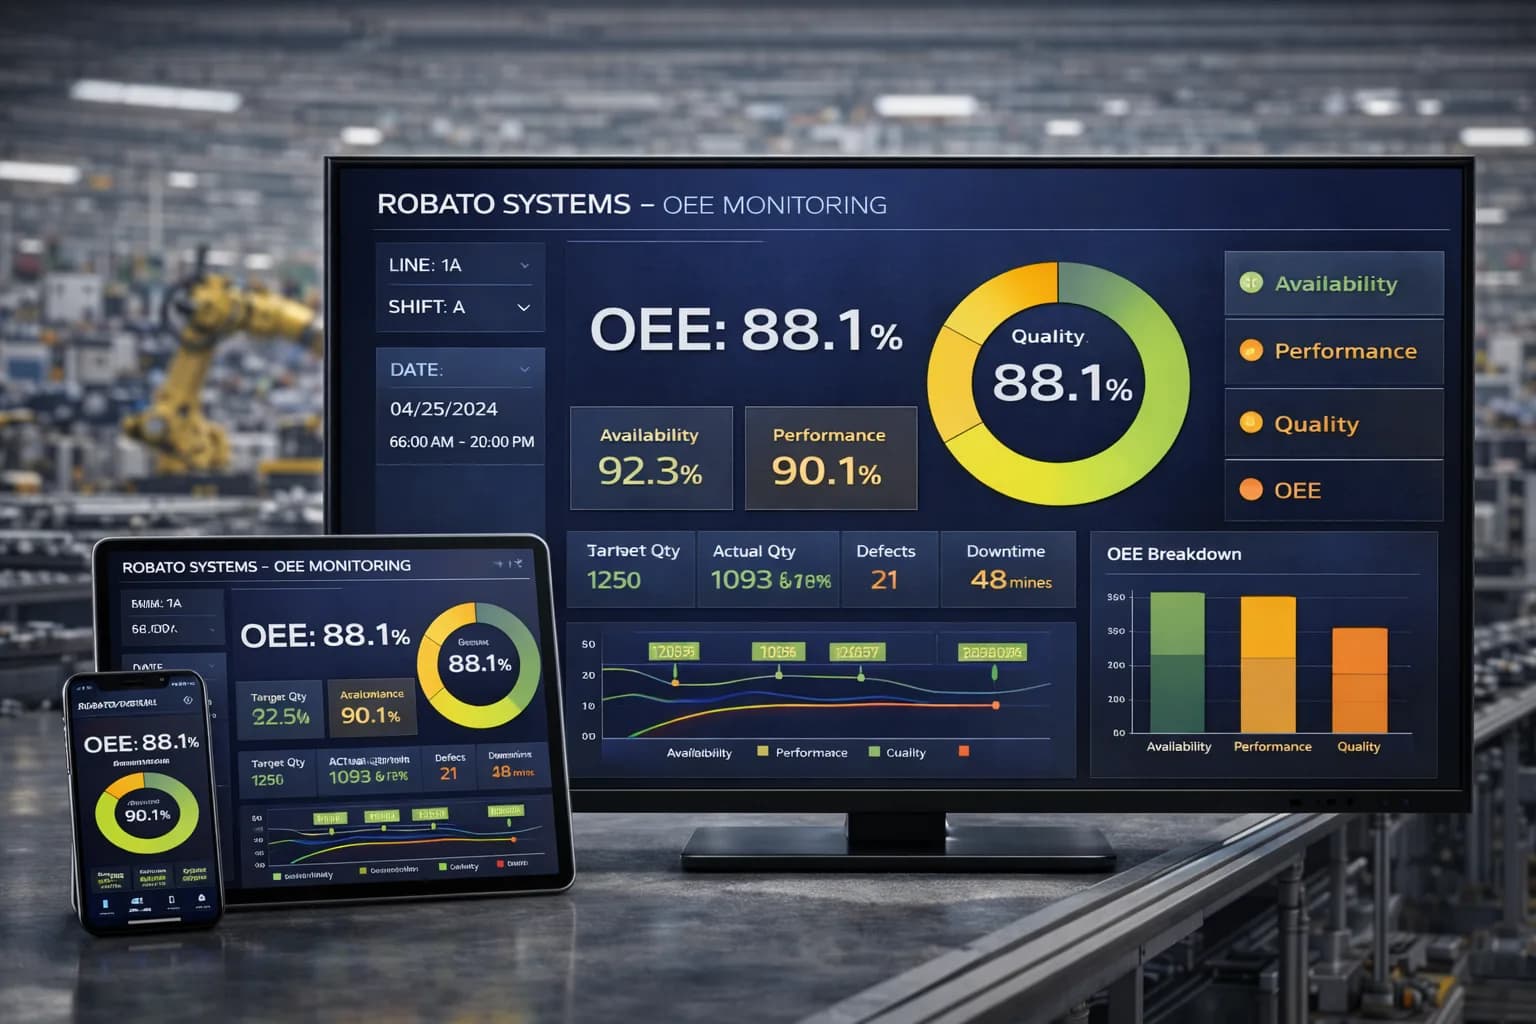
Overall Equipment Effectiveness combines availability, performance, and quality into a widely used manufacturing KPI.
OEE helps organizations understand how effectively equipment is being utilized compared with its potential.
Production performance monitoring and OEE monitoring can therefore complement each other.
Real-Time Production Performance Monitoring
Real-time monitoring is particularly valuable when production conditions change frequently.
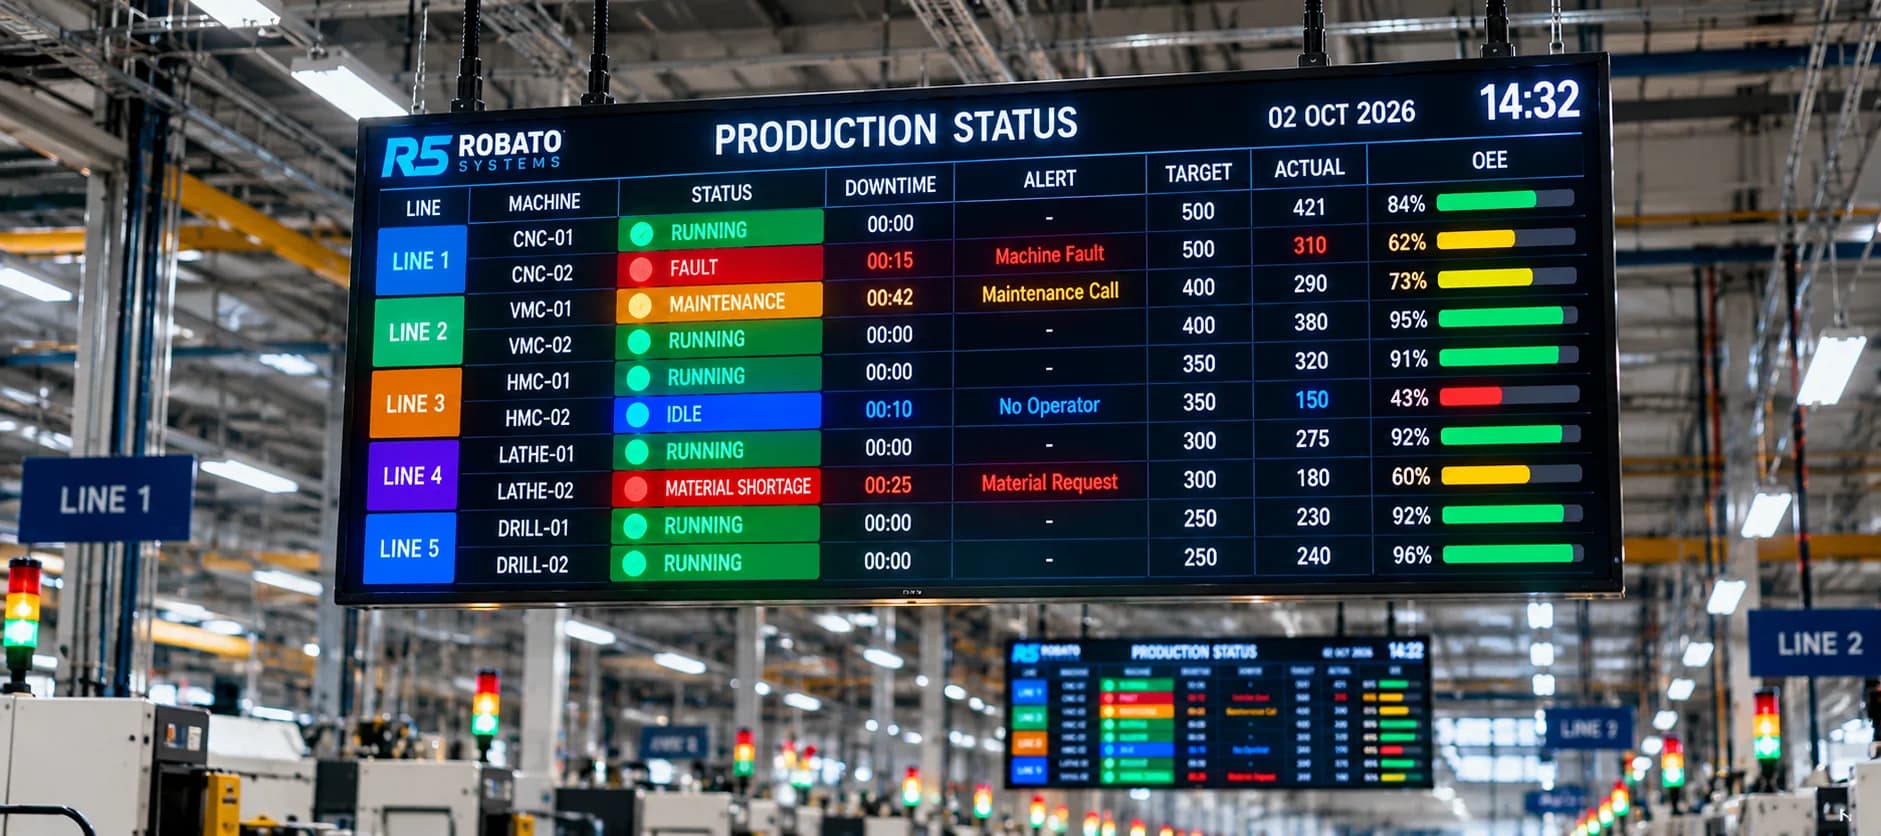
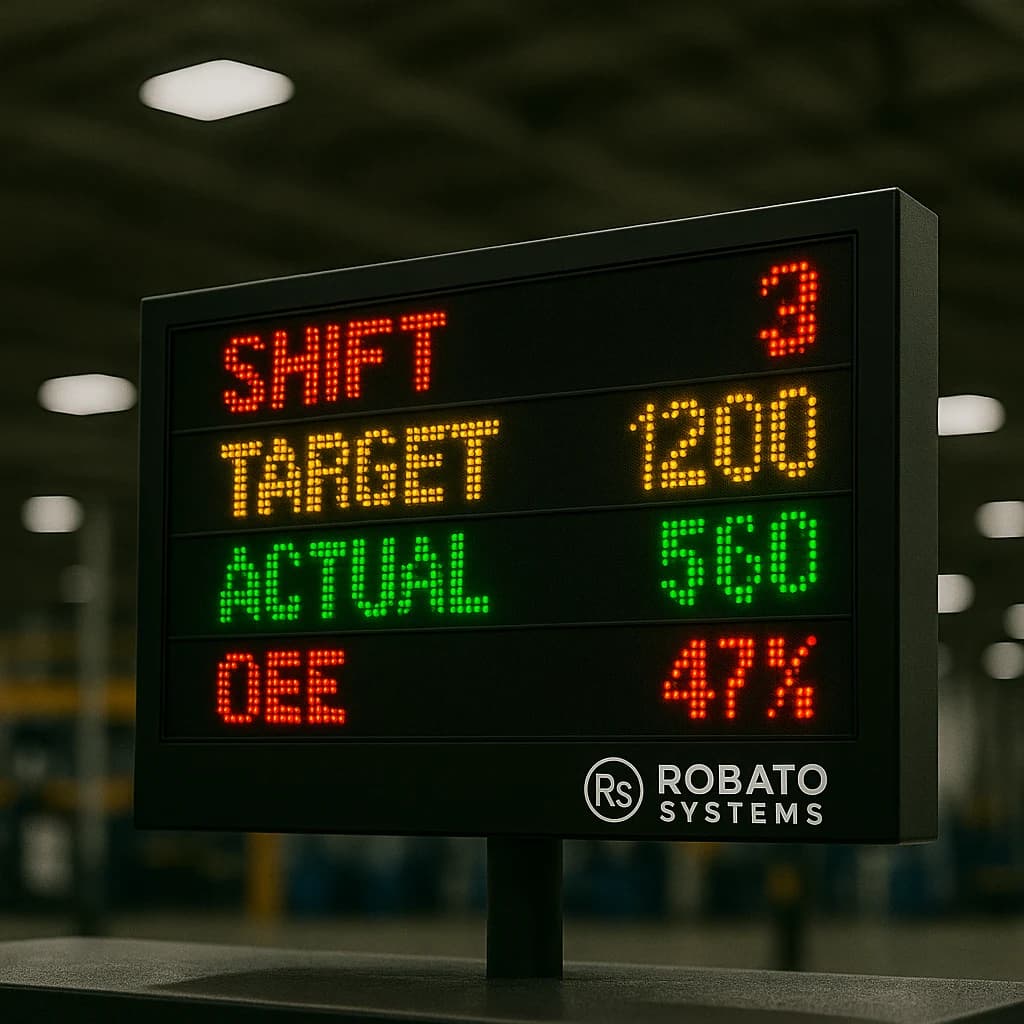
A live dashboard can display information such as:
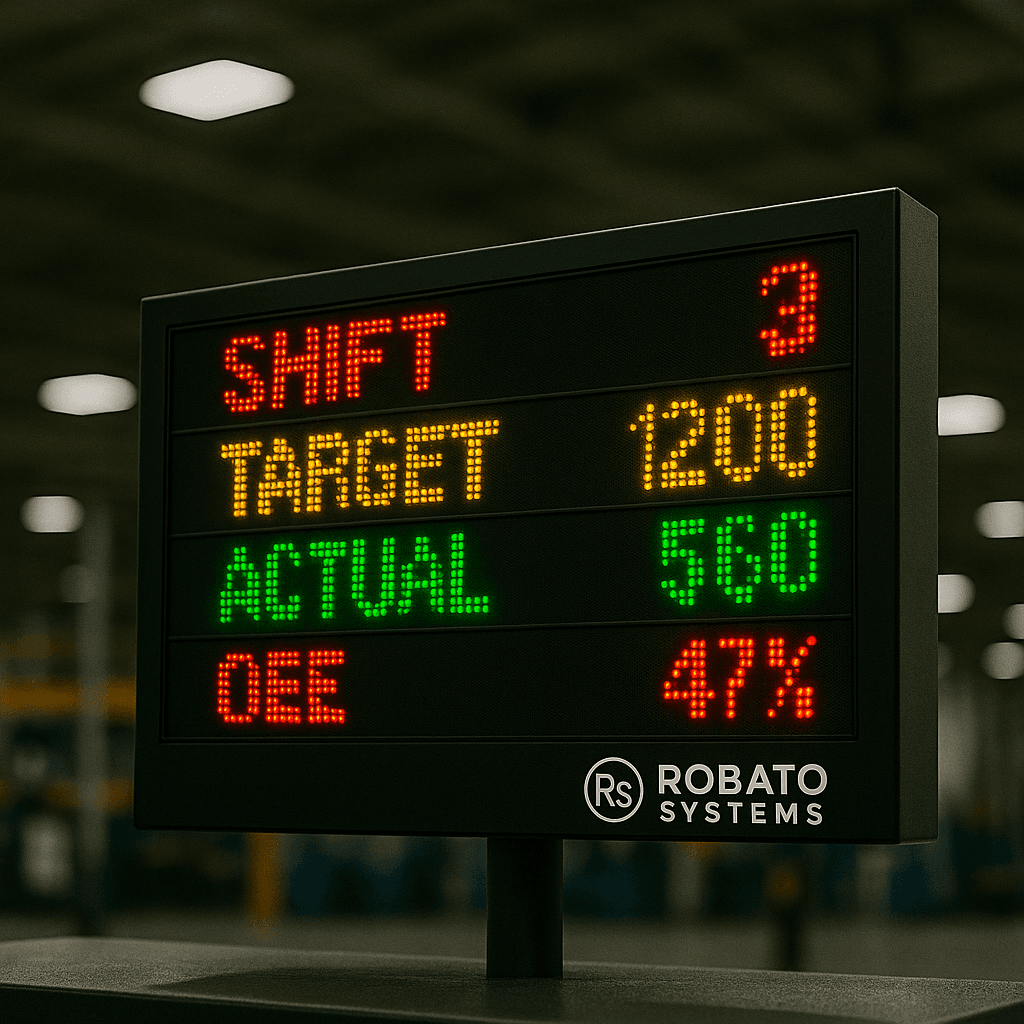
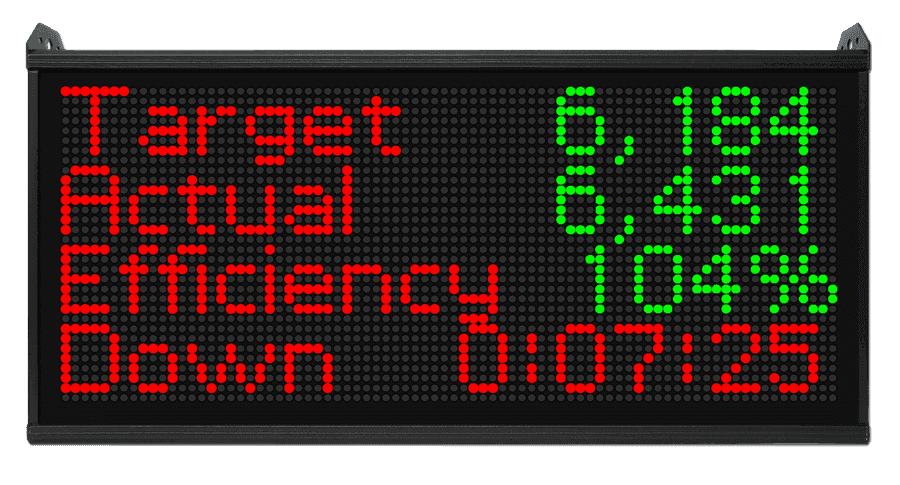
- Current production count
- Target production
- Production achievement
- Machine status
- Running time
- Downtime
- Current shift
- Production rate
- Quality information
- Performance KPIs
Supervisors do not have to wait until the shift ends to understand production performance.
For example, if production falls significantly below the expected hourly rate, the supervisor can investigate the issue while the production line is still operating.
How a Production Performance Monitoring System Works
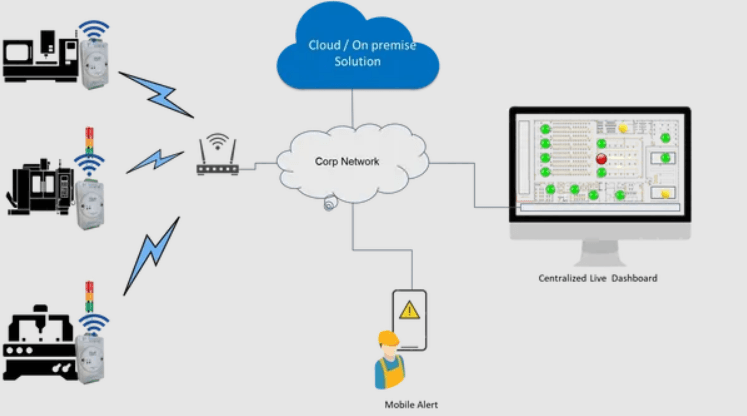
A typical production monitoring architecture consists of several stages.
Step 1: Data Collection
Production information can be collected from:
- PLCs
- Machines
- Sensors
- Industrial controllers
- Production counters
- Operator terminals
- Existing manufacturing systems
The exact data source depends on the machines and production environment.
Step 2: Data Processing
The collected information is processed into meaningful production events and metrics.
For example, raw machine signals can be transformed into:
- Running status
- Stoppage status
- Production counts
- Cycle information
- Downtime duration
Step 3: Data Storage
Production information can be stored for historical analysis.
Historical data allows teams to compare:
- Different shifts
- Different machines
- Different products
- Different production days
- Different plants
- Different operators
Step 4: Dashboard Visualization
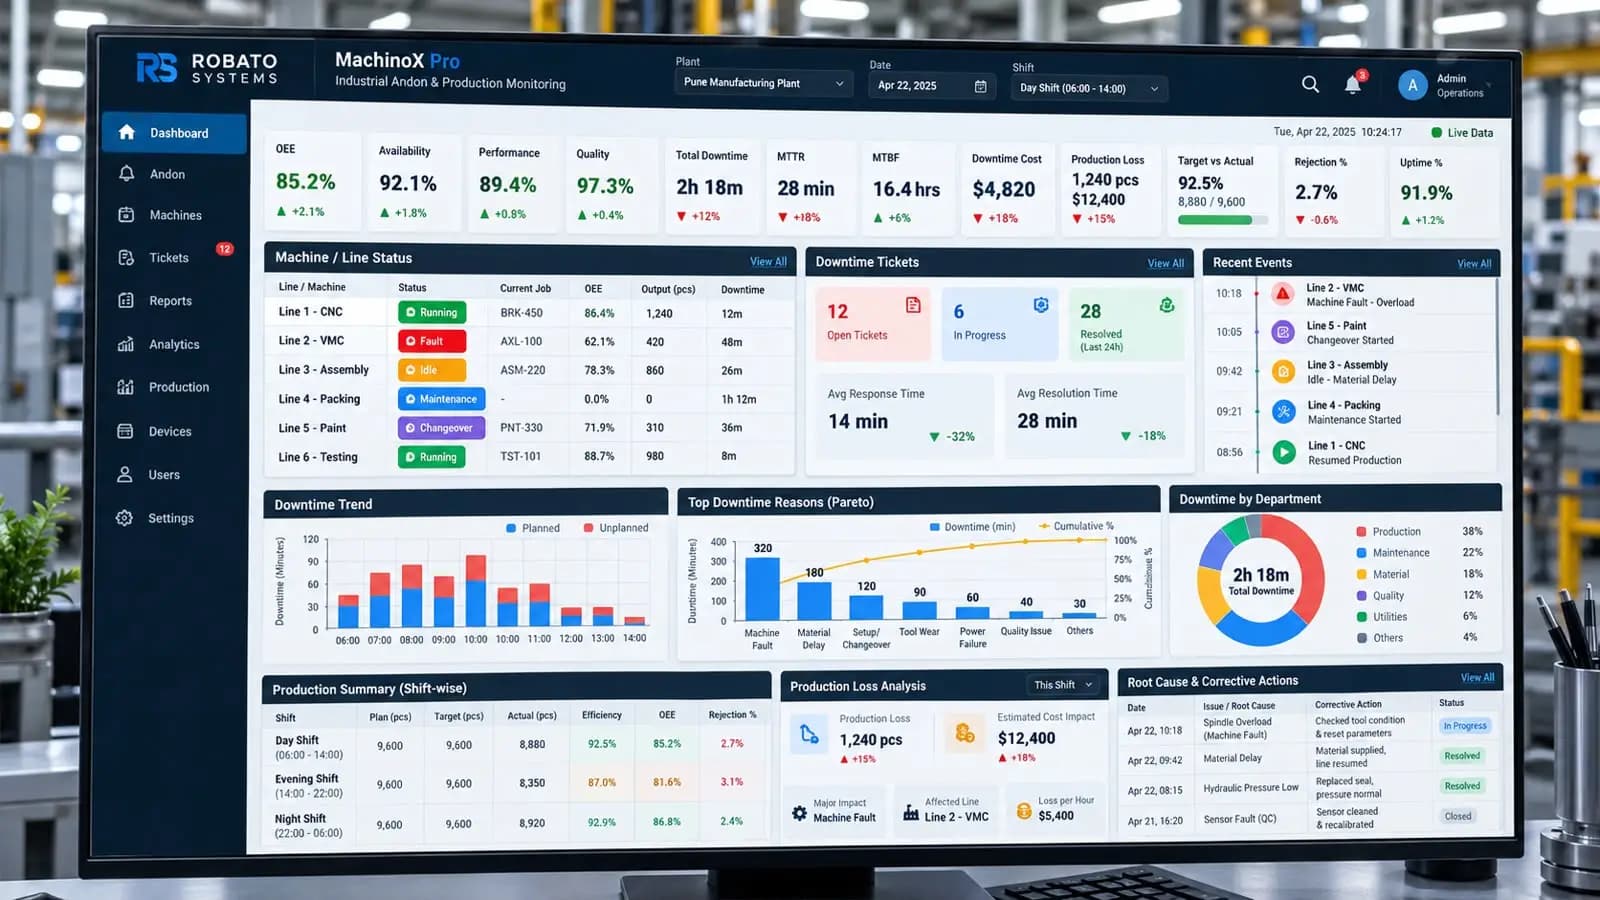
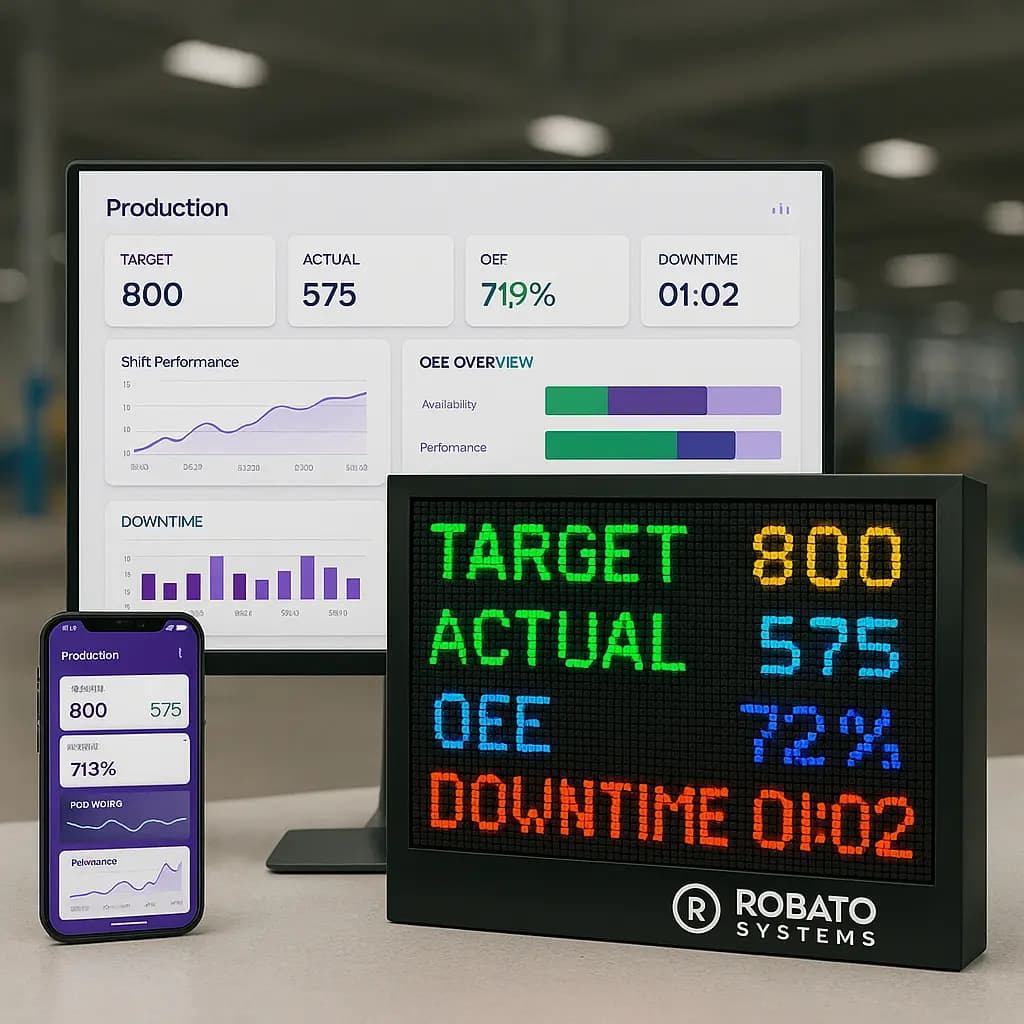
The processed information is displayed through production dashboards.
A useful dashboard should make important information easy to understand without requiring managers to analyze large spreadsheets.
Step 5: Analysis and Action
The final objective is not simply collecting data.
The objective is using production information to make better operational decisions.
Teams can identify production losses, investigate causes, implement corrective actions, and monitor whether performance improves.
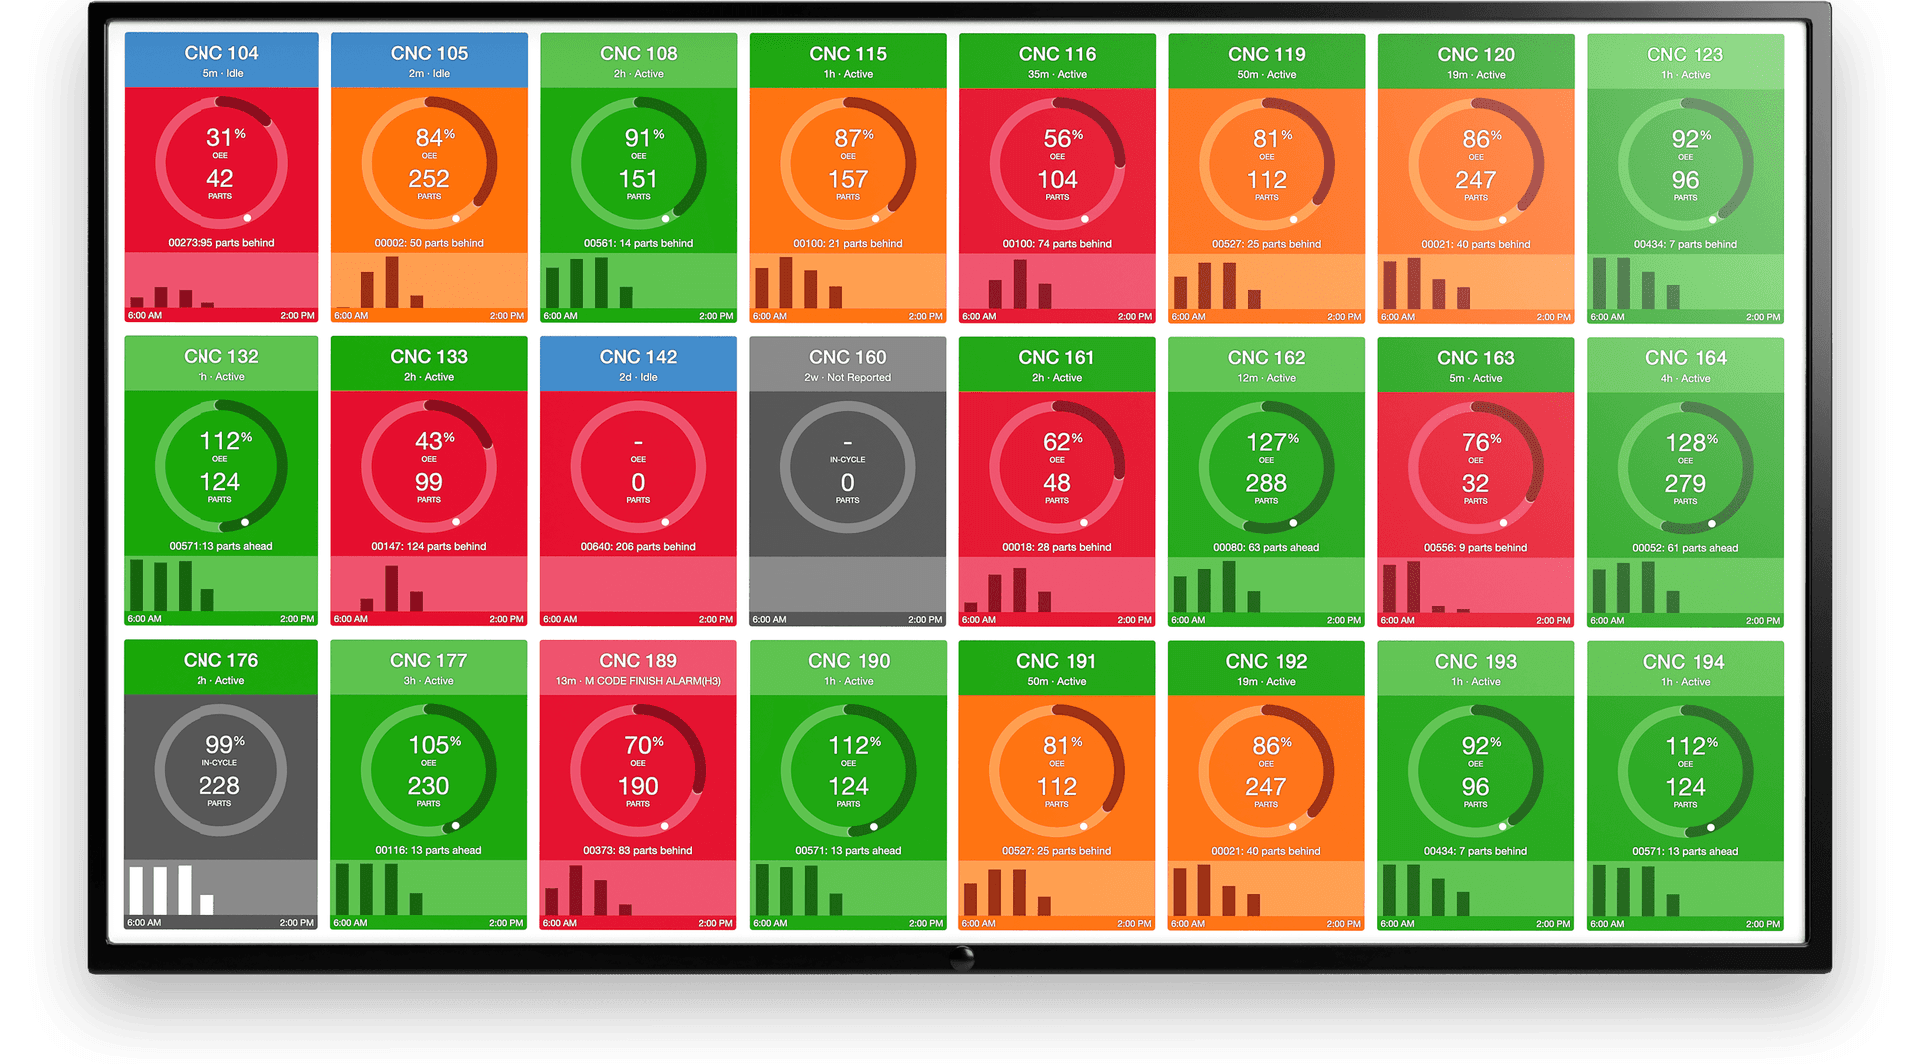
Production Performance Dashboard
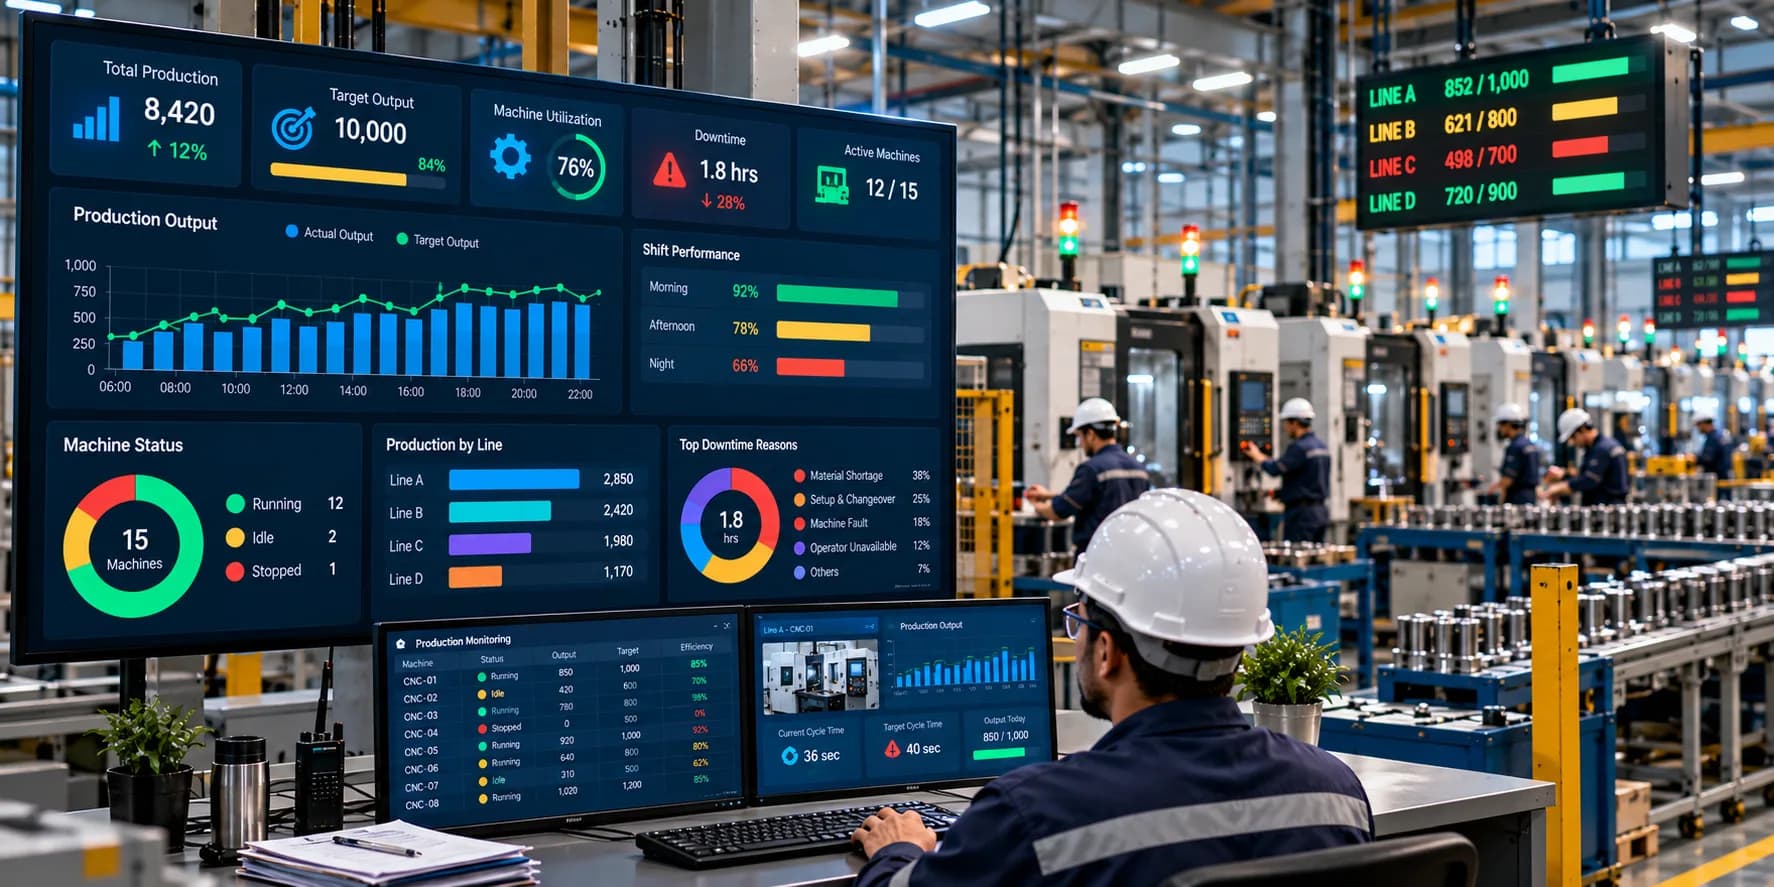
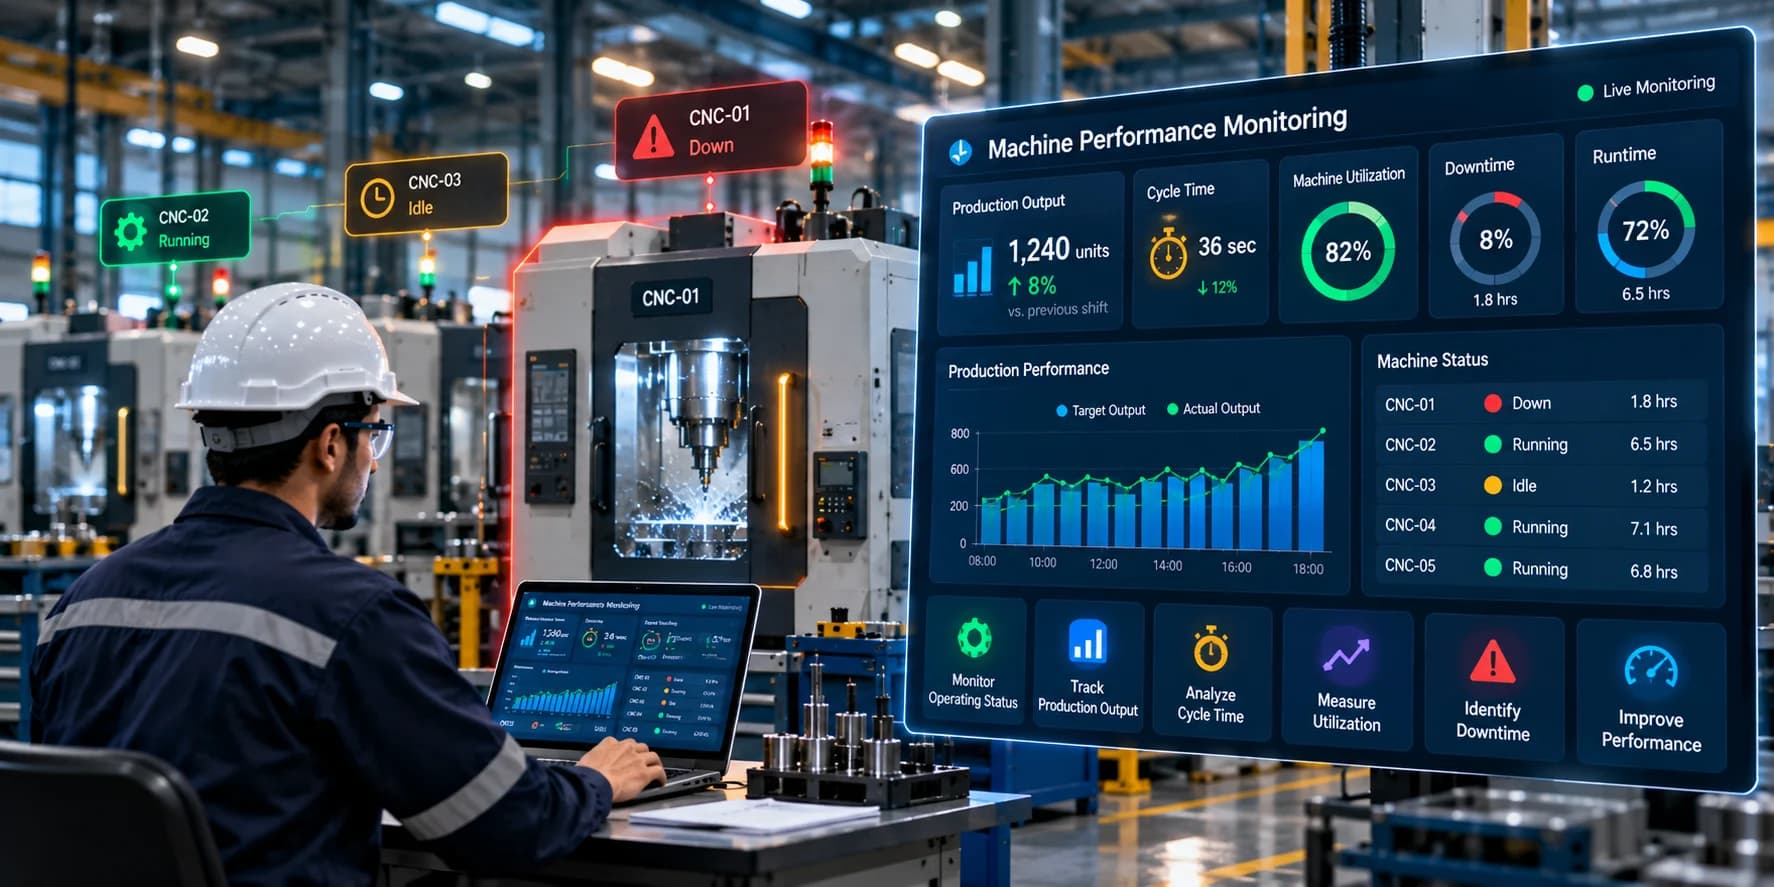
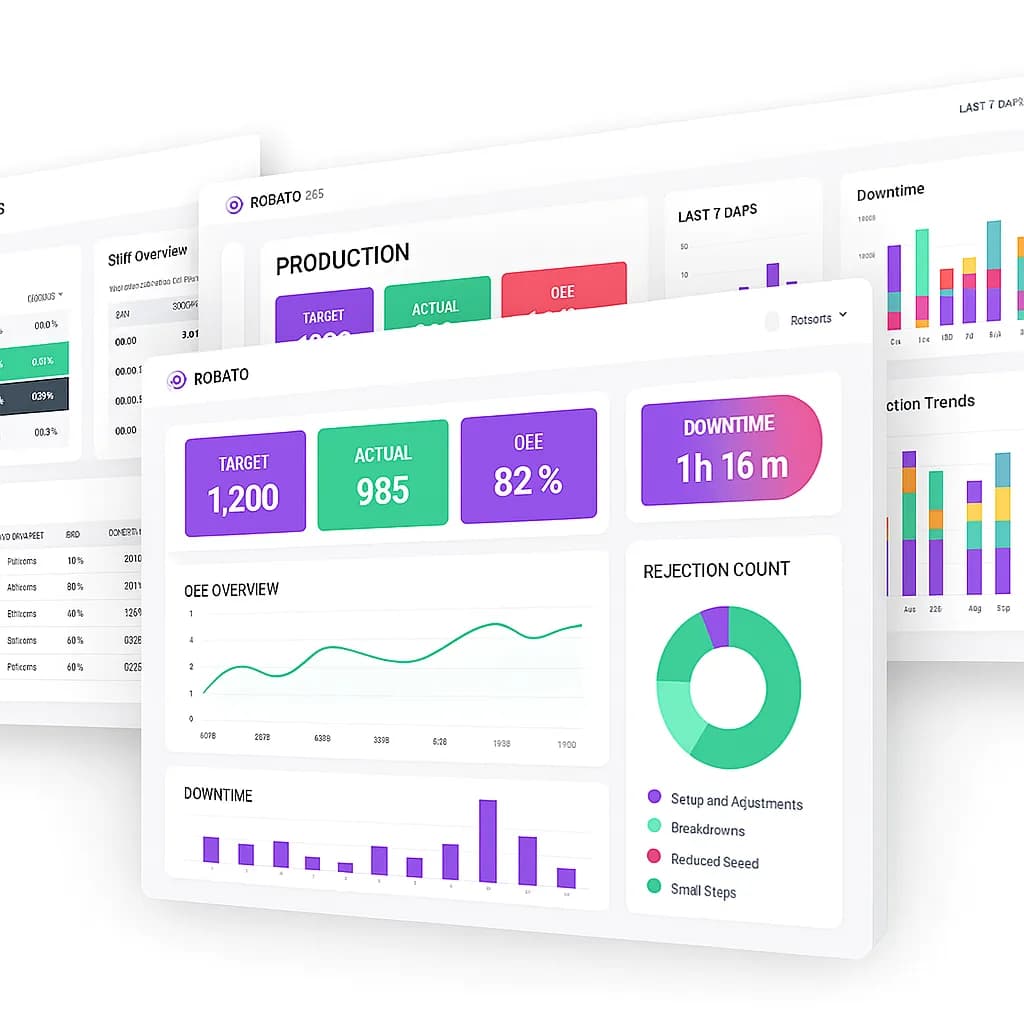
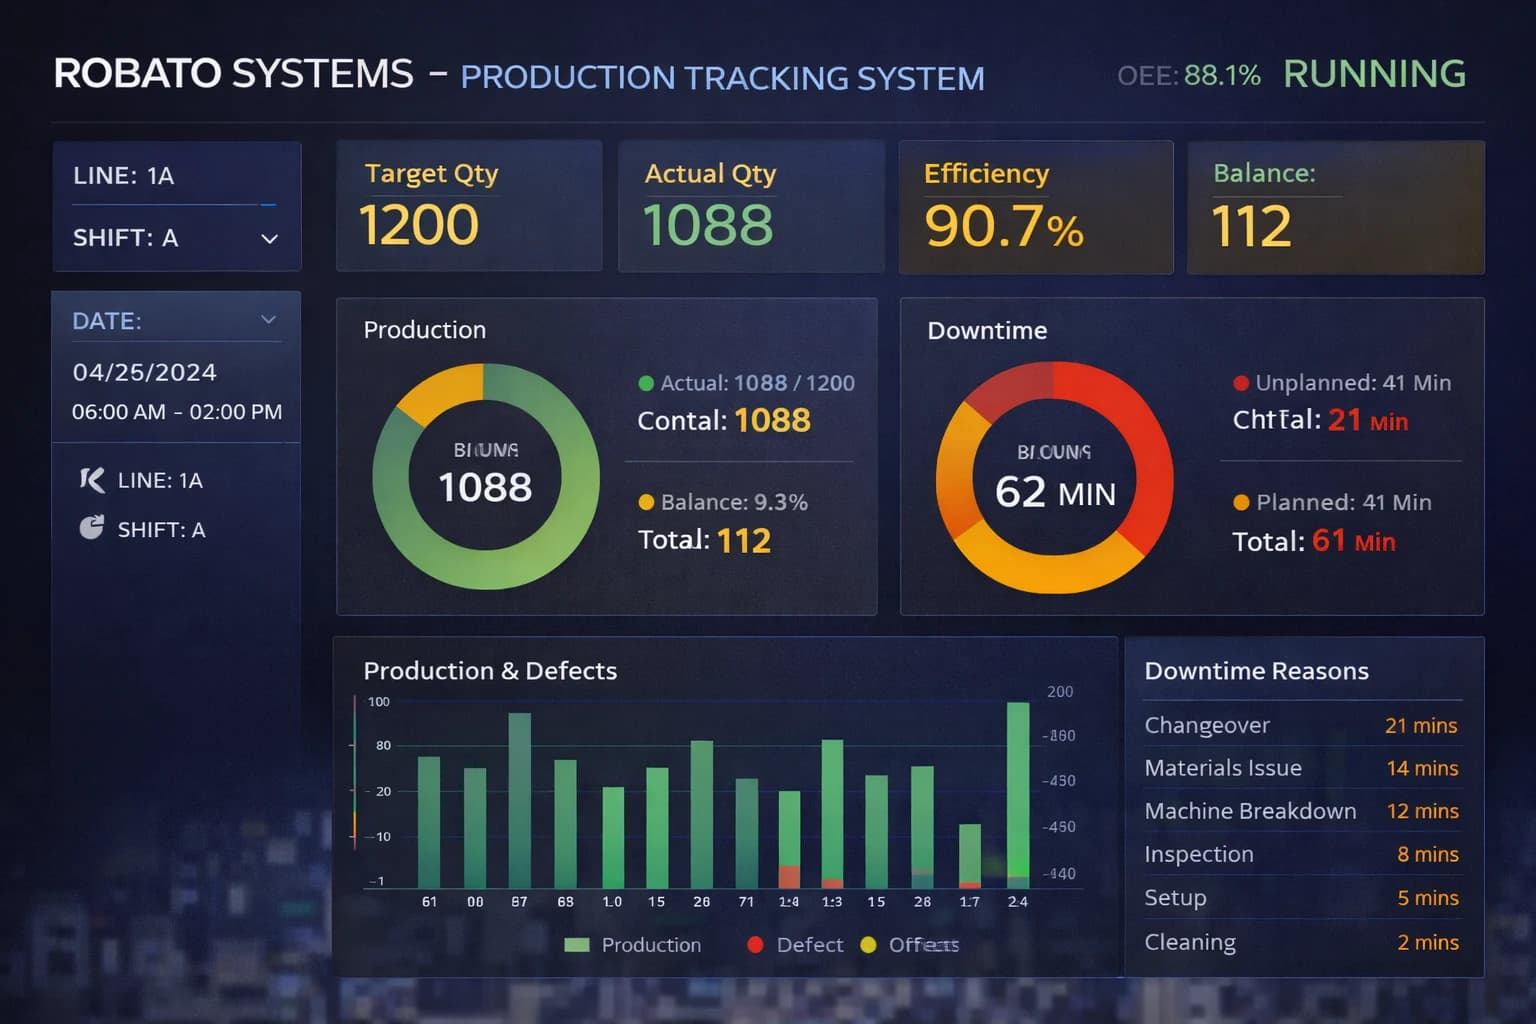
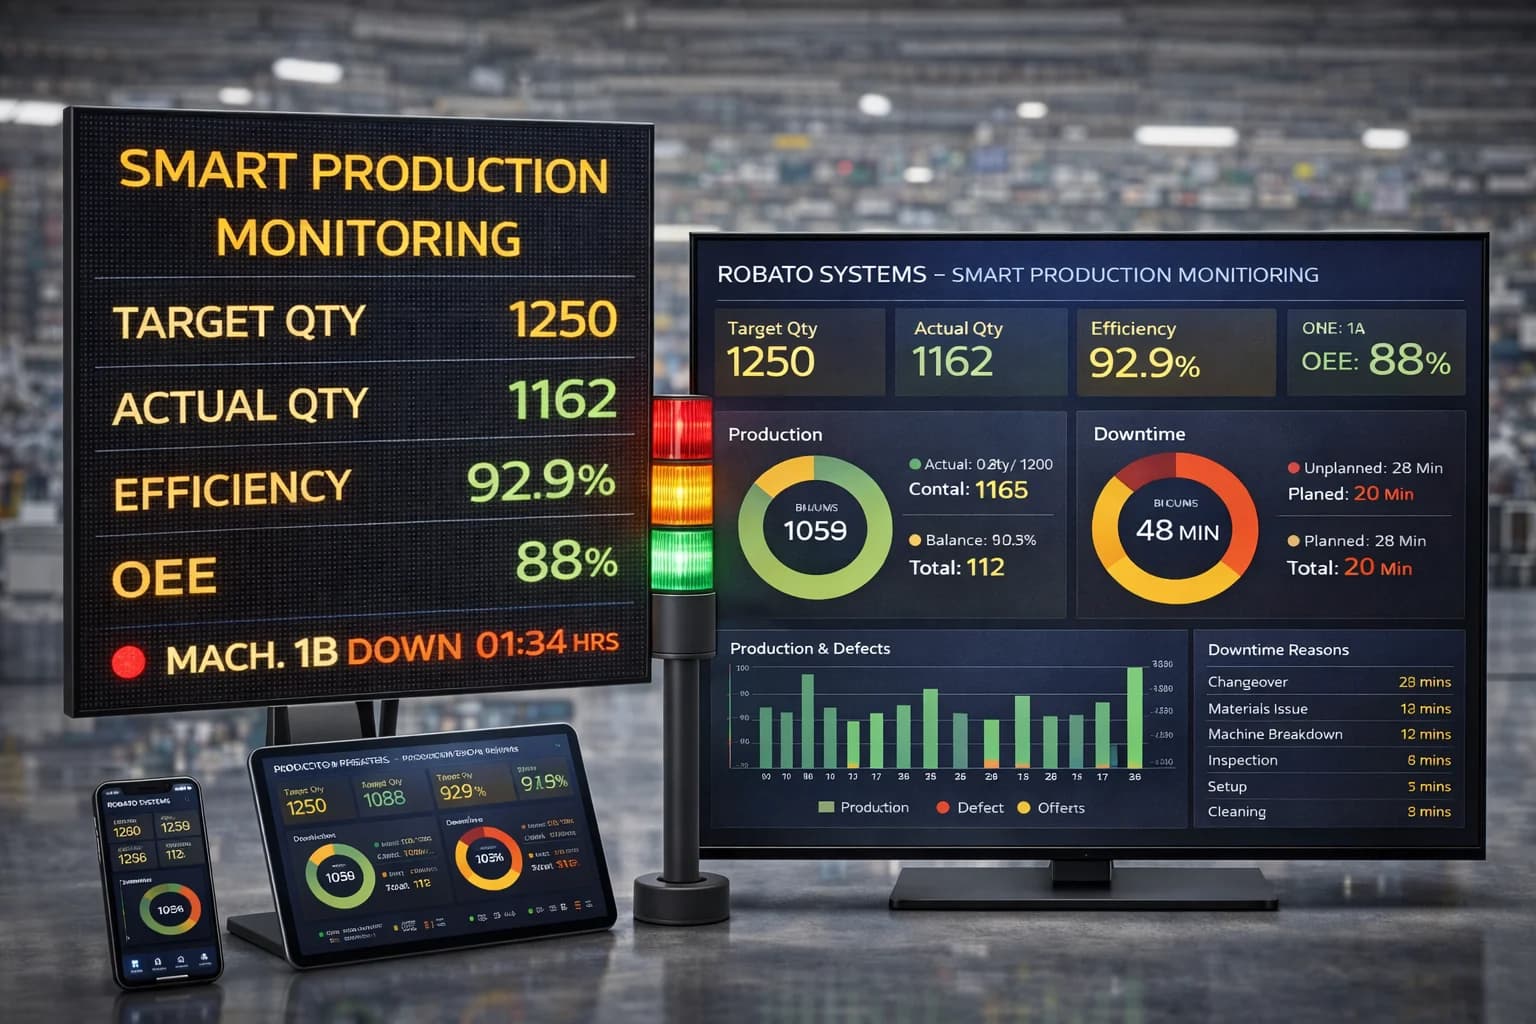
A production performance dashboard provides a visual overview of manufacturing activity.
A well-designed dashboard may include:
Production Summary
- Total production
- Good production
- Rejection
- Target
- Achievement percentage
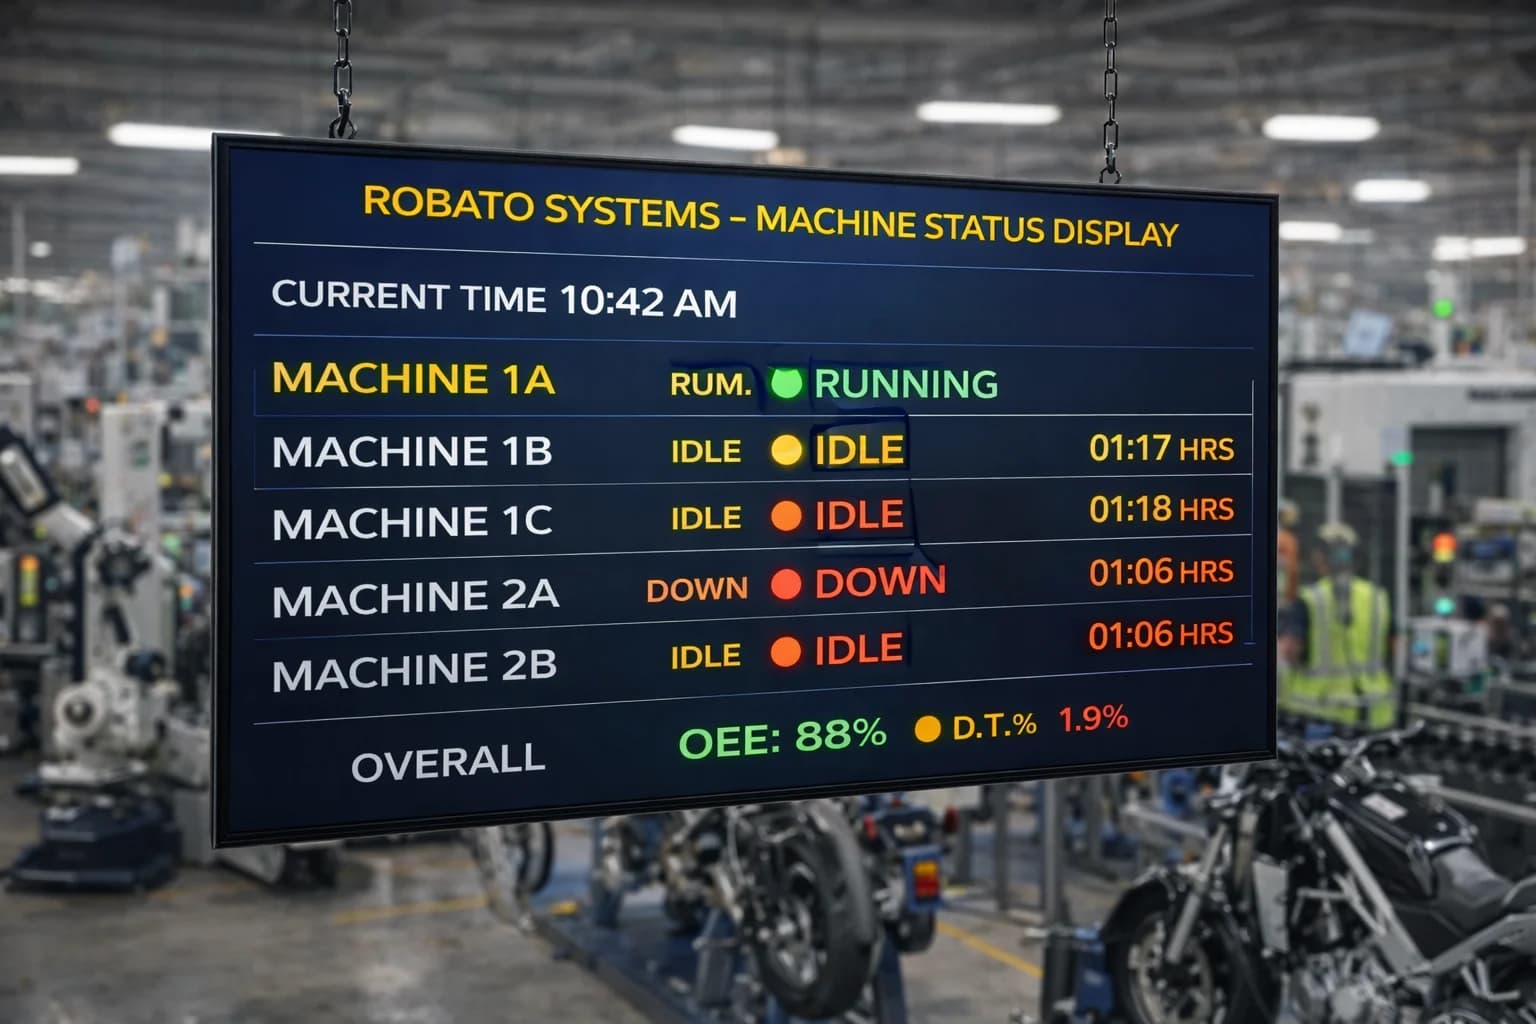
Machine Performance
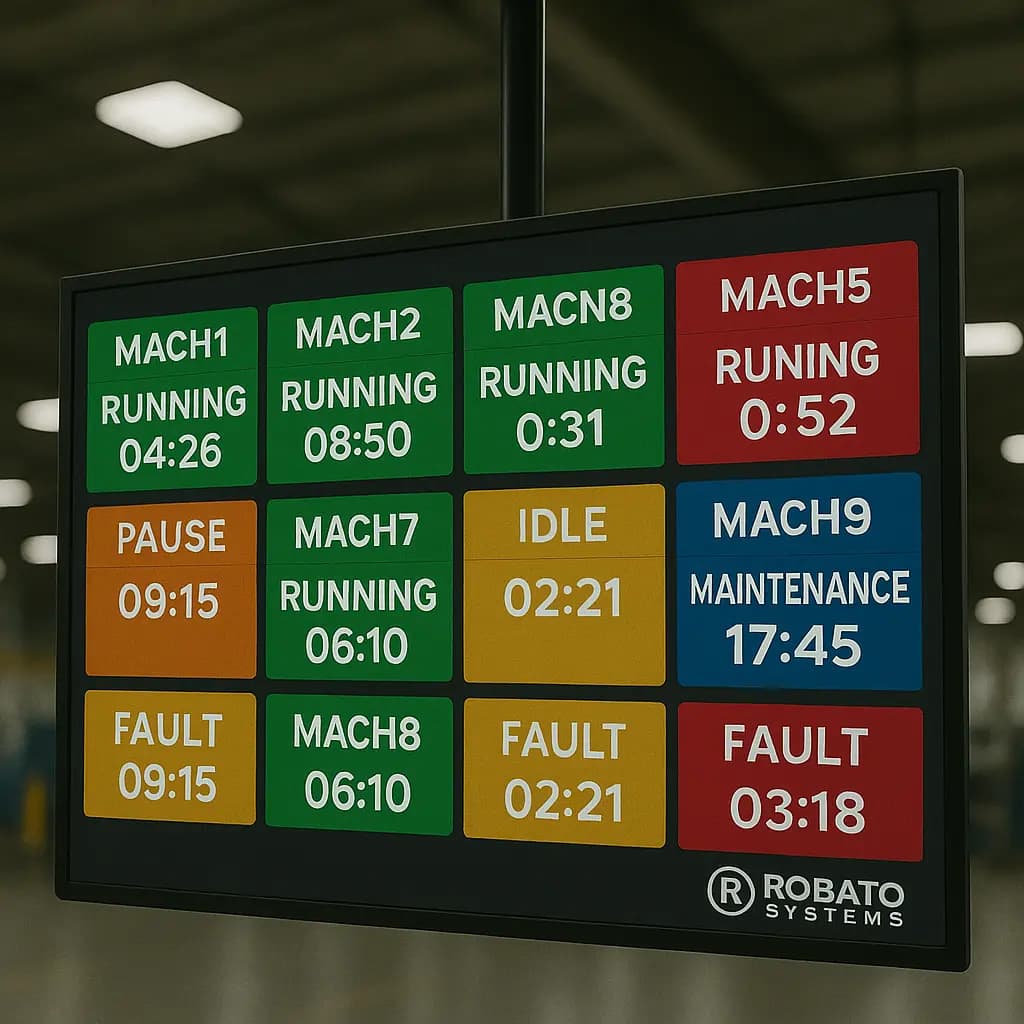
- Running machines
- Idle machines
- Down machines
- Machine utilization
- Production rate
Shift Performance
Managers can compare performance between:
- Shift A
- Shift B
- Shift C
This can reveal differences in production output, downtime, and efficiency.
Hourly Production
Hourly production monitoring helps identify when production starts falling behind.
For example, if output is consistently below the expected rate between 2 PM and 4 PM, the production team can investigate what happens during that period.
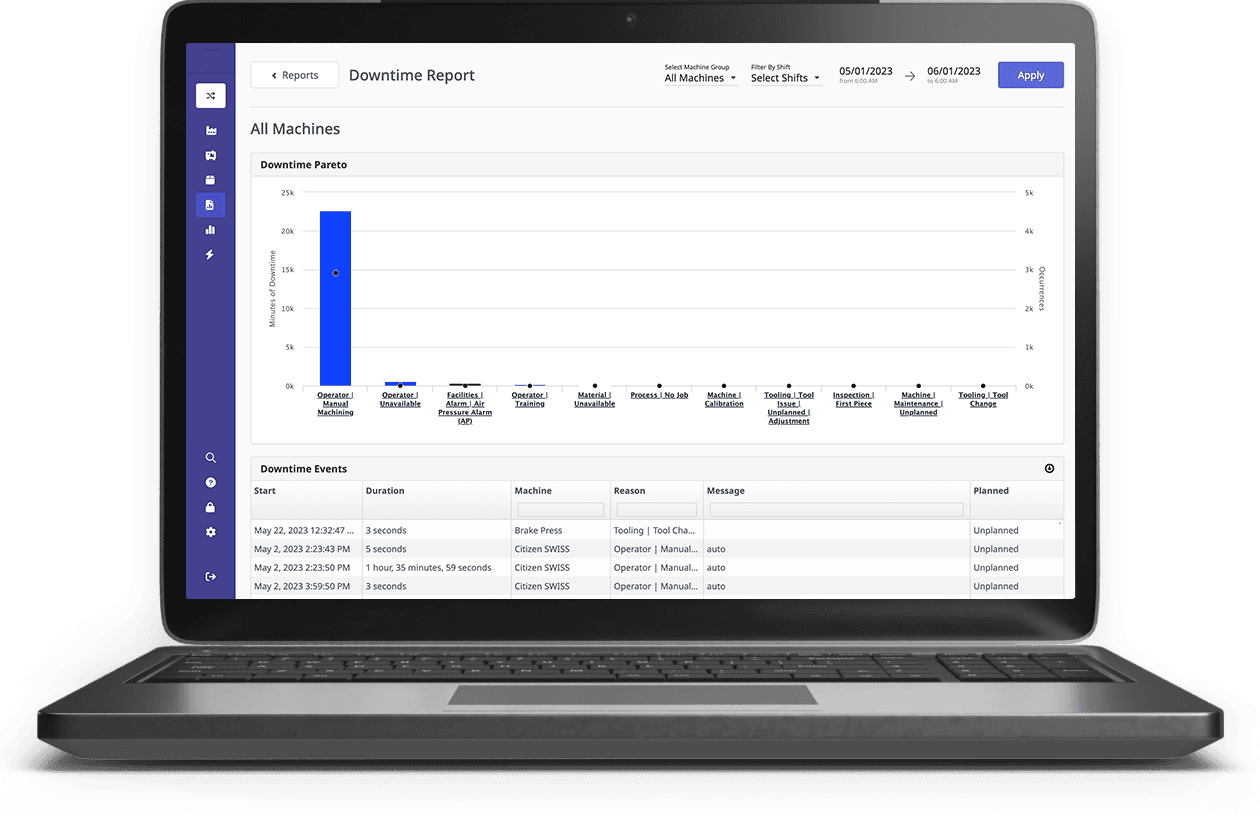
Downtime Analysis
Dashboards can categorize downtime by reason, duration, machine, and shift.
This makes recurring production losses easier to identify.
Benefits of Production Performance Monitoring
Better Production Visibility
Managers gain a centralized view of production activity rather than depending on disconnected reports.
Faster Response to Production Losses
When production performance drops, teams can identify the issue sooner.
Improved Target Management
Production teams can continuously compare actual output with planned targets.
Reduced Manual Reporting
Automated data collection can reduce repetitive spreadsheet and paper-based reporting.
Better Shift Management
Historical and real-time shift data can help supervisors understand how different shifts are performing.
Improved Machine Utilization
Monitoring machine status and running time can reveal underutilized equipment.
Data-Driven Decision Making
Instead of relying only on assumptions or delayed reports, managers can use actual production data to guide improvement activities.
Continuous Improvement
Historical performance data provides a foundation for identifying recurring problems and measuring the impact of corrective actions.
Production Performance Monitoring for Different Manufacturing Industries
Production monitoring can be applied across different manufacturing environments.
Automotive Manufacturing
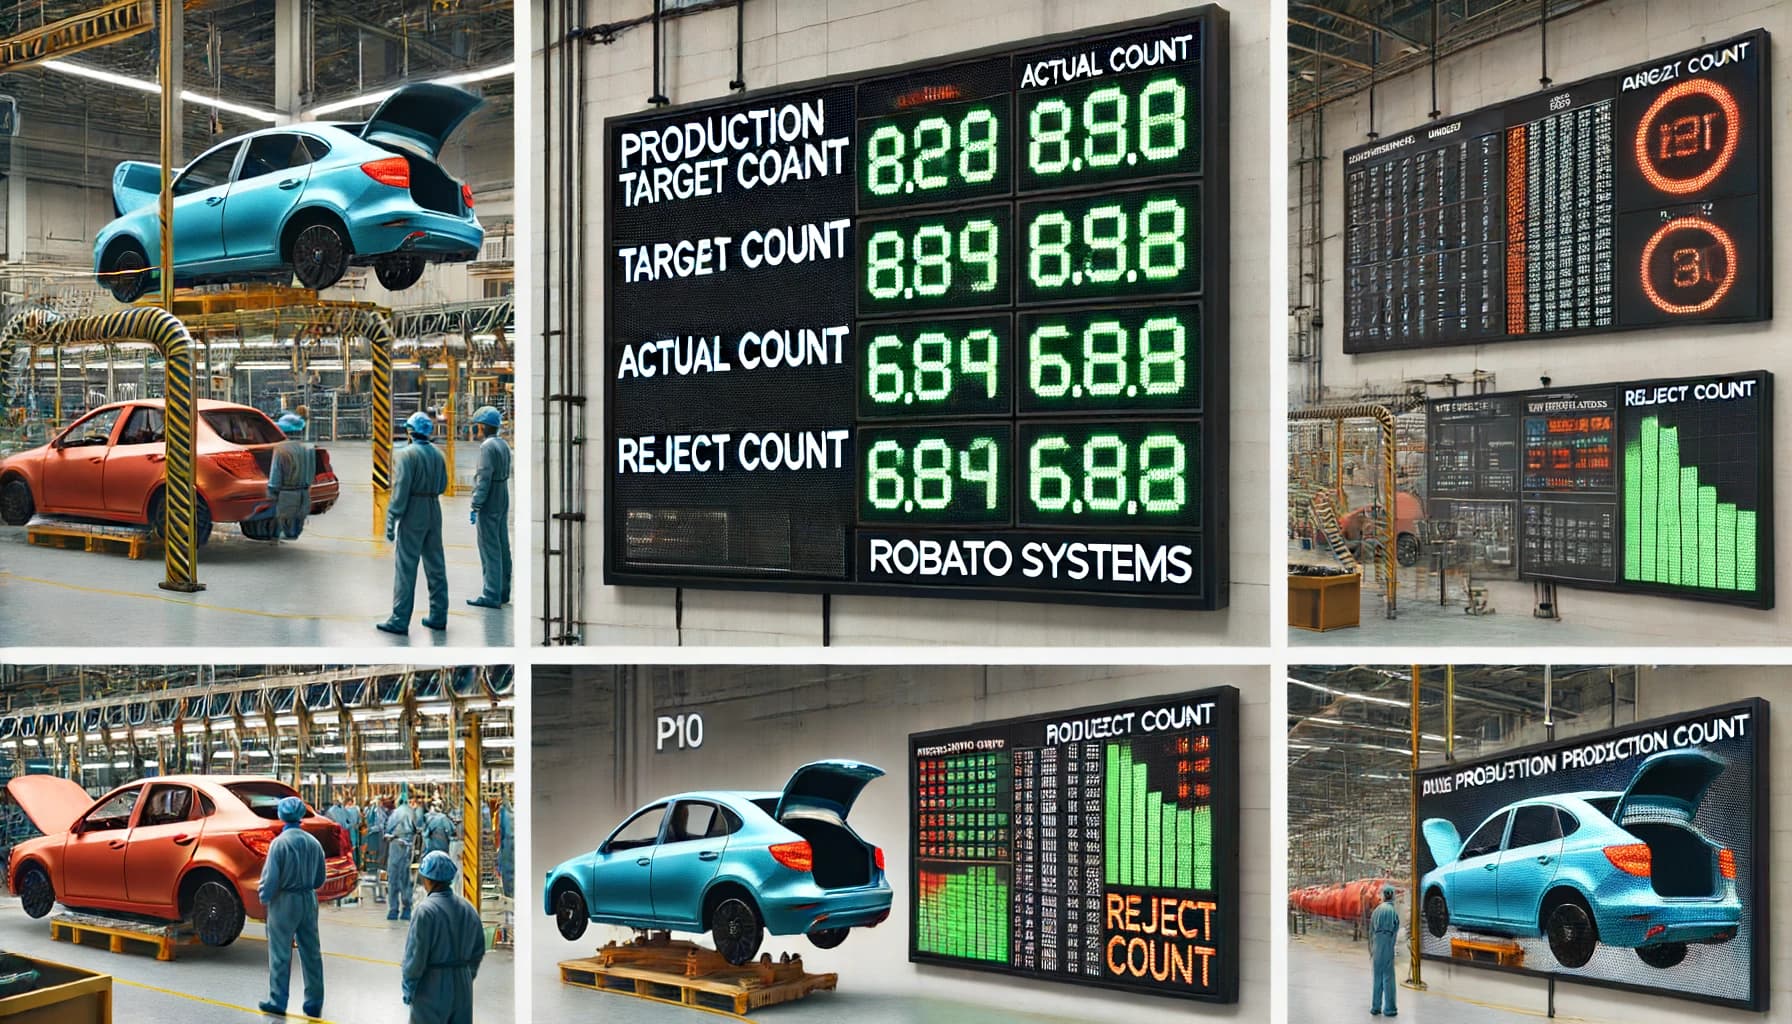
Automotive plants can monitor production lines, machine cycles, downtime, quality, and production targets.
Pharmaceutical Manufacturing
Production monitoring can provide visibility into batch production, equipment performance, and production progress.
Textile Manufacturing
Textile plants can track production output, machine utilization, downtime, and production rates.
Food and Beverage Manufacturing
Production performance monitoring can help track output, production targets, machine status, and quality-related losses.
Packaging Manufacturing
Packaging plants can monitor machine output, cycle time, downtime, and production efficiency.
Engineering and Component Manufacturing
Engineering manufacturers can track machine-level production, operator performance, downtime, and target achievement.
How Production Performance Monitoring Improves Productivity
Production productivity is influenced by multiple factors.
A monitoring system helps connect these factors together.
For example:
Low production output → Check machine downtime → Analyze downtime reason → Identify recurring loss → Take corrective action → Monitor improvement
Similarly:
Low production rate → Compare cycle time → Identify slow-running machine → Investigate process → Improve operating conditions → Measure new performance
This creates a continuous improvement cycle based on measurable production information.
Production Performance Monitoring and Industry 4.0
Industry 4.0 focuses on connected manufacturing, automation, data integration, and intelligent decision-making.
Production performance monitoring supports these principles by connecting shop floor activity with digital systems.
A modern Industry 4.0 production monitoring solution can integrate:
- IoT devices
- PLC data
- Sensors
- Machine monitoring
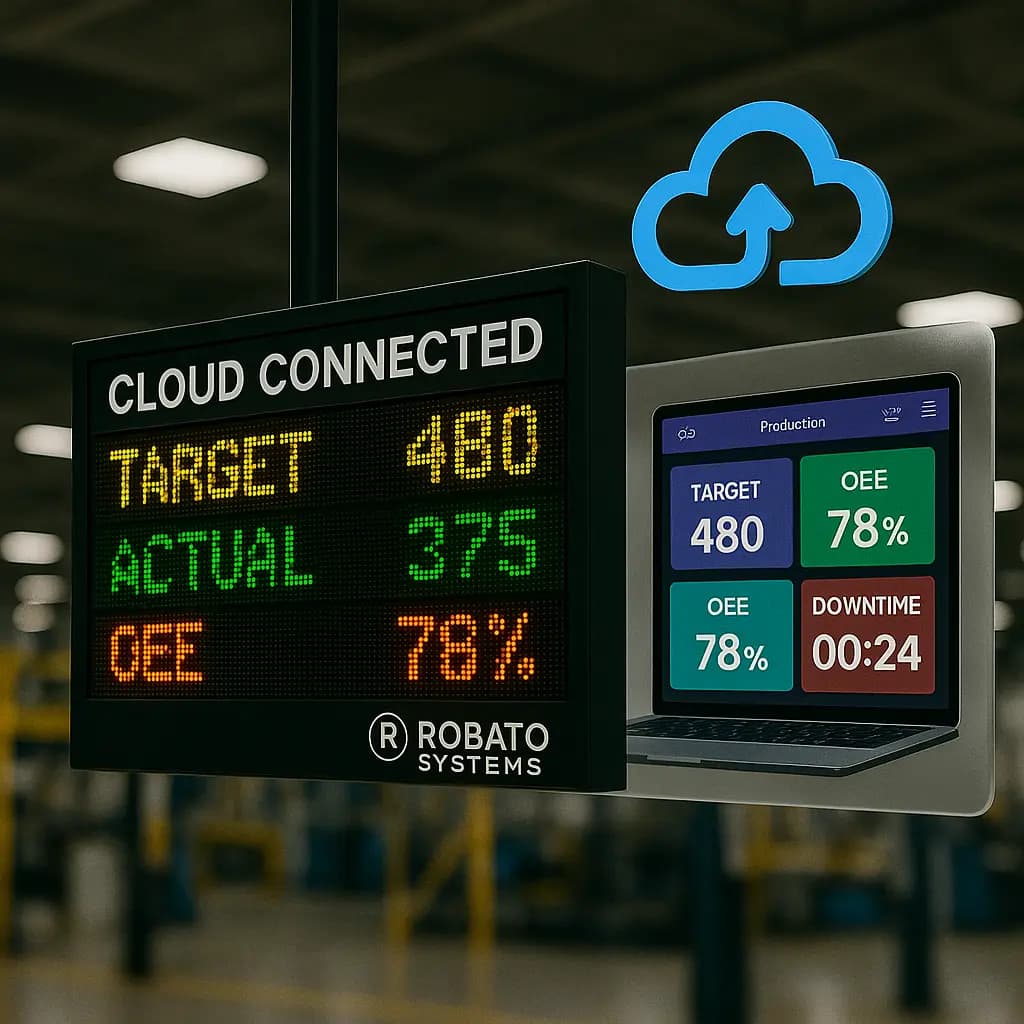
- Cloud or local databases
- Production dashboards
- Analytics
- Alerts
- OEE
- Downtime monitoring
- Operator information
This creates a more connected manufacturing environment where production information can move from the shop floor to decision-makers more efficiently.
What to Look for in Production Monitoring Software
When evaluating production performance monitoring software, manufacturers should consider the following capabilities:
Real-Time Data
The system should provide timely production information rather than relying entirely on delayed reports.
Machine-Level Visibility
Managers should be able to analyze individual machines and production lines.
Production Target Tracking
The platform should support planned vs actual production analysis.
Downtime Monitoring
Downtime should be measurable and available for historical analysis.
Shift-Based Reporting
Shift-level performance is important for many continuous and discrete manufacturing operations.
Historical Analytics
Historical data helps identify trends and recurring production problems.
Custom Dashboards
Different users may need different views. Production managers, plant heads, maintenance teams, and operators may require different KPIs.
Scalability
The system should be capable of expanding from one machine or line to multiple production areas and plants.
Common Mistakes in Production Performance Monitoring
Tracking Only Production Quantity
High output does not always mean high efficiency.
Quality, downtime, cycle time, and machine availability should also be considered.
Collecting Data Without Taking Action
A dashboard is useful only when teams use its information to improve operations.
Ignoring Downtime Reasons
Knowing that a machine stopped is useful, but understanding why it stopped provides much greater improvement potential.
Relying on End-of-Shift Reports
Delayed information reduces the opportunity to correct problems during the shift.
Creating Overly Complex Dashboards
A dashboard should make important information easier to understand, not overwhelm users with unnecessary metrics.
How to Implement Production Performance Monitoring
A practical implementation can follow these steps:
1. Define Production KPIs
Identify the metrics that matter most to your manufacturing process.
2. Identify Data Sources
Determine where production information currently comes from.
3. Connect Machines and Production Systems
Integrate relevant machines, PLCs, sensors, or existing systems.
4. Build Production Dashboards
Create dashboards around the requirements of operators, supervisors, managers, and plant leadership.
5. Establish Target Monitoring
Define production targets by machine, product, shift, or production line where appropriate.
6. Track Downtime and Losses
Capture machine stoppages and categorize production losses.
7. Analyze Historical Performance
Use historical data to identify recurring problems and performance trends.
8. Create a Continuous Improvement Process
Use monitoring data to identify problems, implement corrective actions, and measure results.
Production Performance Monitoring with Robato Systems
Robato Systems provides digital manufacturing and IIoT solutions designed to improve visibility across production operations.
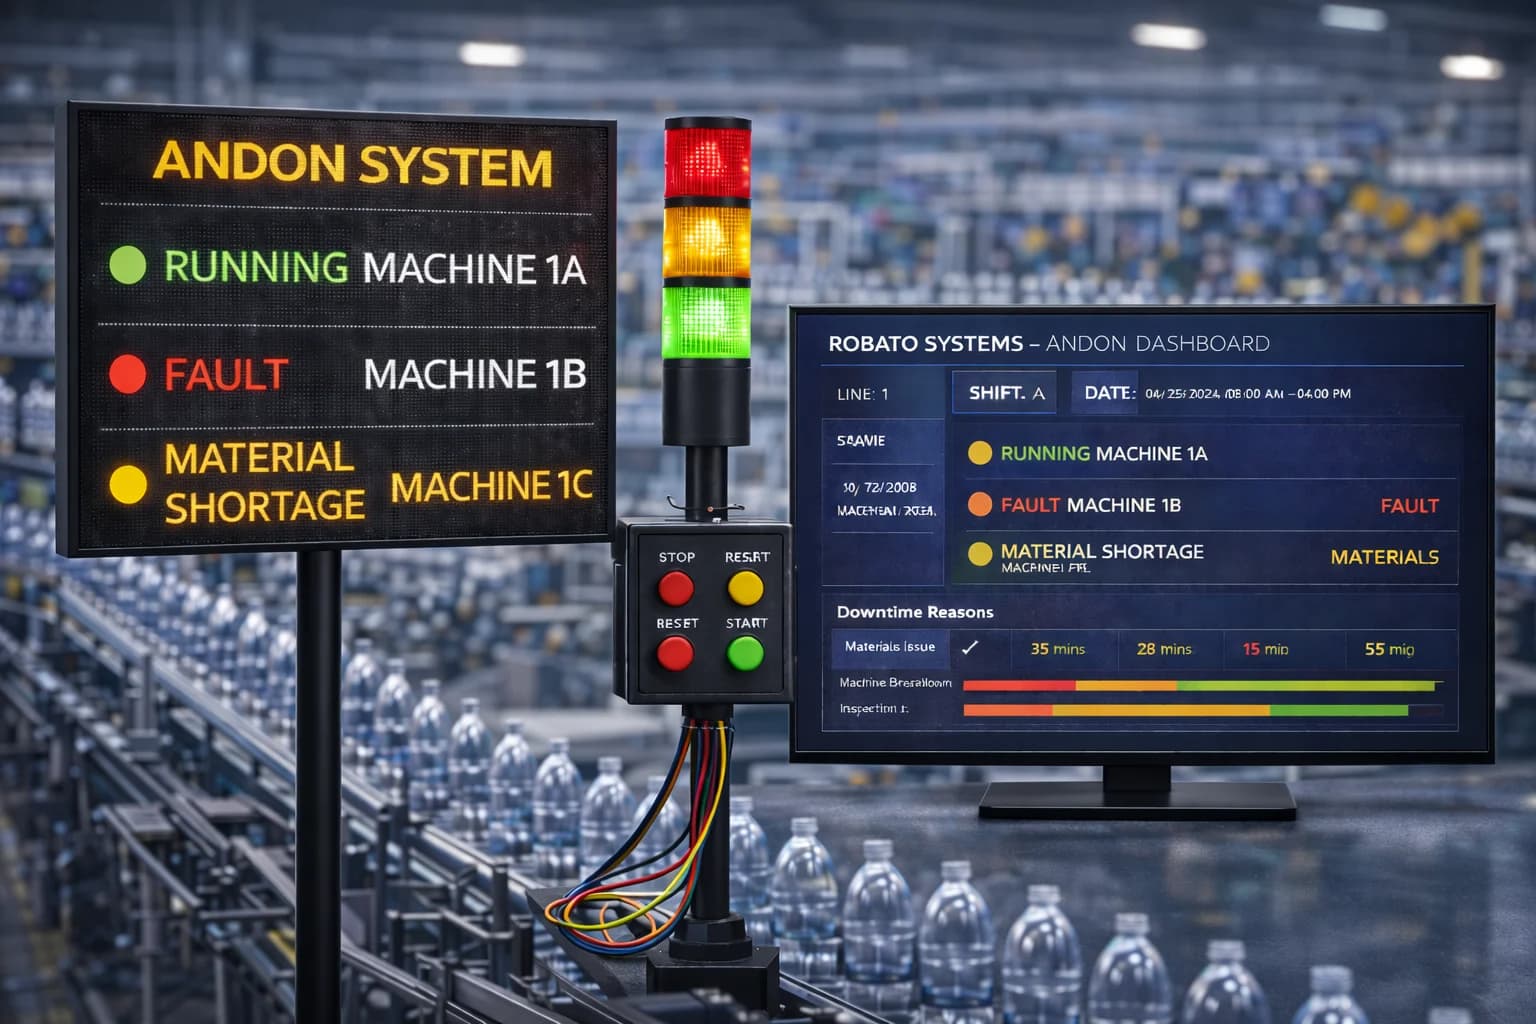
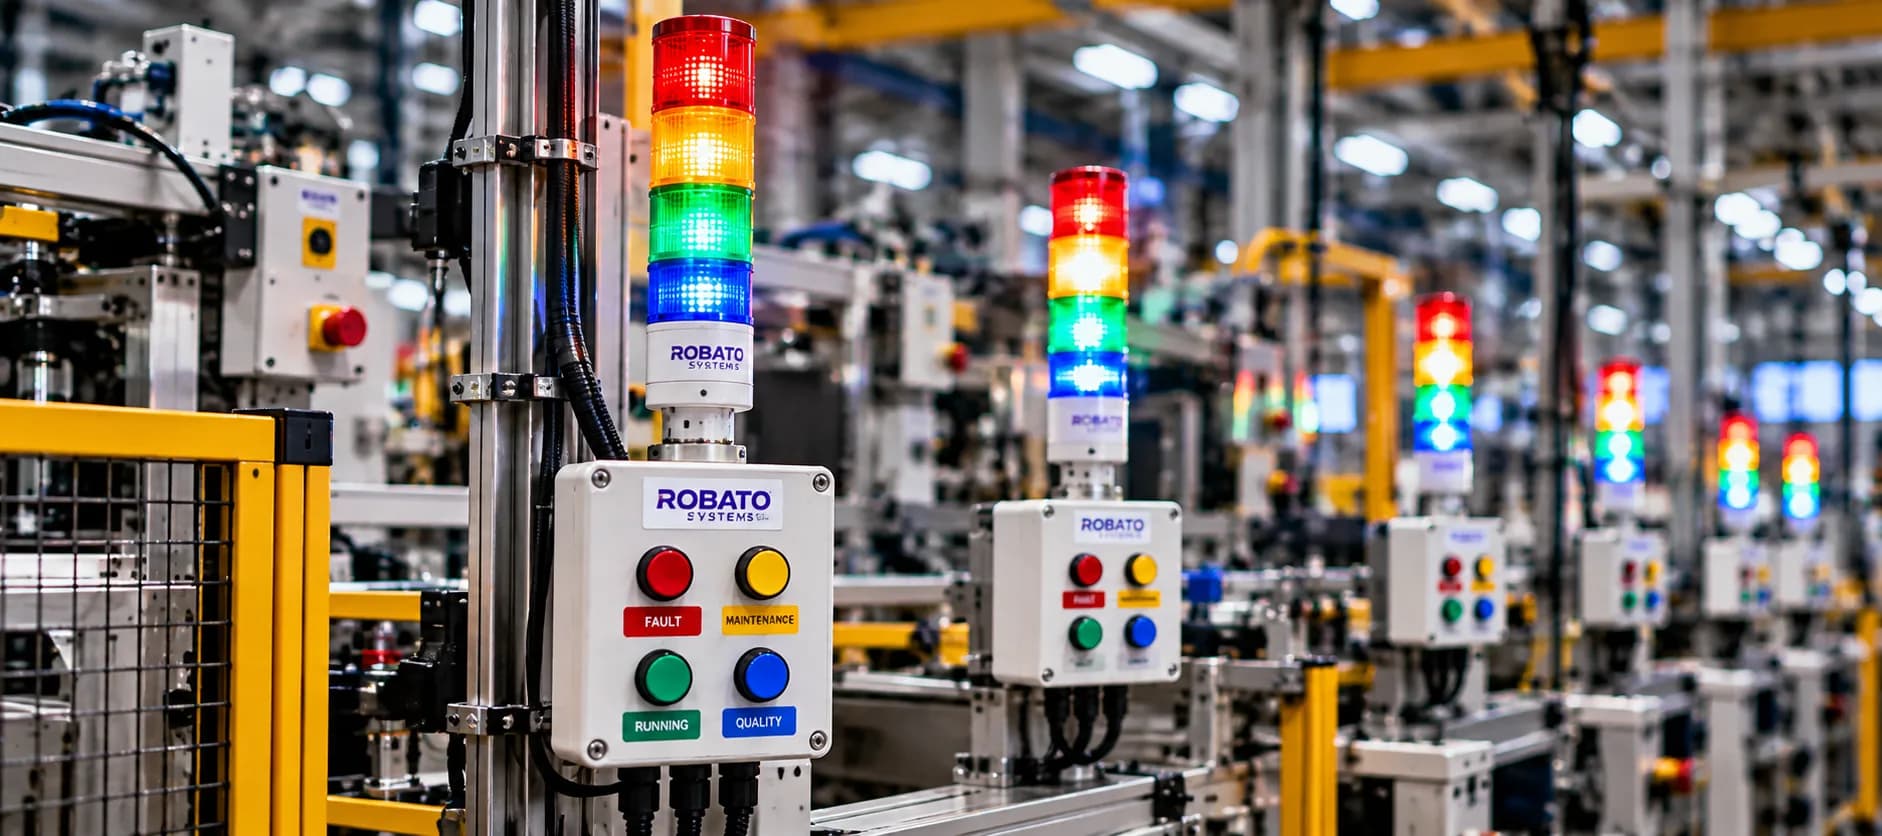
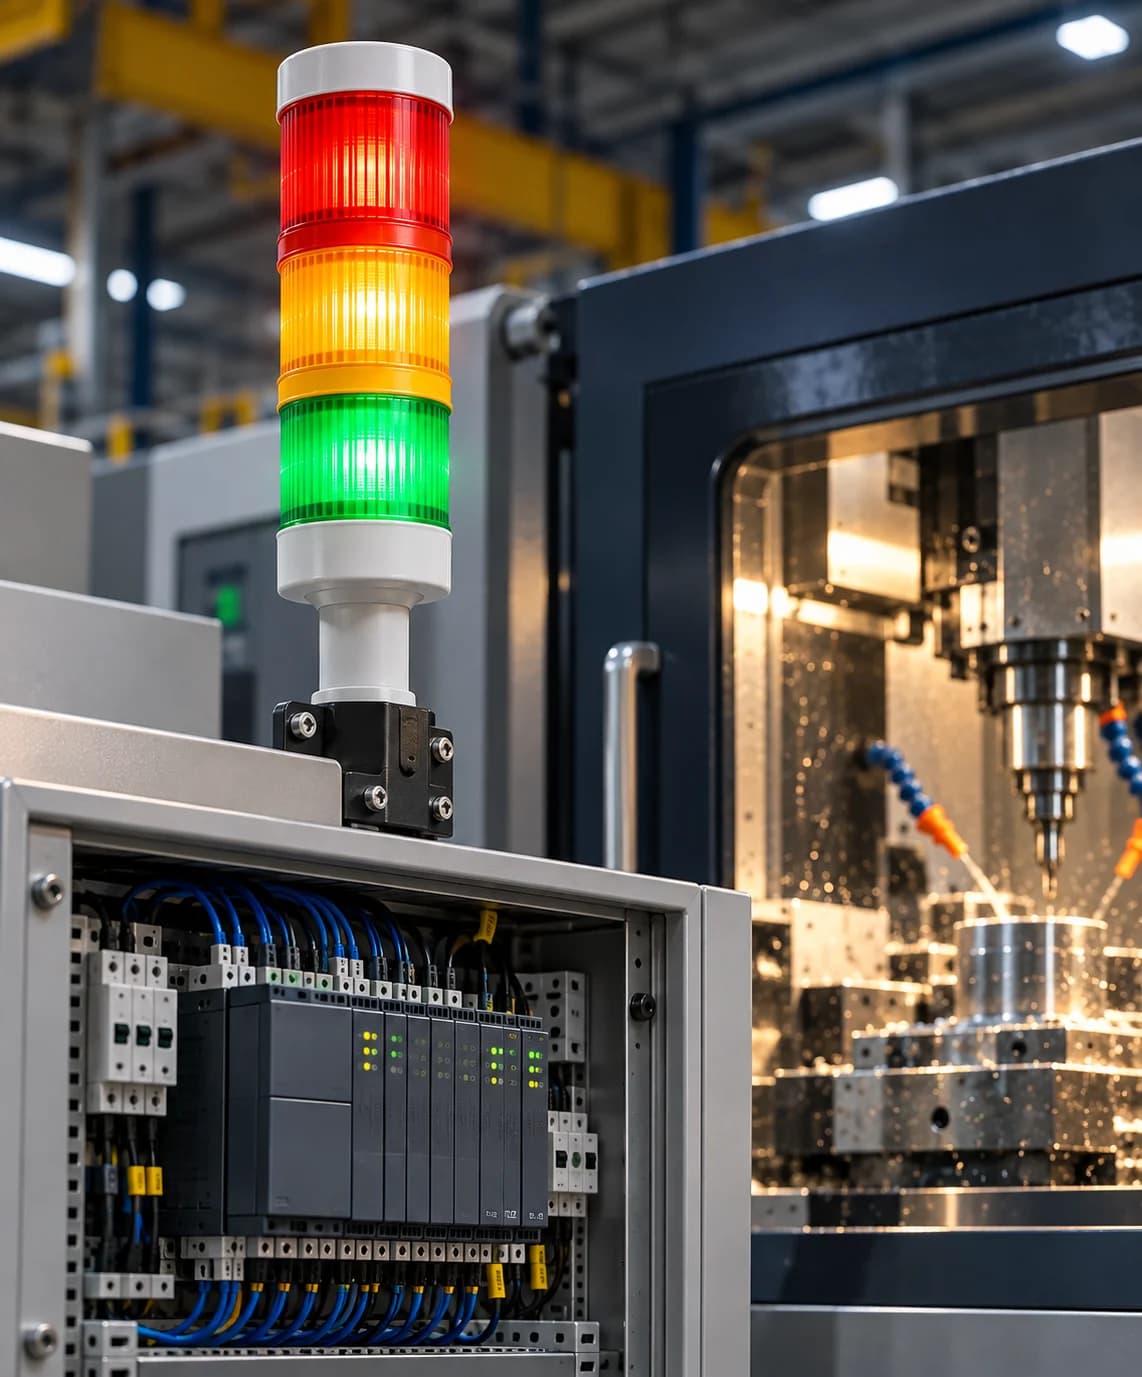
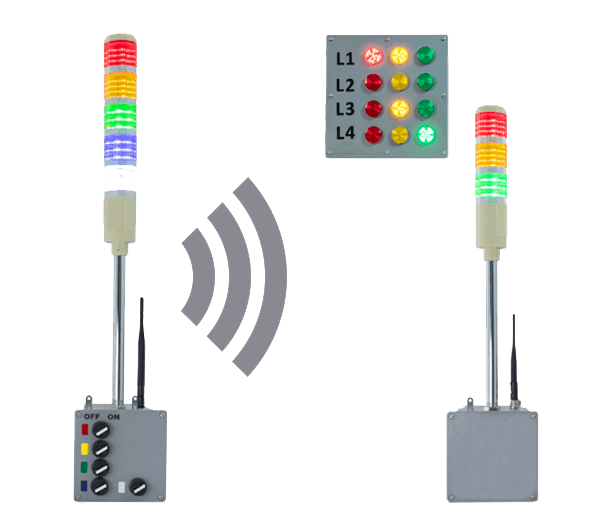
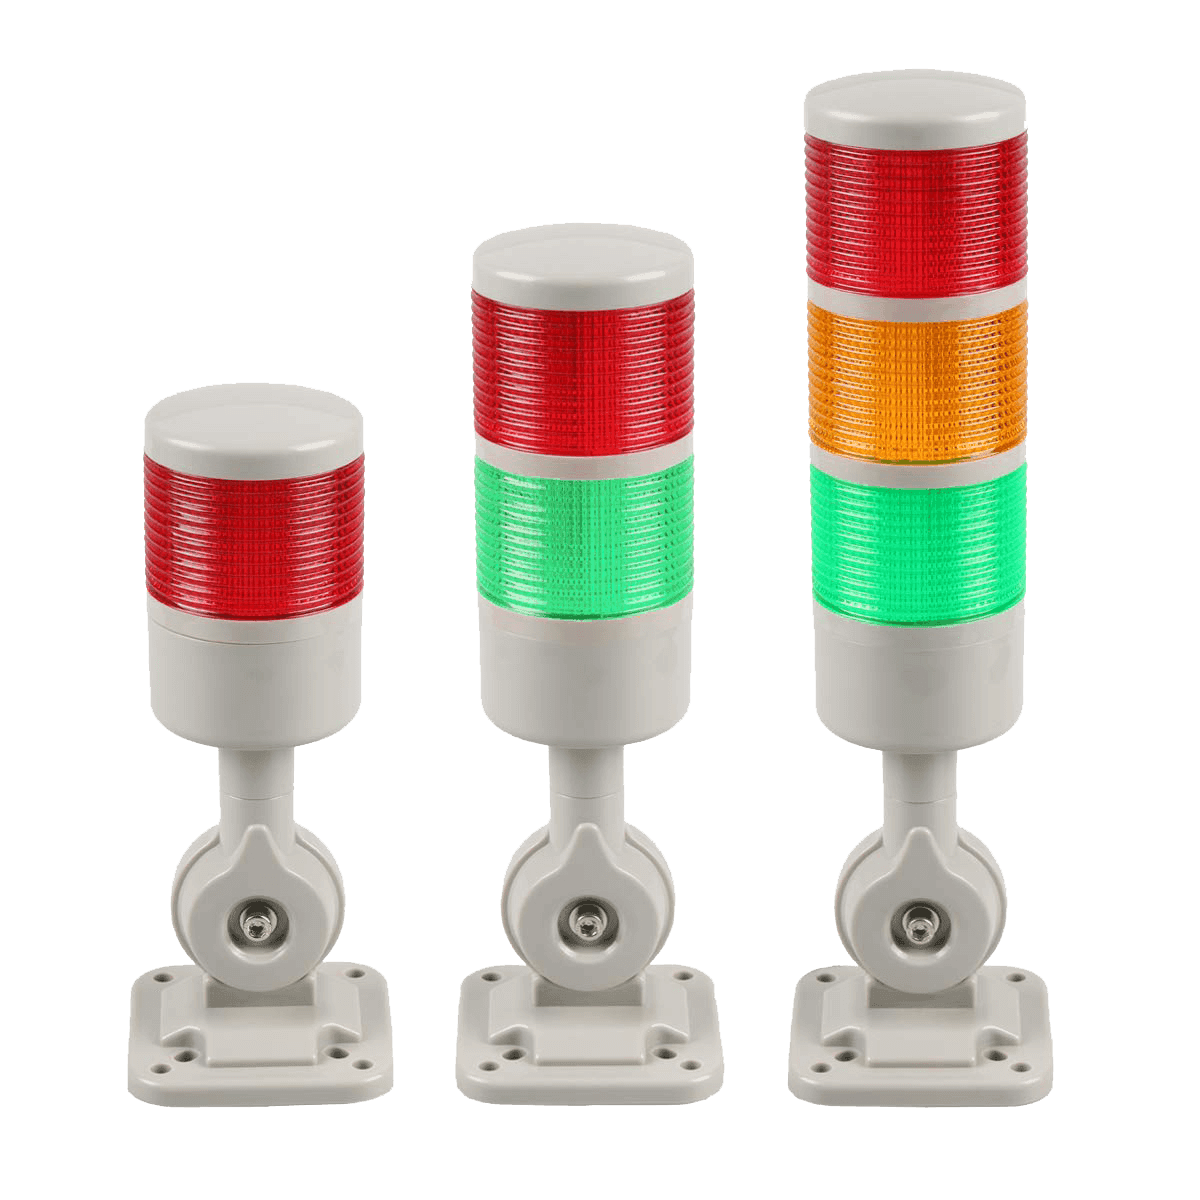
A connected manufacturing environment can bring together production monitoring, OEE, downtime tracking, Andon alerts, operator performance, and production analytics.
With centralized production information, manufacturing teams can move from delayed reporting toward more connected and data-driven shop floor management.
The exact monitoring architecture can be configured according to the machines, production processes, KPIs, and operational requirements of each manufacturing environment.
Final Thoughts
Production performance monitoring provides manufacturers with a structured way to understand what is happening across the shop floor.
By monitoring actual production, targets, machine status, downtime, cycle time, quality, shifts, and efficiency, organizations can identify production losses earlier and make better operational decisions.
The greatest value of production monitoring is not simply having more data. It is turning production data into actionable information that helps teams improve output, reduce losses, increase machine utilization, and continuously improve manufacturing performance.
For factories moving toward Industry 4.0, real-time production performance monitoring can become an important foundation for connected and data-driven manufacturing.
FAQs
What is production performance monitoring?
Production performance monitoring is the process of continuously tracking manufacturing output, targets, machine performance, downtime, quality, and other production KPIs to understand shop floor performance.
What is a production performance monitoring system?
A production performance monitoring system collects production data from machines, sensors, PLCs, operators, or other sources and presents the information through dashboards, reports, and analytics.
Why is real-time production monitoring important?
Real-time production monitoring helps teams identify production deviations, machine stoppages, and performance losses while they are happening instead of waiting for end-of-shift reports.
Which KPIs should be monitored in production?
Common production KPIs include actual production, planned vs actual output, production achievement, downtime, cycle time, machine utilization, rejection, quality, availability, performance, and OEE.
Can production monitoring reduce manual reporting?
Yes. When production data is automatically collected and presented through digital dashboards, the need for repetitive manual production reporting can be reduced.
How does production monitoring improve manufacturing productivity?
It provides visibility into production losses, downtime, machine utilization, target achievement, and process performance, allowing teams to identify problems and take corrective action.
Is production performance monitoring useful for small manufacturing plants?
Yes. Production monitoring can be implemented at different scales, from individual machines or production lines to larger multi-line and multi-plant manufacturing environments.