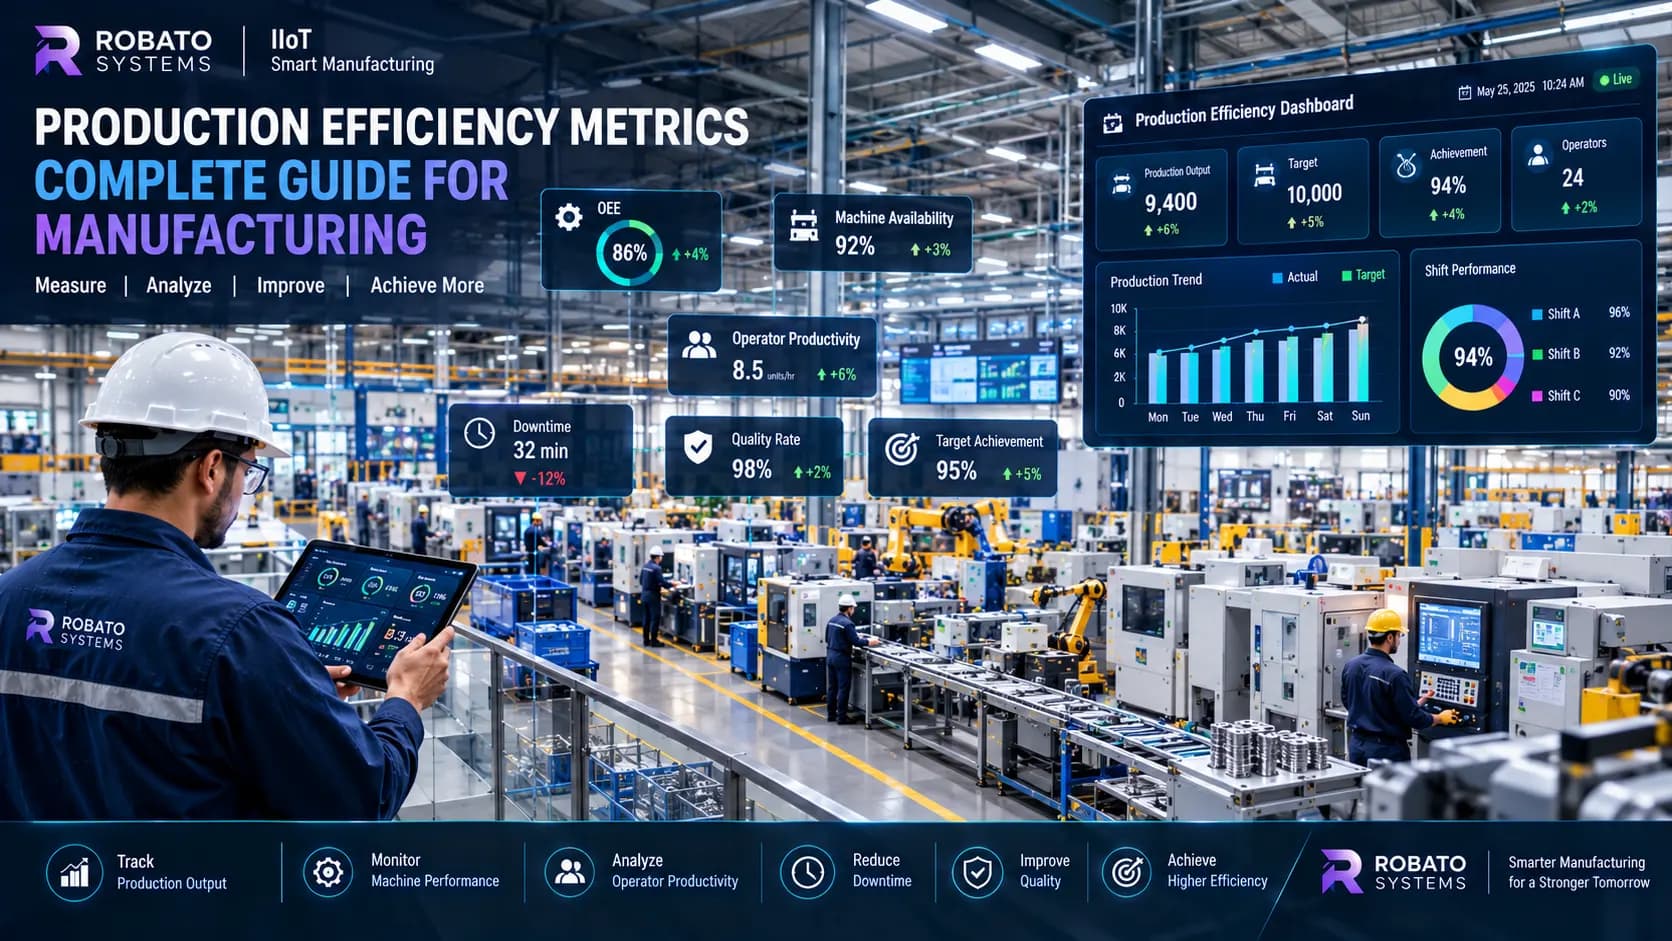
Production Efficiency Metrics: Complete Guide for Manufacturing
Manufacturing companies need accurate performance data to understand whether their production processes are operating efficiently.
Total production output alone does not tell the complete story.
A factory may produce thousands of units while experiencing excessive machine downtime, high scrap rates, low equipment utilization, or inefficient workforce utilization. Similarly, production output may decline because of machine breakdowns, material shortages, long changeovers, or quality problems.
This is why manufacturers use production efficiency metrics.
Production efficiency metrics help production managers, plant heads, operations teams, and factory owners measure how effectively machines, operators, materials, time, and production processes are being used.
When these metrics are collected through connected production monitoring systems, manufacturers can move beyond manual reporting and gain a real-time view of factory performance.
This guide explains the most important production efficiency metrics, how they are calculated, why they matter, and how manufacturers can use them to improve production performance.
What Are Production Efficiency Metrics?
Production efficiency metrics are measurable indicators used to evaluate how effectively a manufacturing operation converts available resources into production output.
These metrics can measure different parts of the production process, including:
- Production output
- Machine availability
- Machine performance
- Quality
- Downtime
- Production cycle time
- Operator productivity
- Machine utilization
- Production target achievement
- Scrap and rework
- Overall equipment effectiveness
No single metric can describe complete manufacturing efficiency.
A strong production performance system combines multiple KPIs to provide a more complete picture of shop floor operations.
Why Production Efficiency Metrics Matter
Manufacturing environments involve many interconnected factors.
A production shortfall can be caused by:
- Machine breakdowns
- Slow cycle times
- Material shortages
- Operator availability
- Long changeovers
- Quality problems
- Production planning issues
- Maintenance activities
- Process bottlenecks
Without measurable production KPIs, it can be difficult to identify the actual source of a problem.
Production efficiency metrics provide a common data-based framework for understanding factory performance.
They help managers answer questions such as:
- Are we meeting production targets?
- How much machine downtime occurred?
- How efficiently are machines being used?
- How much production is being generated per operator?
- How much production is lost because of quality problems?
- Which production lines require attention?
- Which downtime reasons occur most frequently?
- Is production efficiency improving over time?
15 Important Production Efficiency Metrics
Different factories may require different KPIs, but the following metrics are commonly useful for manufacturing performance monitoring.
1. Overall Equipment Effectiveness (OEE)
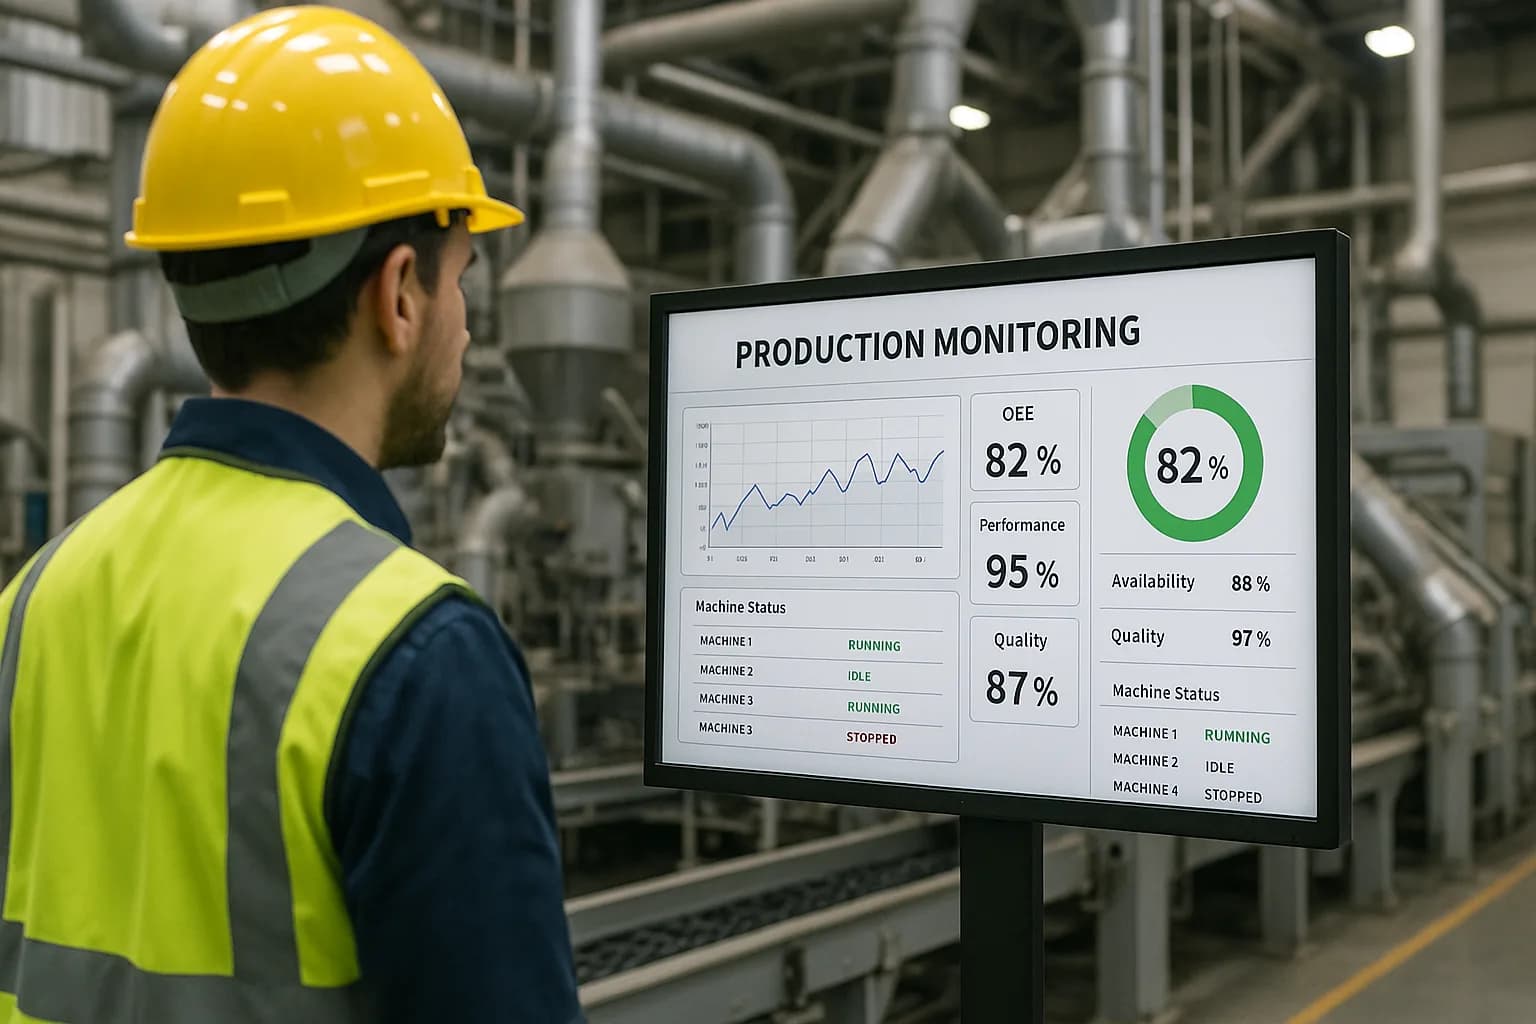
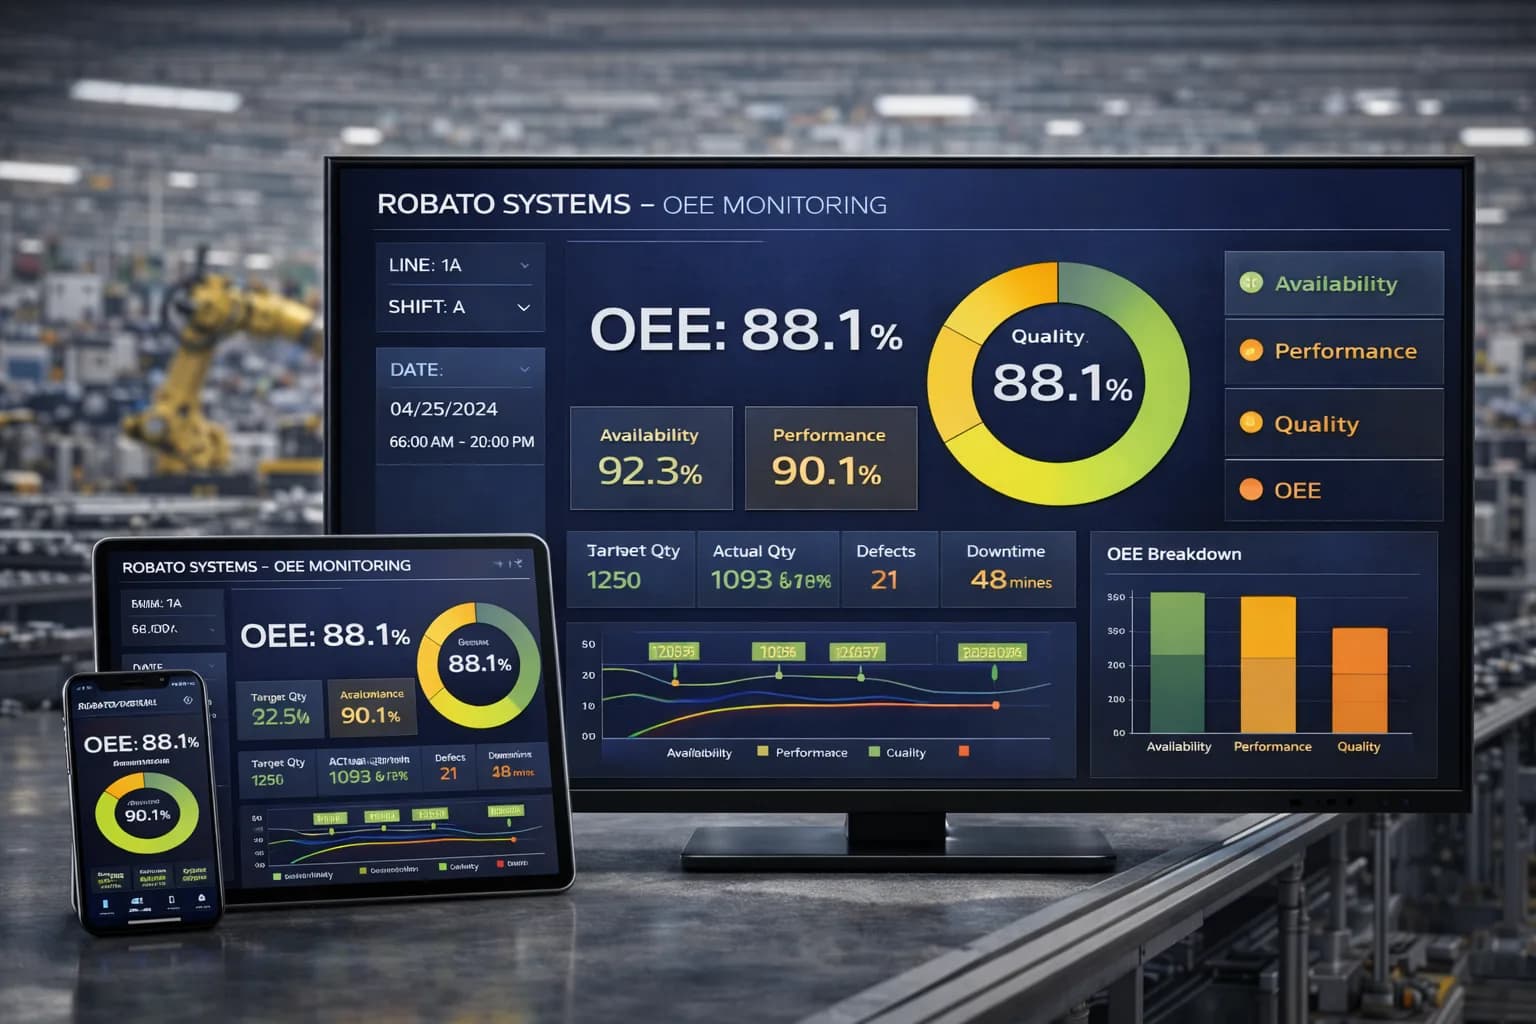
OEE is one of the most widely used manufacturing efficiency metrics.
It combines three major components:
- Availability
- Performance
- Quality
The concept helps manufacturers understand how effectively equipment is being used to produce good products.
OEE can help identify whether production losses are associated with:
- Equipment availability
- Slow production
- Quality losses
Because it combines multiple dimensions of equipment performance, OEE is often used as a high-level manufacturing KPI.
2. Production Output
Production output measures the quantity produced during a defined period.
It can be tracked by:
- Hour
- Shift
- Day
- Machine
- Production line
- Product
- Work order
- Plant
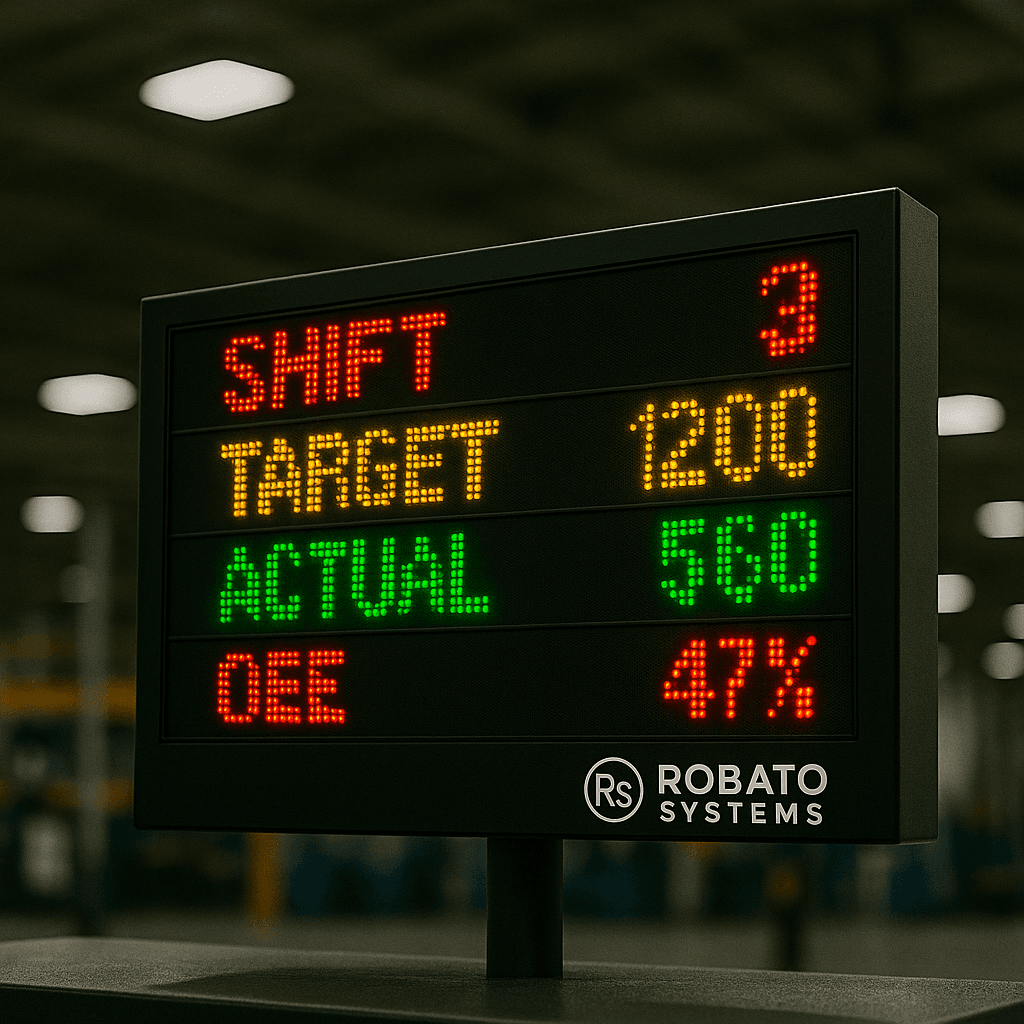
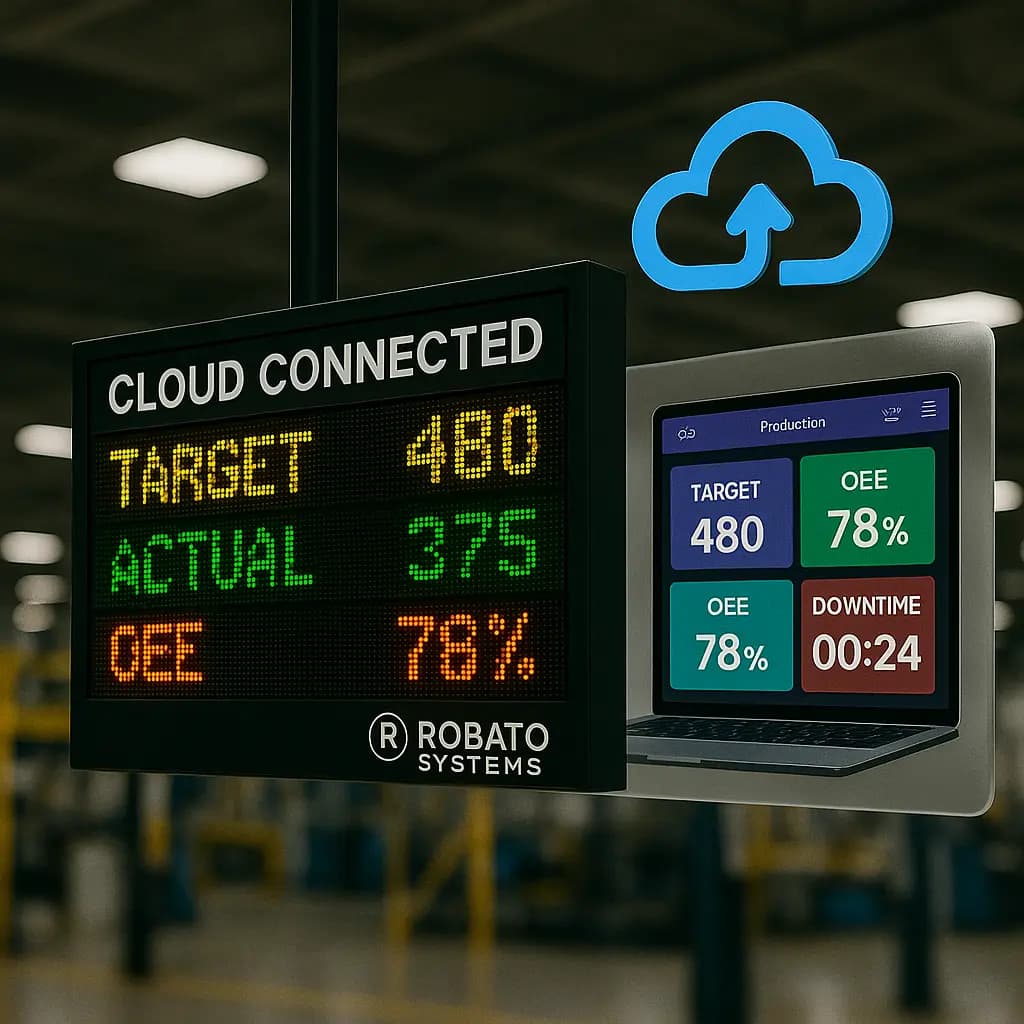
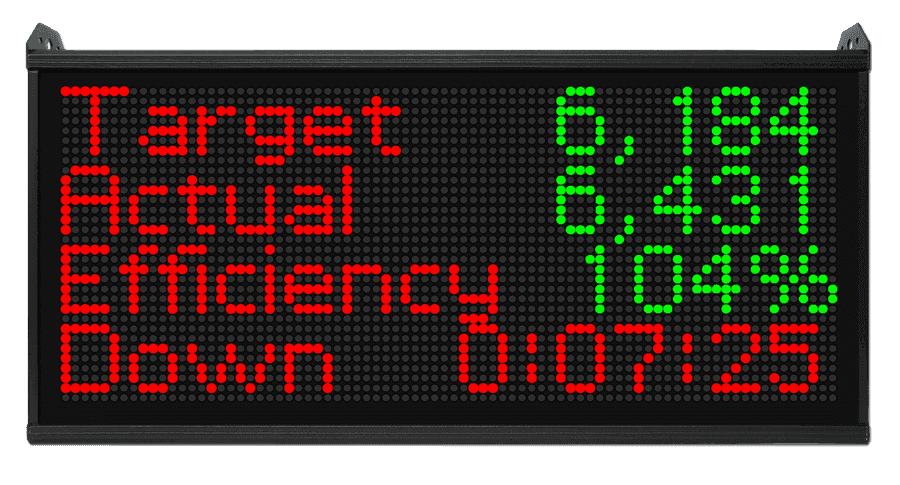
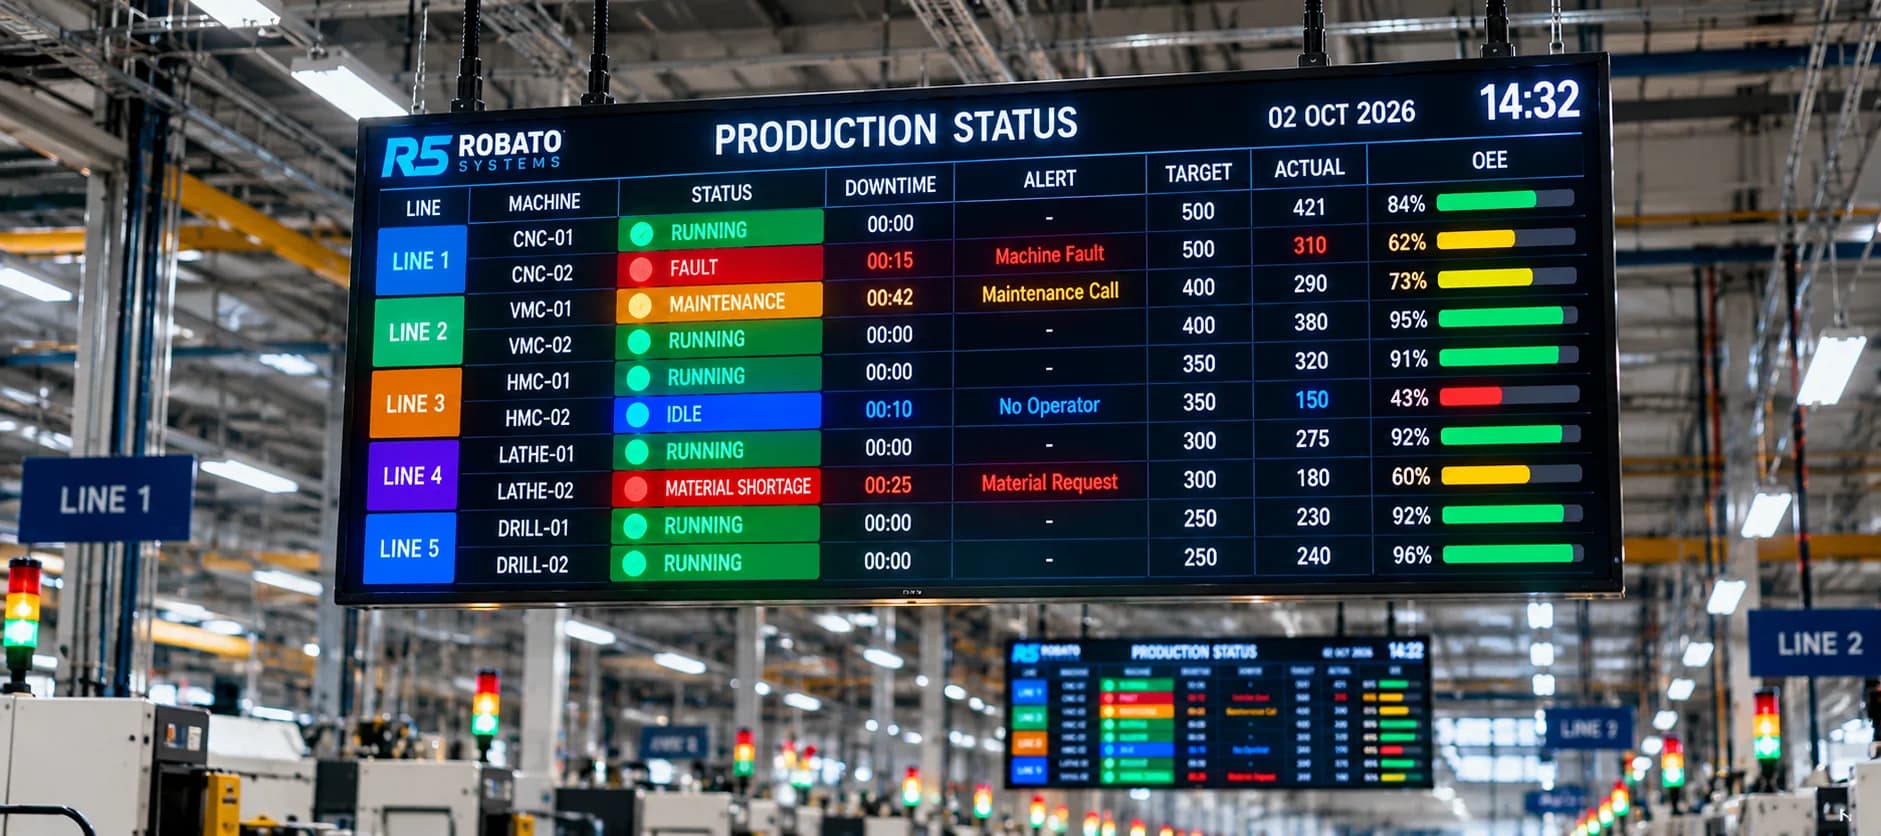
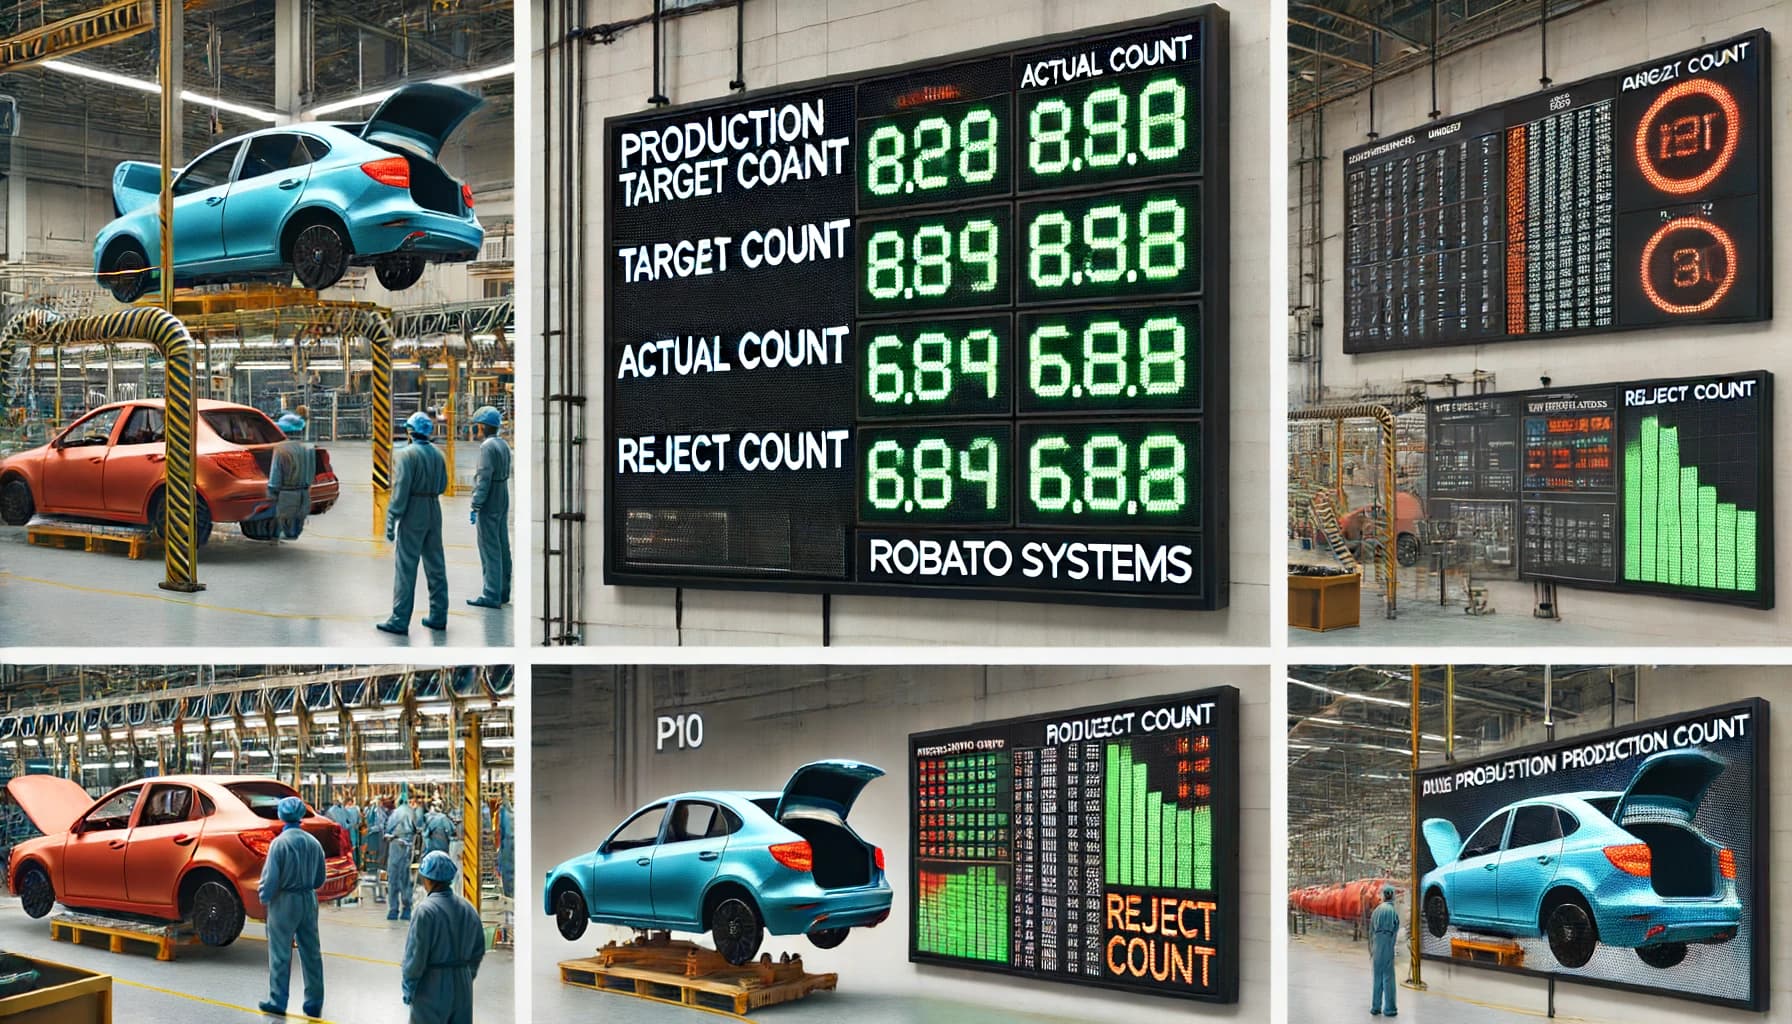
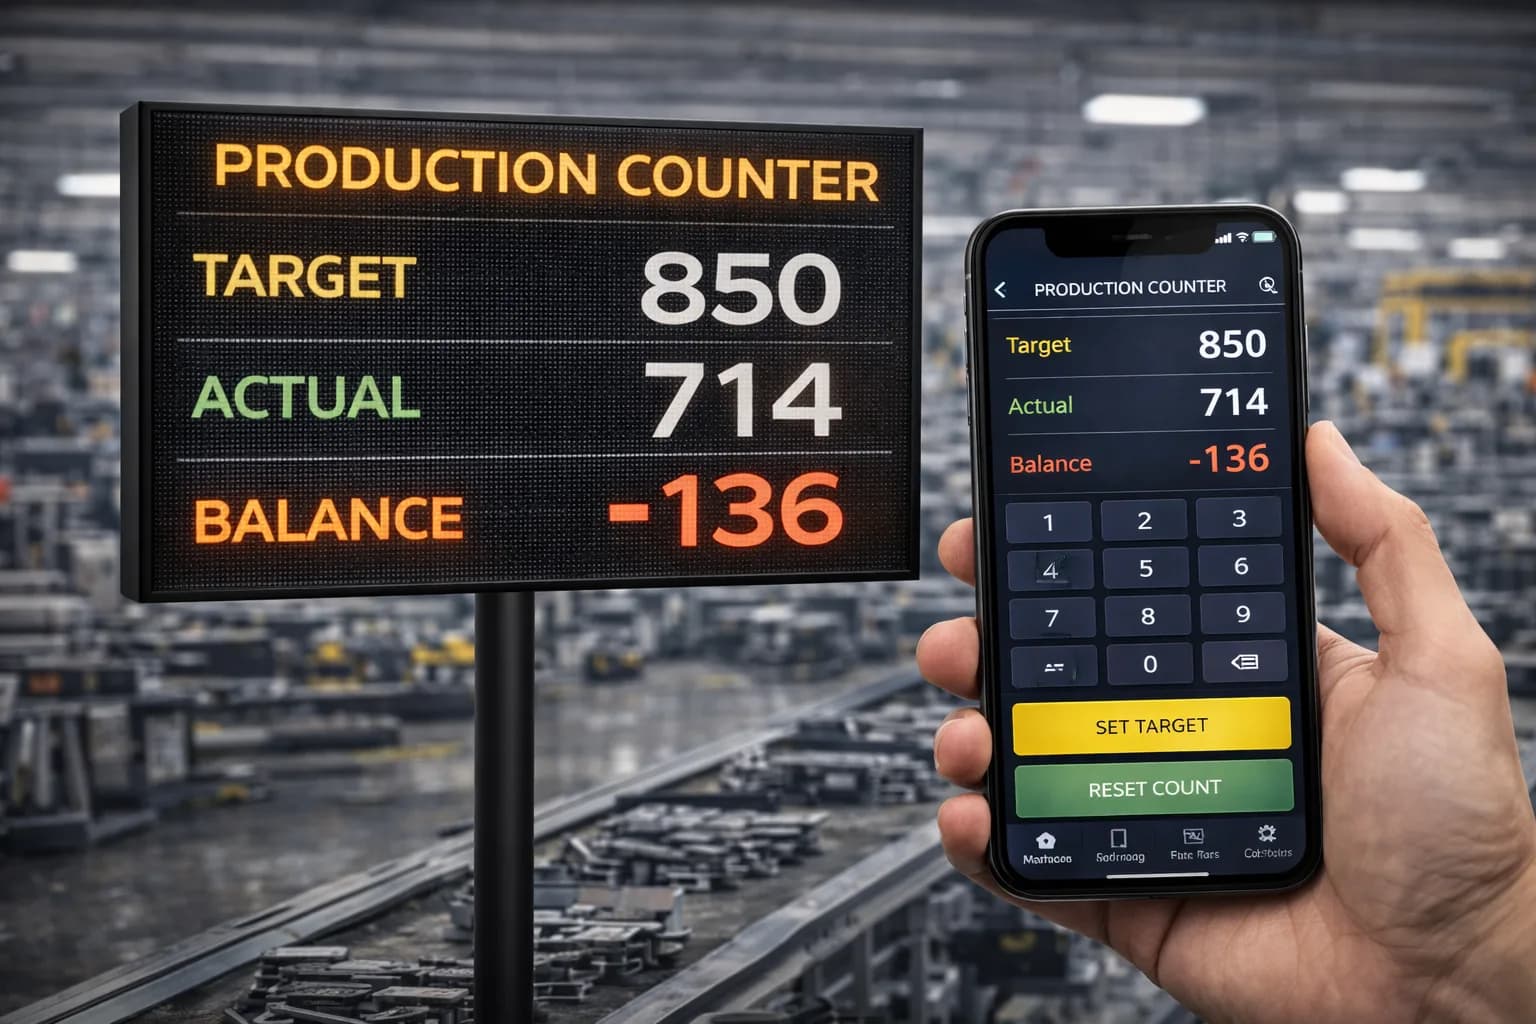
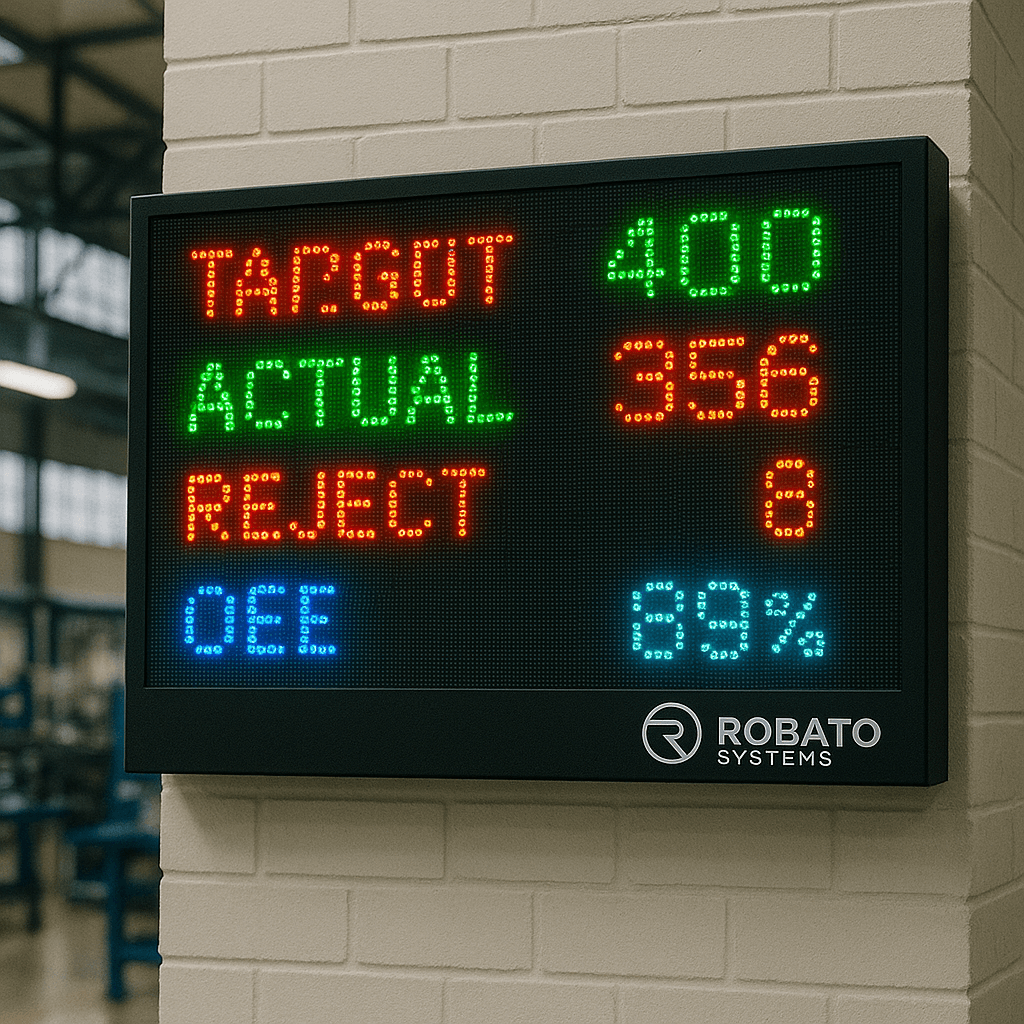
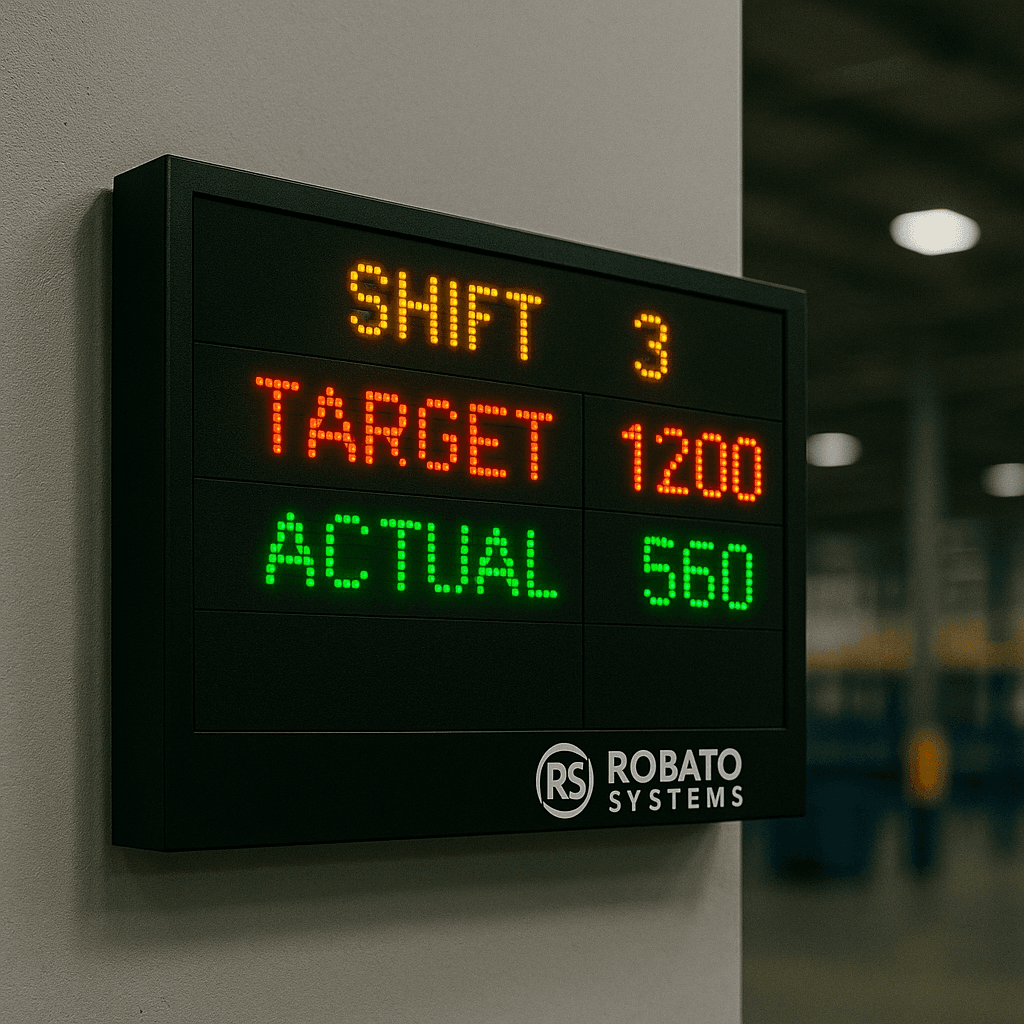
For example, a production dashboard may show:
Target Production: 10,000 units
Actual Production: 9,400 units
Production output provides the basic measurement needed for further efficiency analysis.
3. Production Target Achievement
Target achievement compares actual production with planned production.
A common calculation is:
Production Achievement = Actual Production / Target Production x 100
For example:
Actual production = 9,500 units
Target production = 10,000 units
Production achievement = 95%
This KPI helps production managers understand whether production plans are being achieved.
4. Machine Availability
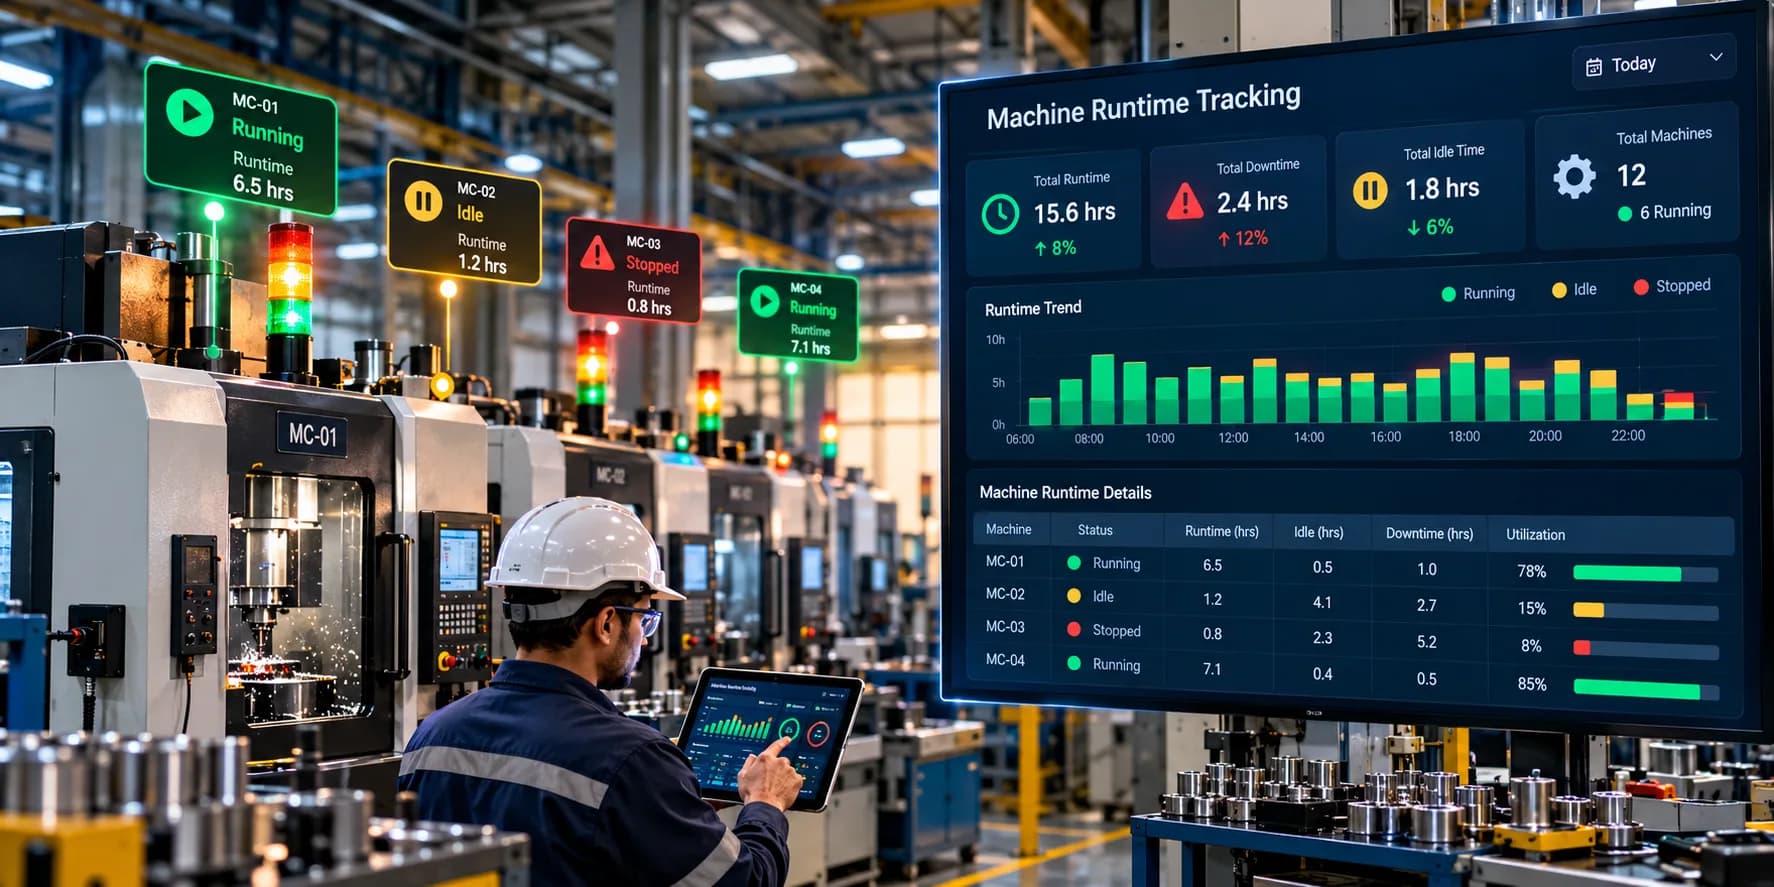
Machine availability measures how much scheduled production time equipment was available for operation.
Machine availability can be affected by:
- Equipment breakdowns
- Maintenance
- Setup
- Changeovers
- Other planned or unplanned stoppages
Monitoring availability helps manufacturers understand whether equipment is available when production requires it.
5. Machine Utilization
Machine utilization measures how much available machine capacity is actually being used.
Low utilization may indicate:
- Low production demand
- Excess machine capacity
- Production scheduling problems
- Material shortages
- Workforce constraints
- Frequent stoppages
Machine utilization should be interpreted according to the production environment and planned operating schedule.
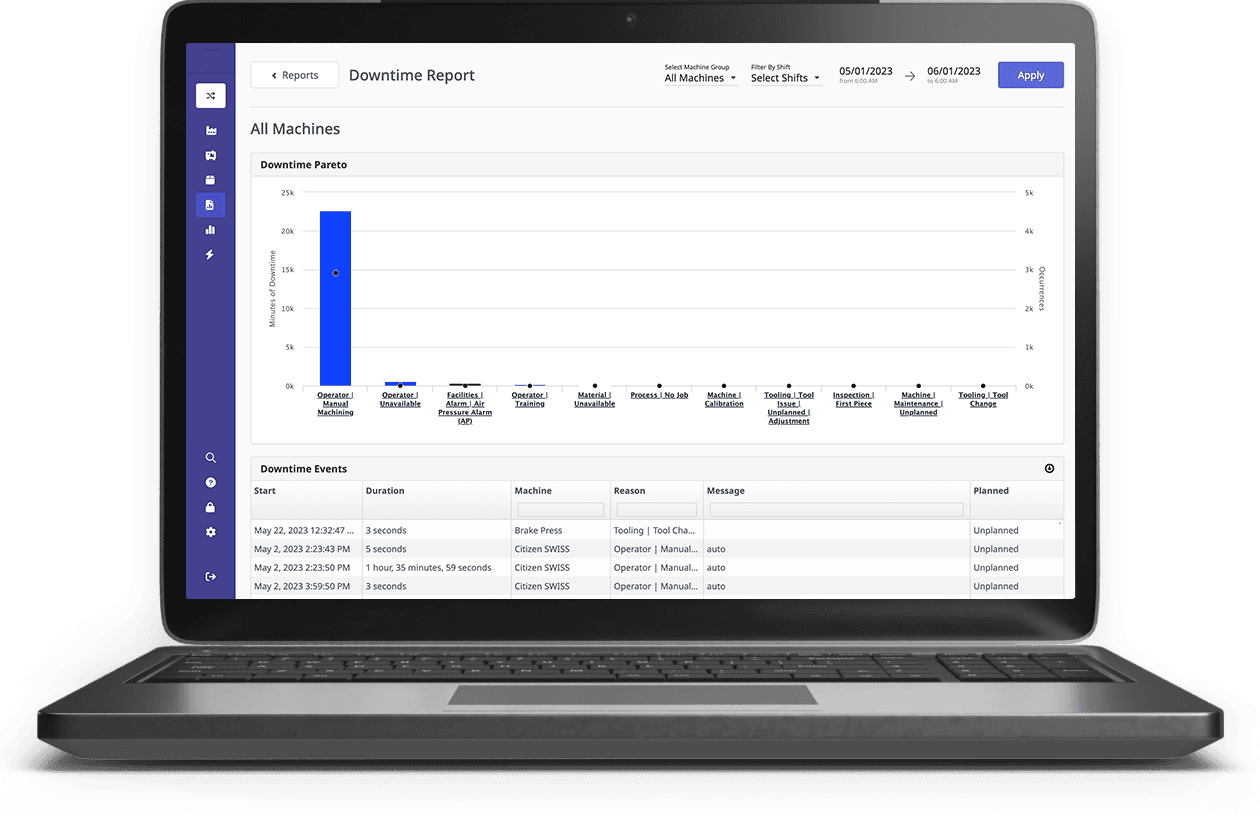
6. Downtime
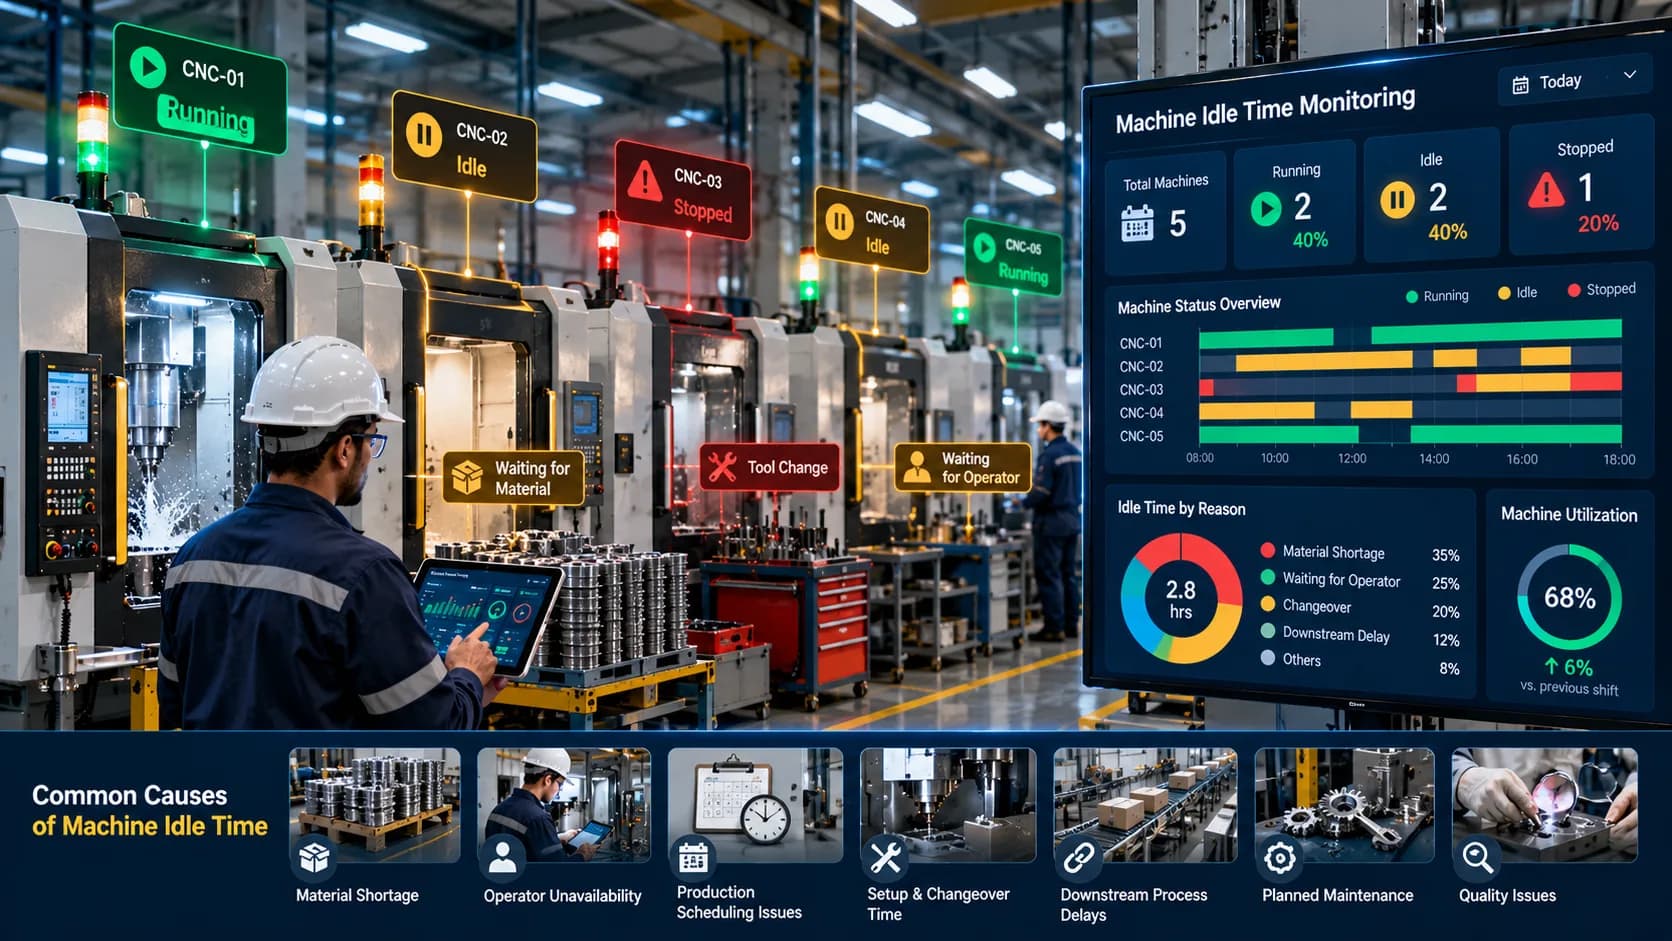
Downtime measures the amount of time when a machine or production process is not producing as expected.
Downtime can be divided into categories such as:
- Mechanical breakdown
- Electrical failure
- Maintenance
- Material shortage
- Changeover
- Quality issue
- Planned stoppage
- Other operational reasons
Tracking downtime duration and frequency helps identify major production losses.
7. Downtime by Reason
Total downtime is useful, but understanding the reason behind downtime provides additional insight.
A downtime dashboard can show:
- Mechanical downtime
- Electrical downtime
- Material-related downtime
- Changeover downtime
- Quality-related downtime
- Maintenance downtime
For example, if material shortages account for a significant portion of downtime, production teams may need to investigate material planning and supply processes.
8. Cycle Time
Cycle time measures the time required to produce a unit or complete a defined production operation.
If a machine produces one component every 30 seconds, its cycle time is 30 seconds per component under the defined operating conditions.
Cycle time can help identify:
- Slow machines
- Process bottlenecks
- Production variations
- Performance losses
Comparing actual cycle time with the expected or standard cycle time can provide useful performance information.
9. Production Rate
Production rate measures how quickly products are being manufactured.
It can be expressed as:
- Units per minute
- Units per hour
- Units per shift
Monitoring production rate in real time can help identify whether a production line is operating at its expected speed.
10. First Pass Yield
First Pass Yield (FPY) measures the percentage of products that meet quality requirements without requiring rework.
A simplified calculation is:
FPY = Good Units Produced Without Rework / Total Units Produced x 100
A low first-pass yield can indicate process variation, equipment issues, material problems, or other quality-related challenges.
11. Scrap Rate
Scrap rate measures the percentage of production that cannot be used as a finished product because of defects or other reasons.
High scrap rates can increase:
- Material costs
- Production costs
- Processing time
- Waste
- Production losses
Tracking scrap alongside production output provides a more complete picture of manufacturing efficiency.
12. Rework Rate
Rework occurs when products require additional processing before they can meet the required specifications.
A high rework rate may indicate:
- Process instability
- Quality problems
- Equipment issues
- Operator training requirements
- Material problems
Reducing unnecessary rework can improve both production efficiency and manufacturing costs.
13. Operator Utilization
Machines are not the only resources that affect manufacturing productivity.
Operators also contribute directly to production.
Operator utilization measures how available operator time is used for defined productive or operational activities.
It can help identify:
- Productive time
- Idle time
- Waiting time
- Downtime exposure
- Workforce allocation issues
Operator utilization becomes particularly useful when combined with production output and machine performance.
14. Production Per Operator
Production per operator measures the amount of output associated with each operator.
A basic calculation is:
Production Per Operator = Total Production / Number of Operators
This metric can help manufacturing managers understand workforce productivity.
It should be interpreted alongside machine performance, product complexity, downtime, and process requirements.
15. Manufacturing Lead Time
Manufacturing lead time measures the time required for a production order or process to move through the manufacturing system.
Long lead times may be associated with:
- Waiting
- Bottlenecks
- Material shortages
- Long changeovers
- Quality problems
- Production scheduling issues
Monitoring lead time can help manufacturers identify opportunities to improve production flow.
Production Efficiency Metrics by Category
Rather than viewing all metrics as one large list, manufacturers can organize them into several categories.
Production Metrics
- Production output
- Production rate
- Target achievement
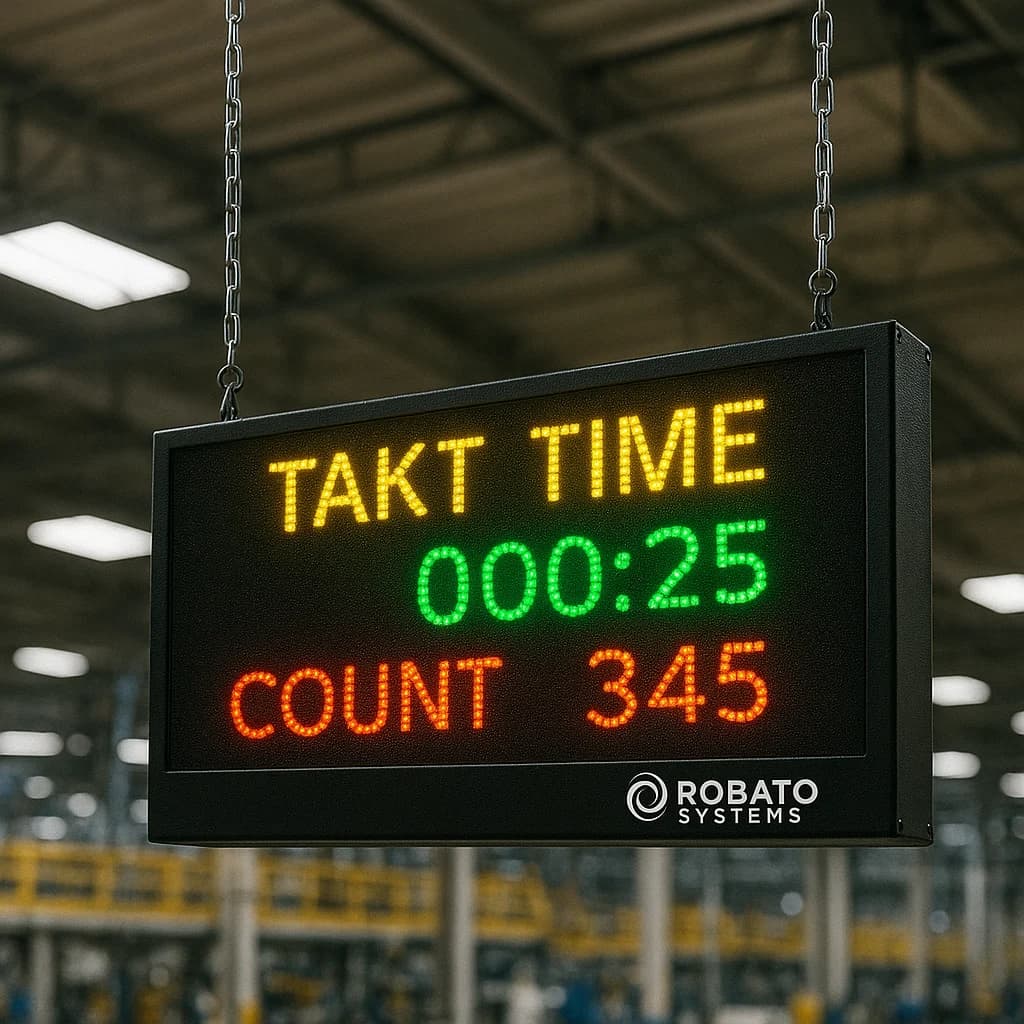
- Cycle time
Equipment Metrics
- OEE
- Availability
- Performance
- Machine utilization
- Downtime
Quality Metrics
- First-pass yield
- Scrap rate
- Rework rate
- Defect rate
Workforce Metrics
- Operator utilization
- Production per operator
- Operator productivity
Flow Metrics
- Manufacturing lead time
- Changeover time
- Waiting time
- Bottleneck duration
This structure can make production dashboards easier to understand.
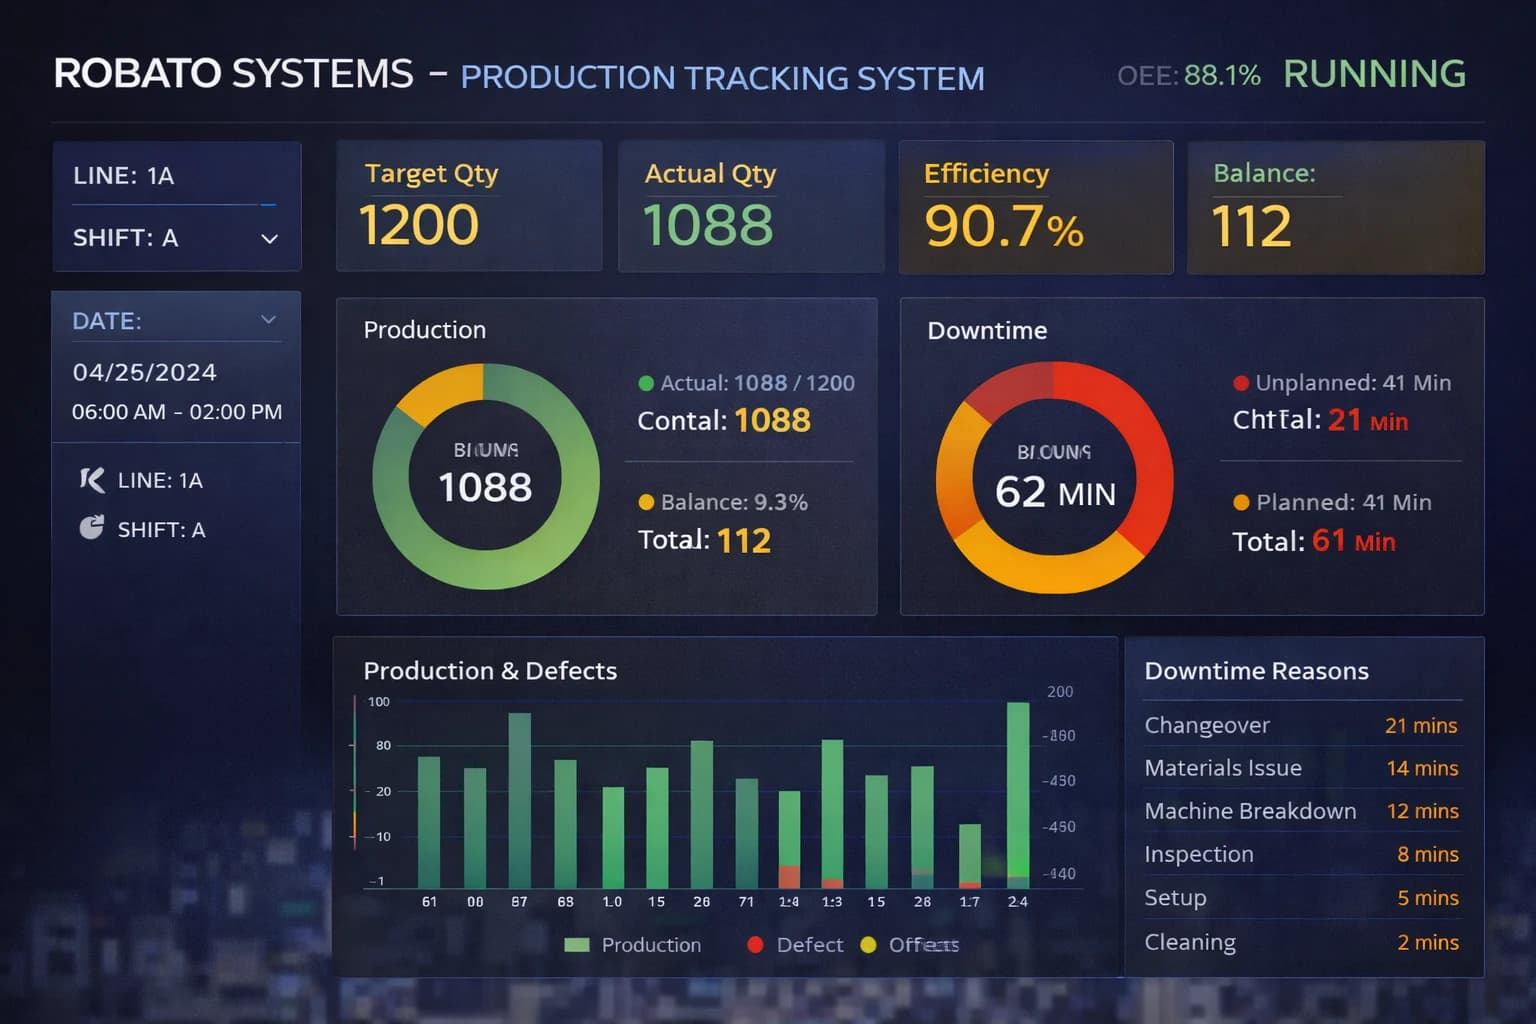
Production Efficiency Metrics Dashboard
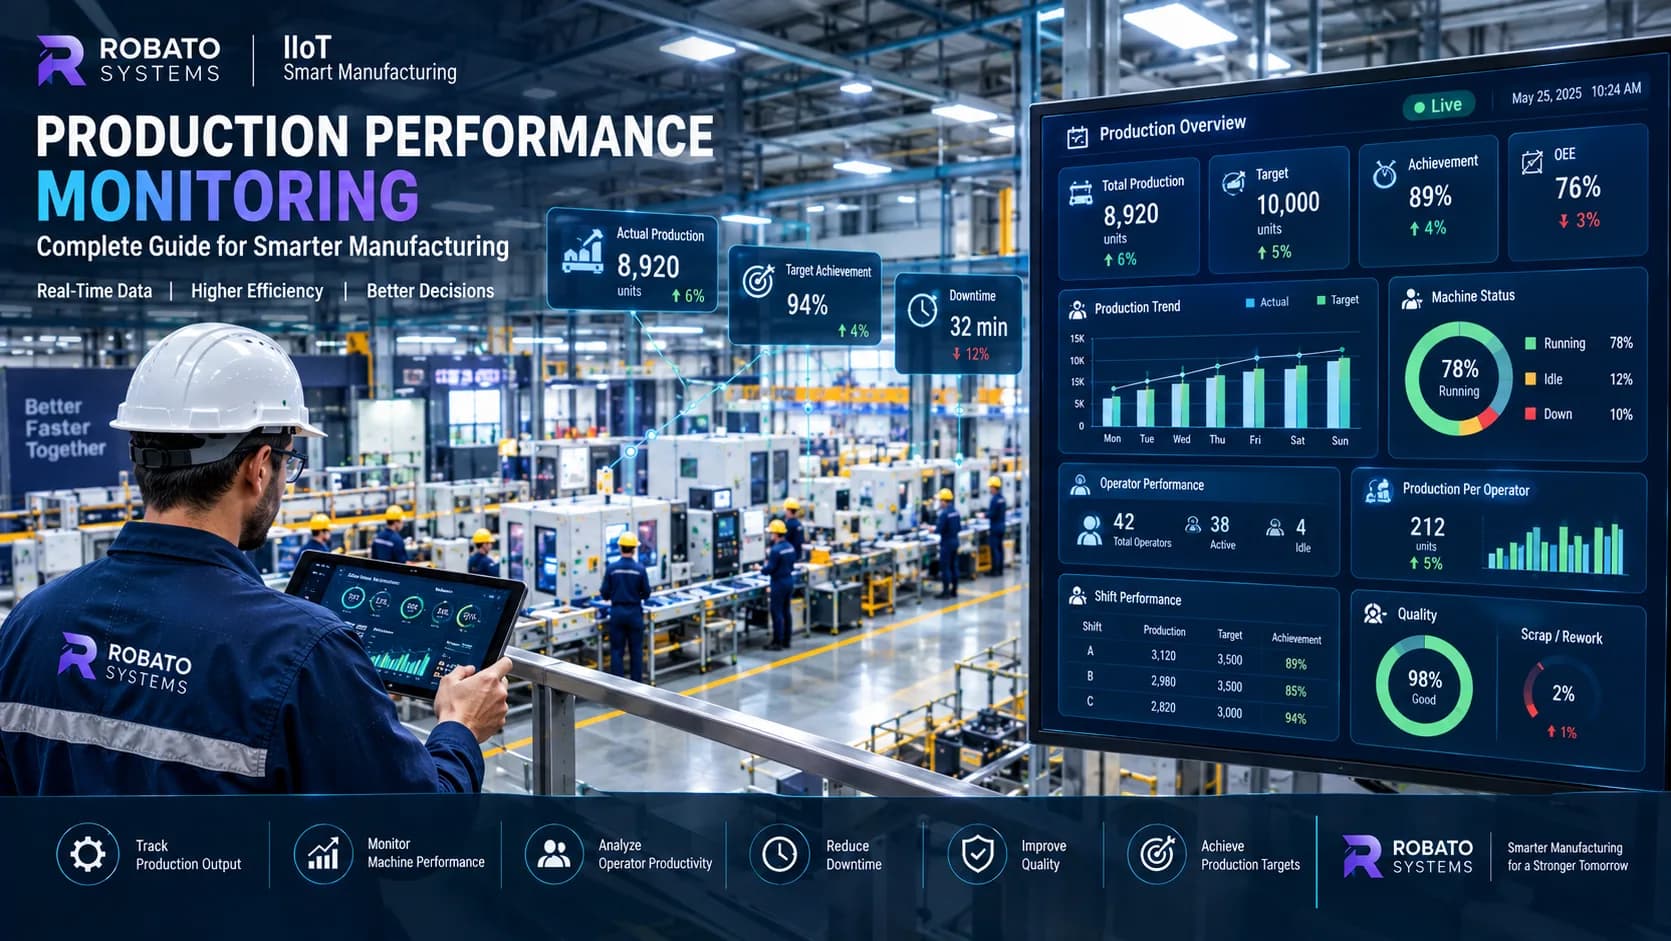
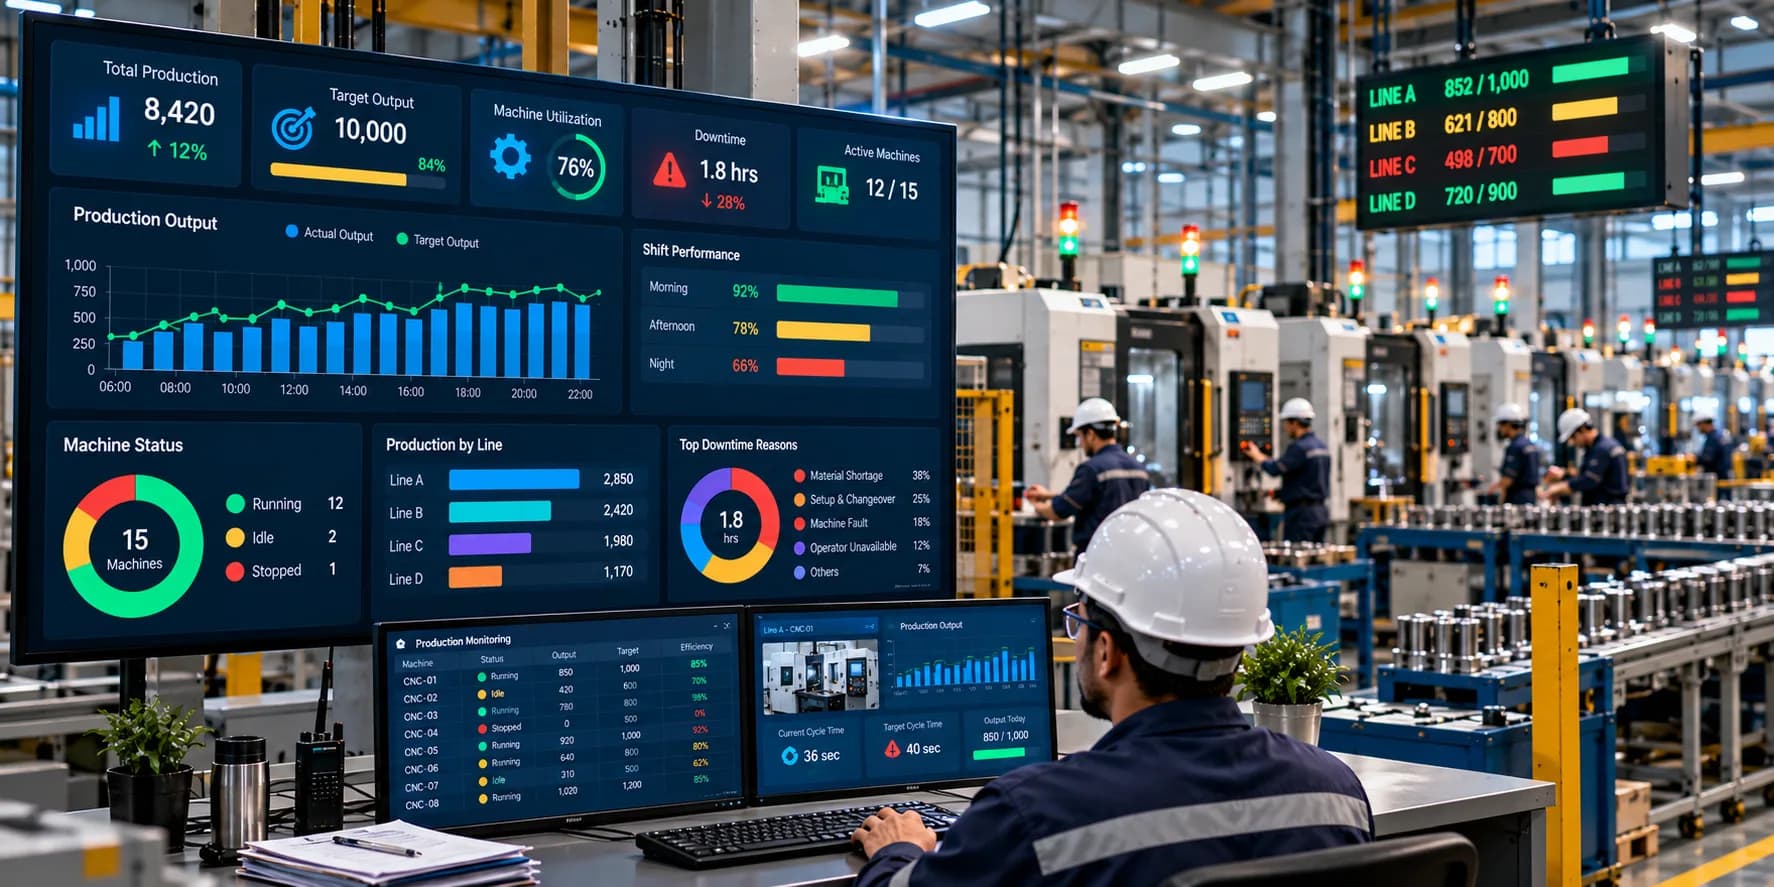
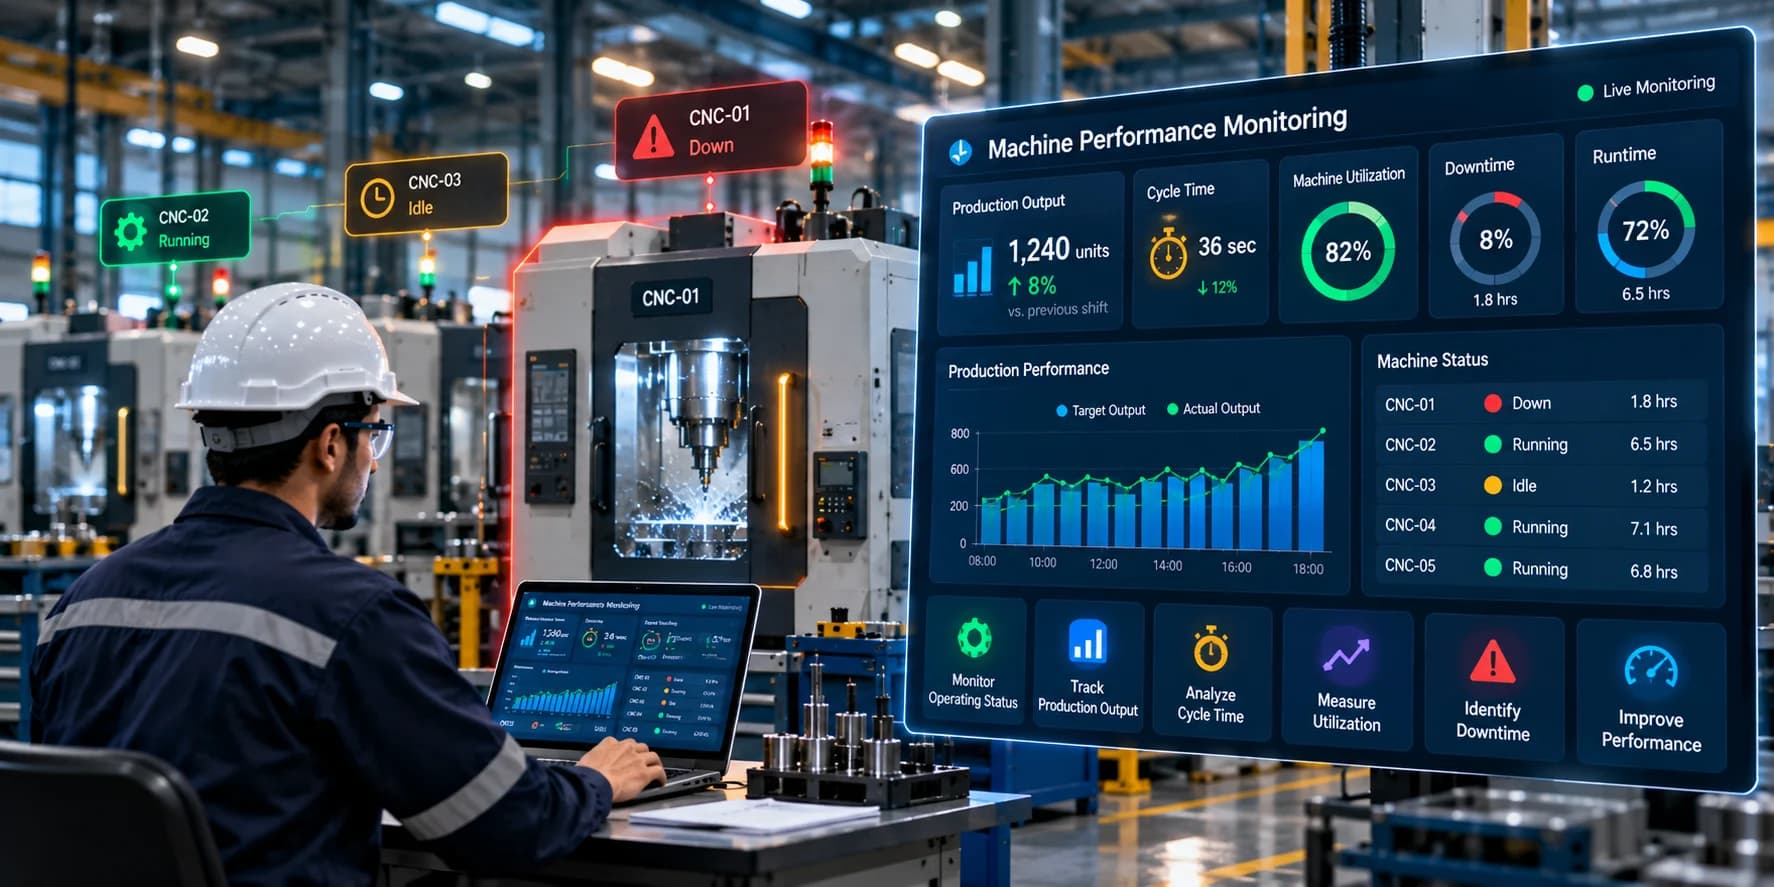
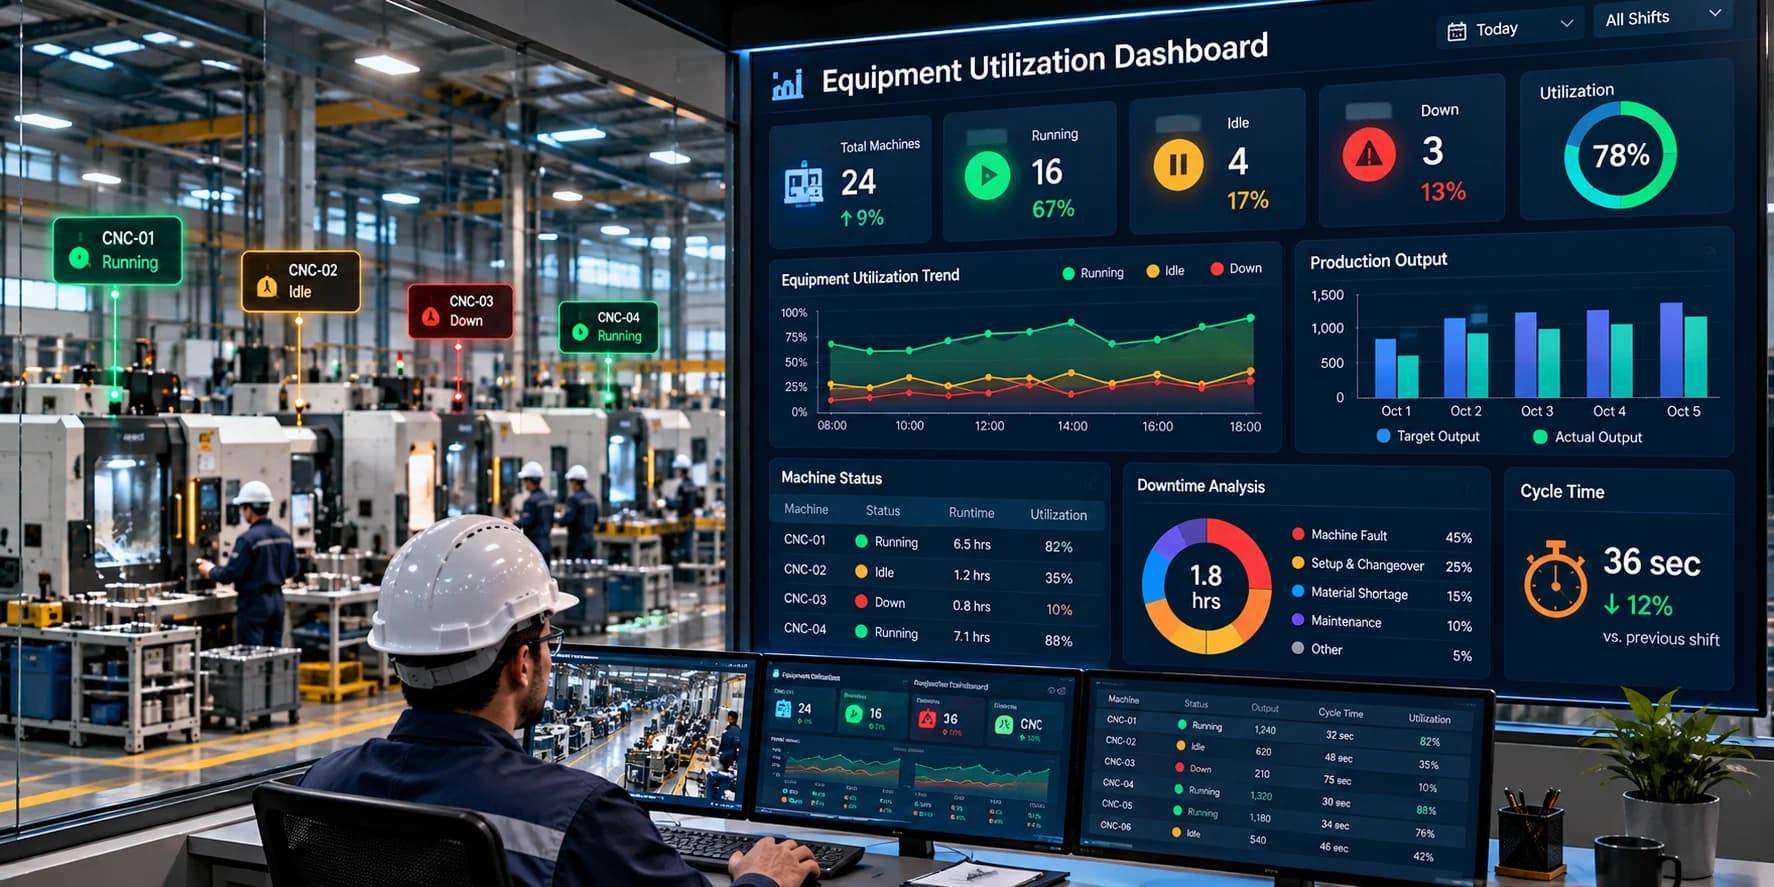
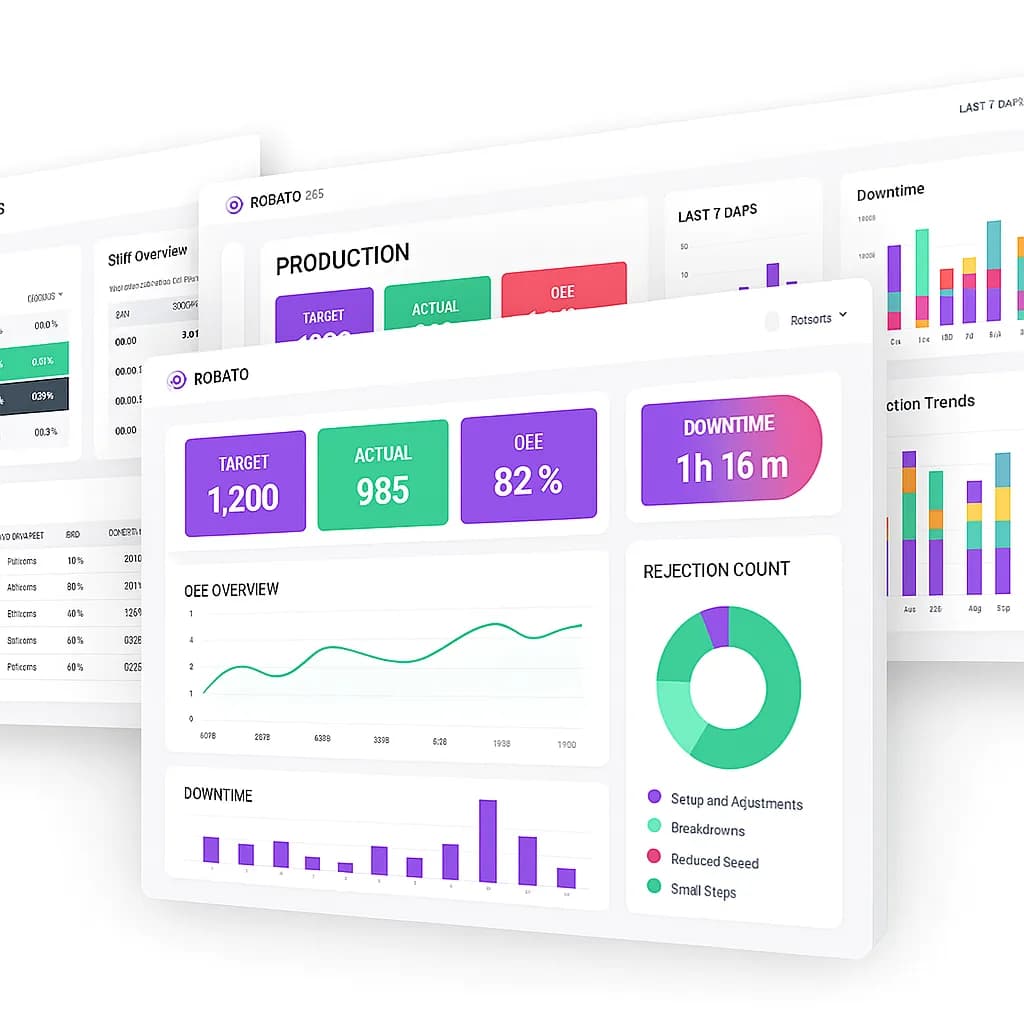
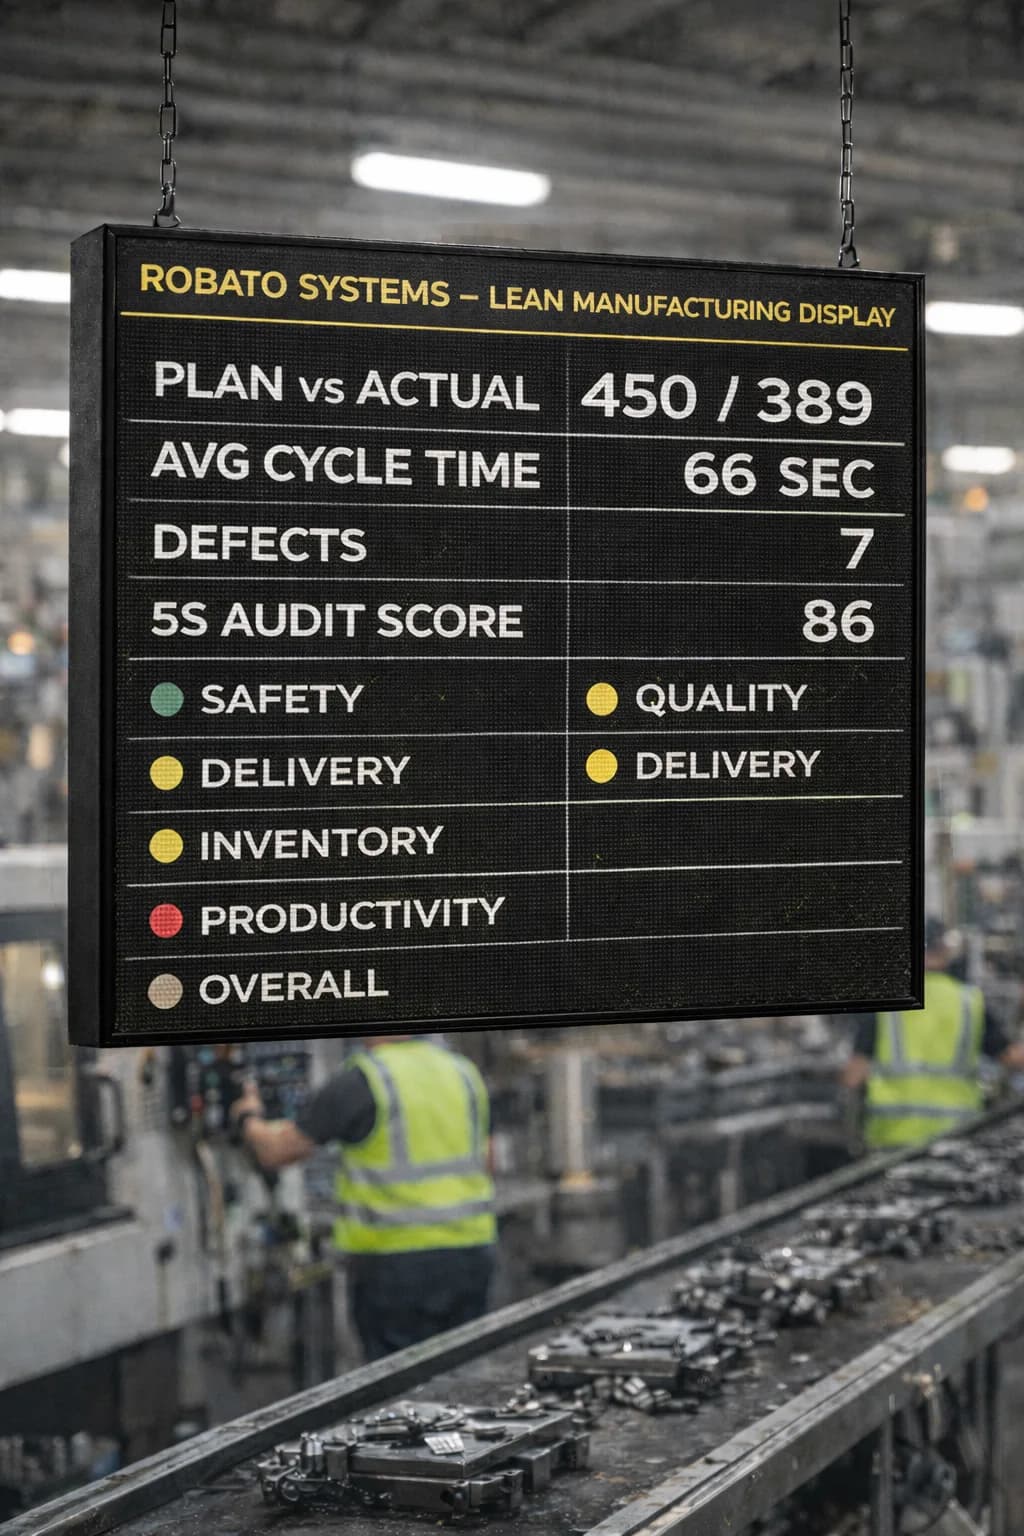
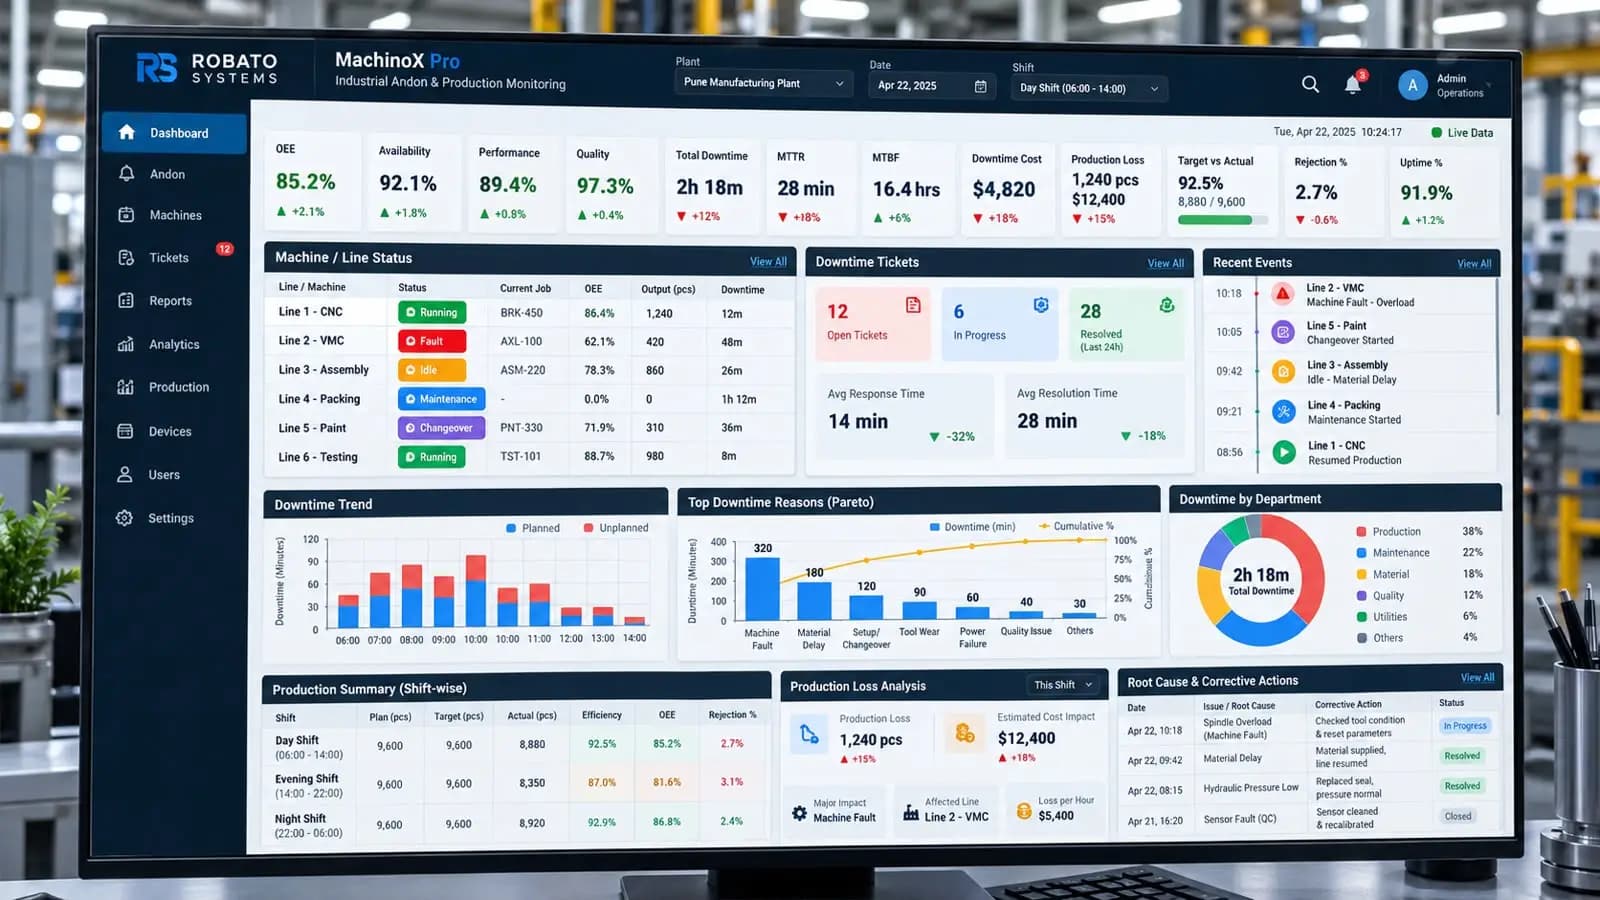
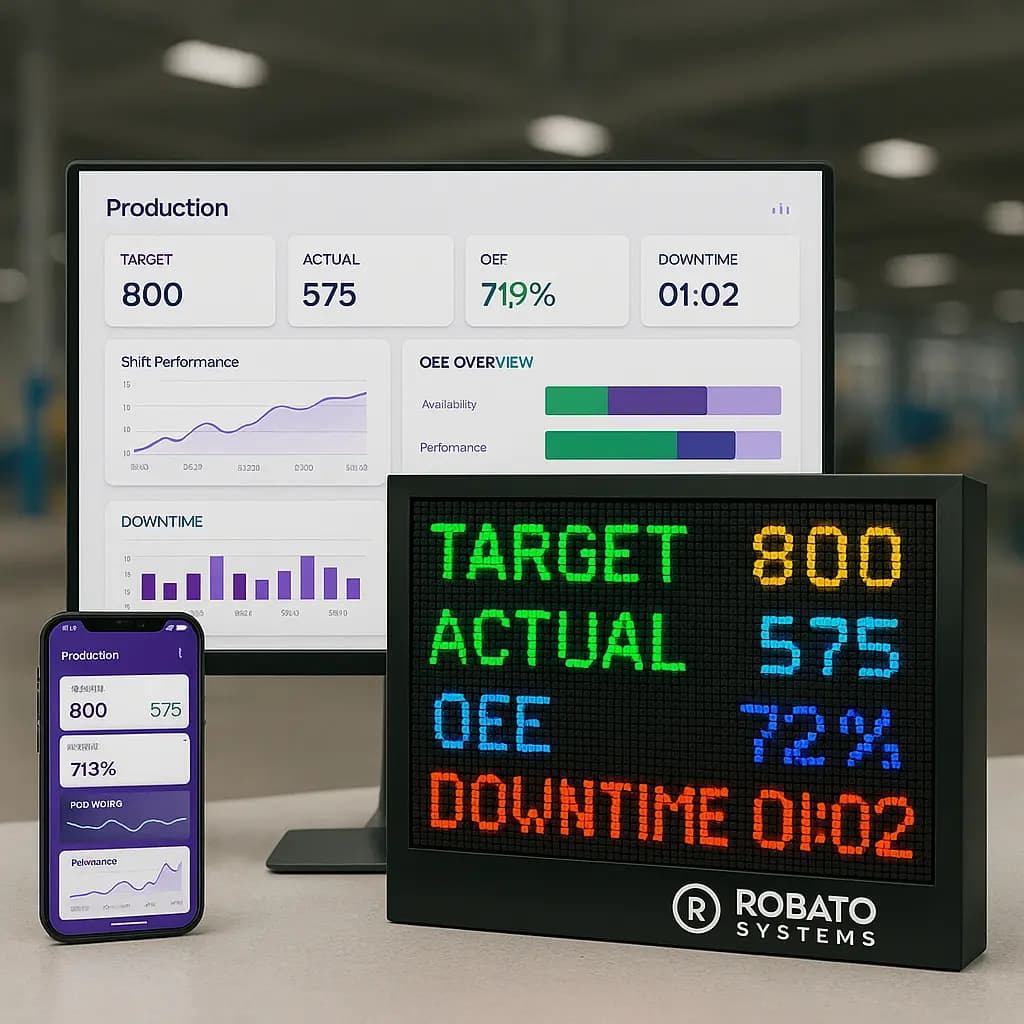
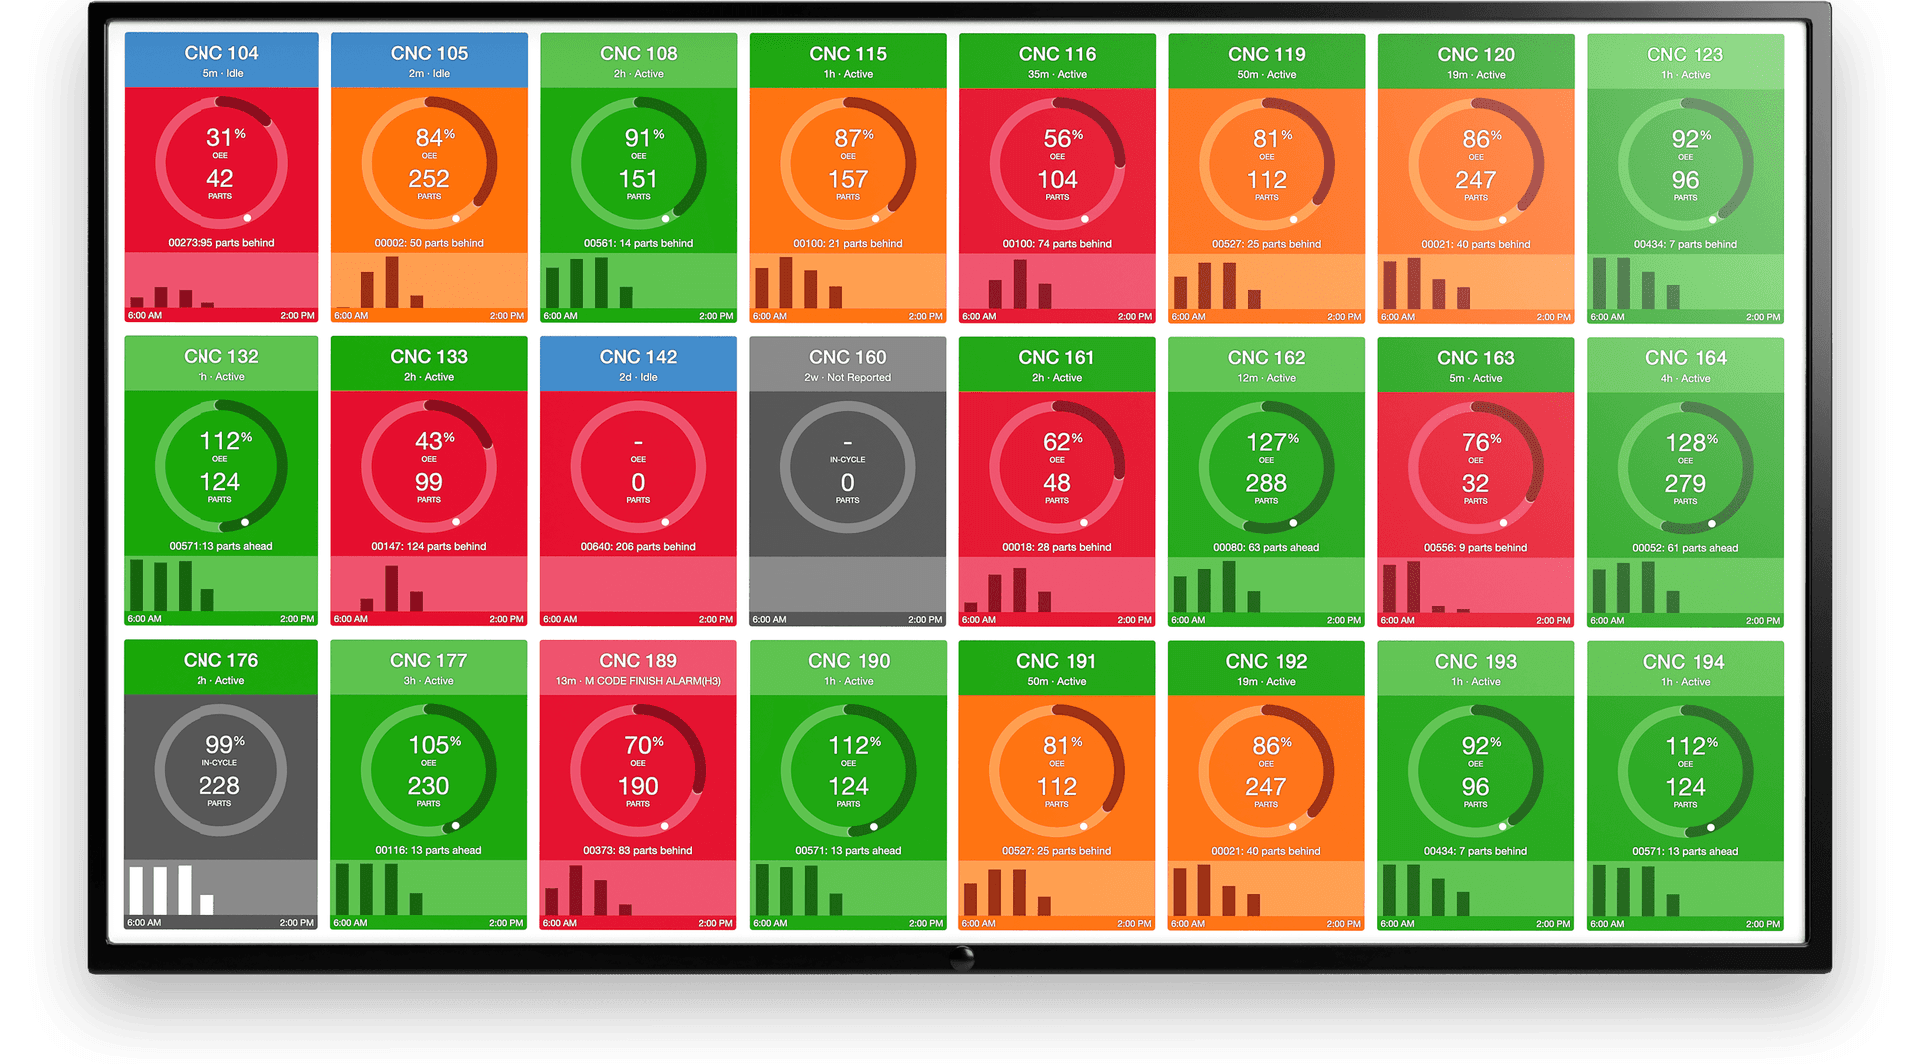
A production efficiency dashboard should provide a clear overview of important manufacturing KPIs.
A typical dashboard can include:
Production
- Target production
- Actual production
- Production achievement
- Production rate
Equipment
- OEE
- Availability
- Performance
- Machine utilization
Downtime
- Total downtime
- Downtime by reason
- Downtime by machine
- Downtime by shift
Quality
- Good production
- Scrap
- Rework
- Quality rate
Workforce
- Operator utilization
- Production per operator
- Active operators
Trends
- Daily production
- Weekly efficiency
- Monthly OEE
- Downtime trends
- Productivity trends
The dashboard should prioritize KPIs that production teams can act upon.
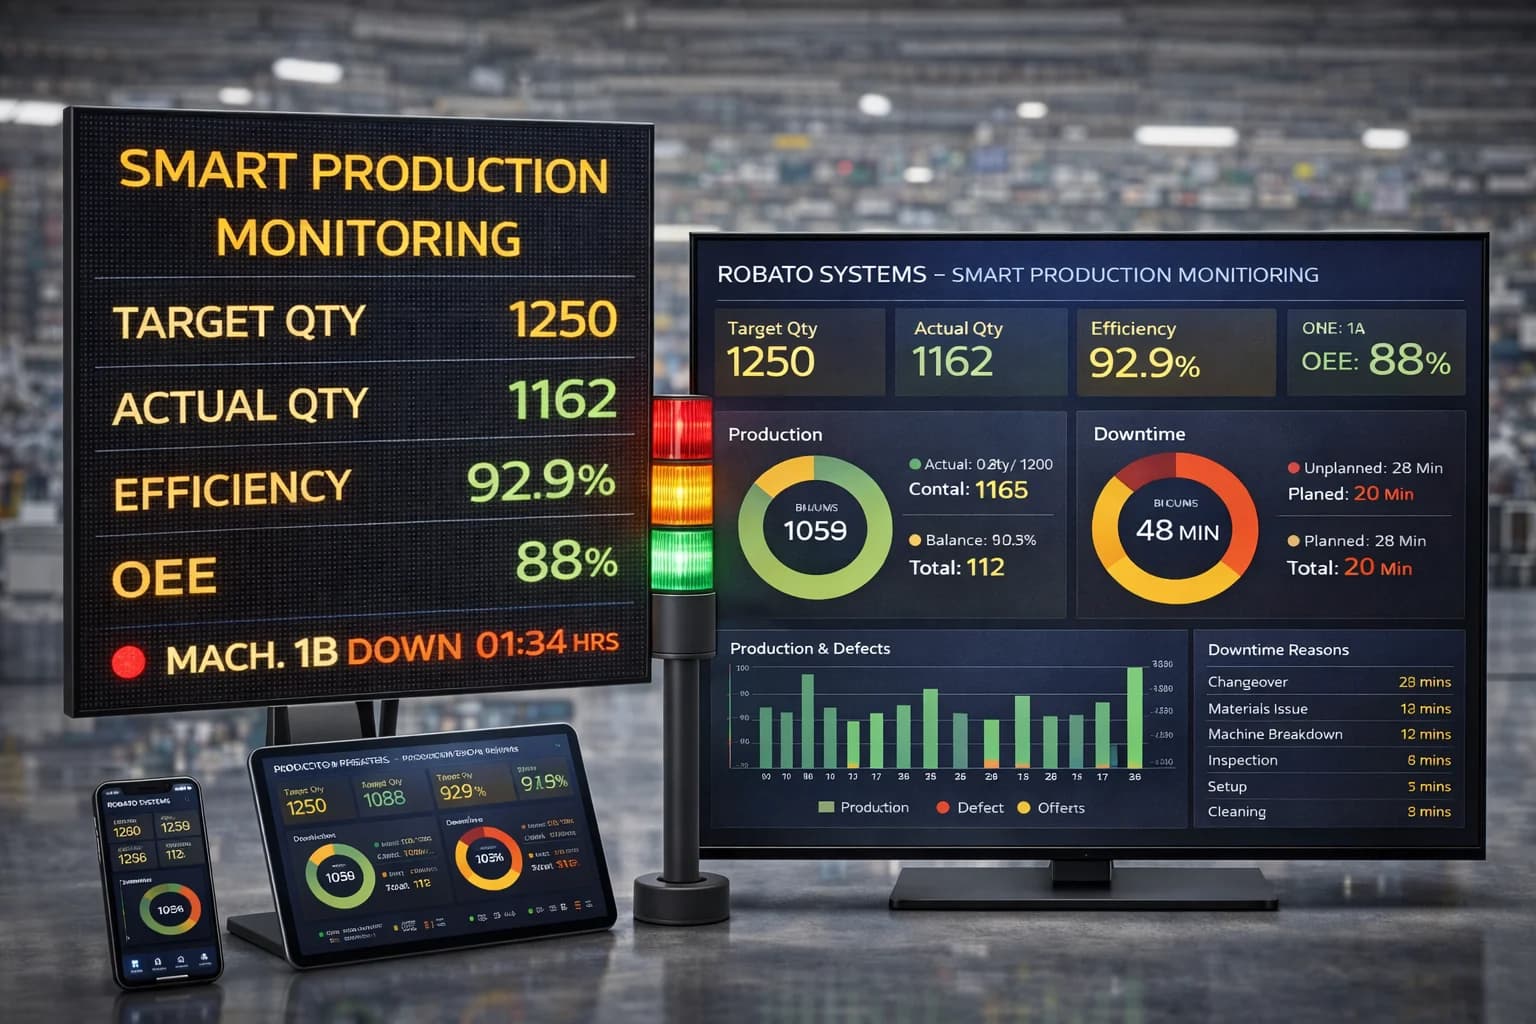
Real-Time Production Efficiency Monitoring
Traditional manufacturing reports often provide information after a shift has finished.
Real-time production monitoring provides a different approach.
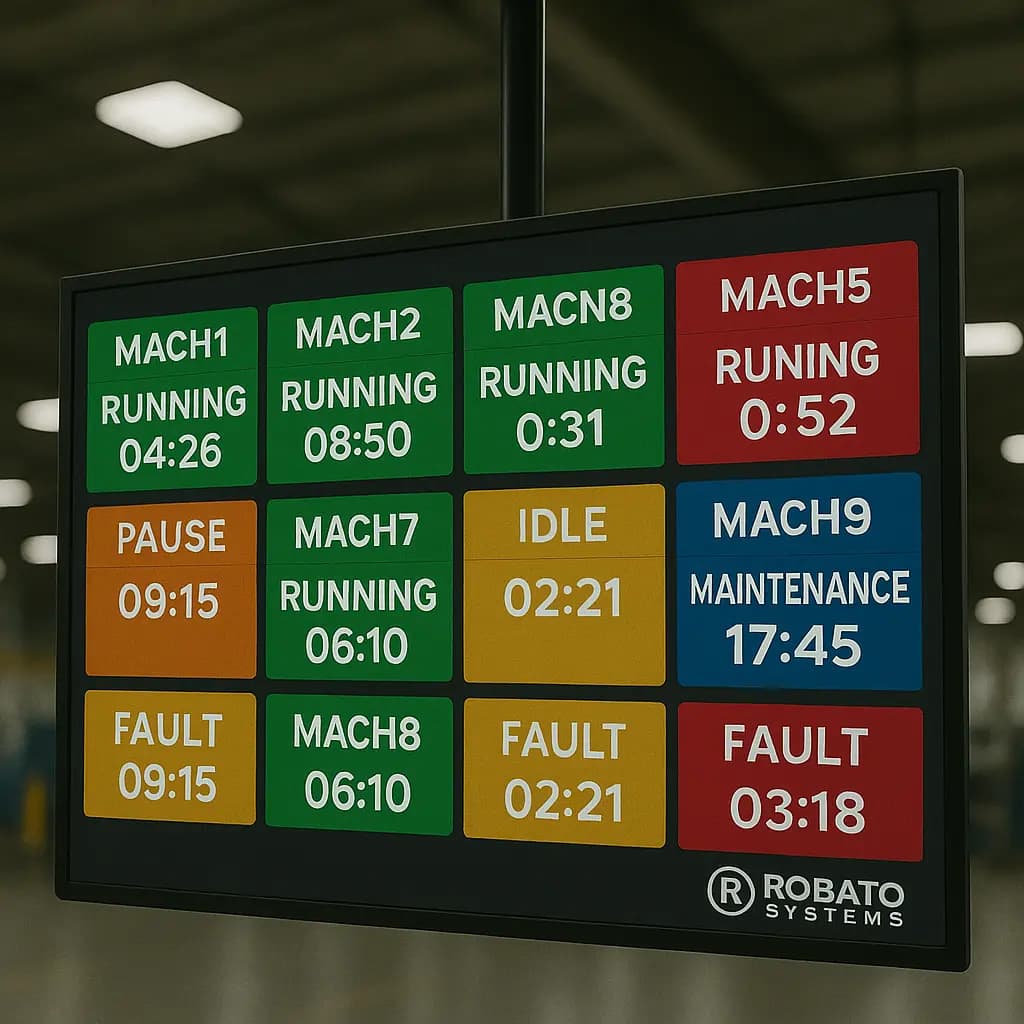
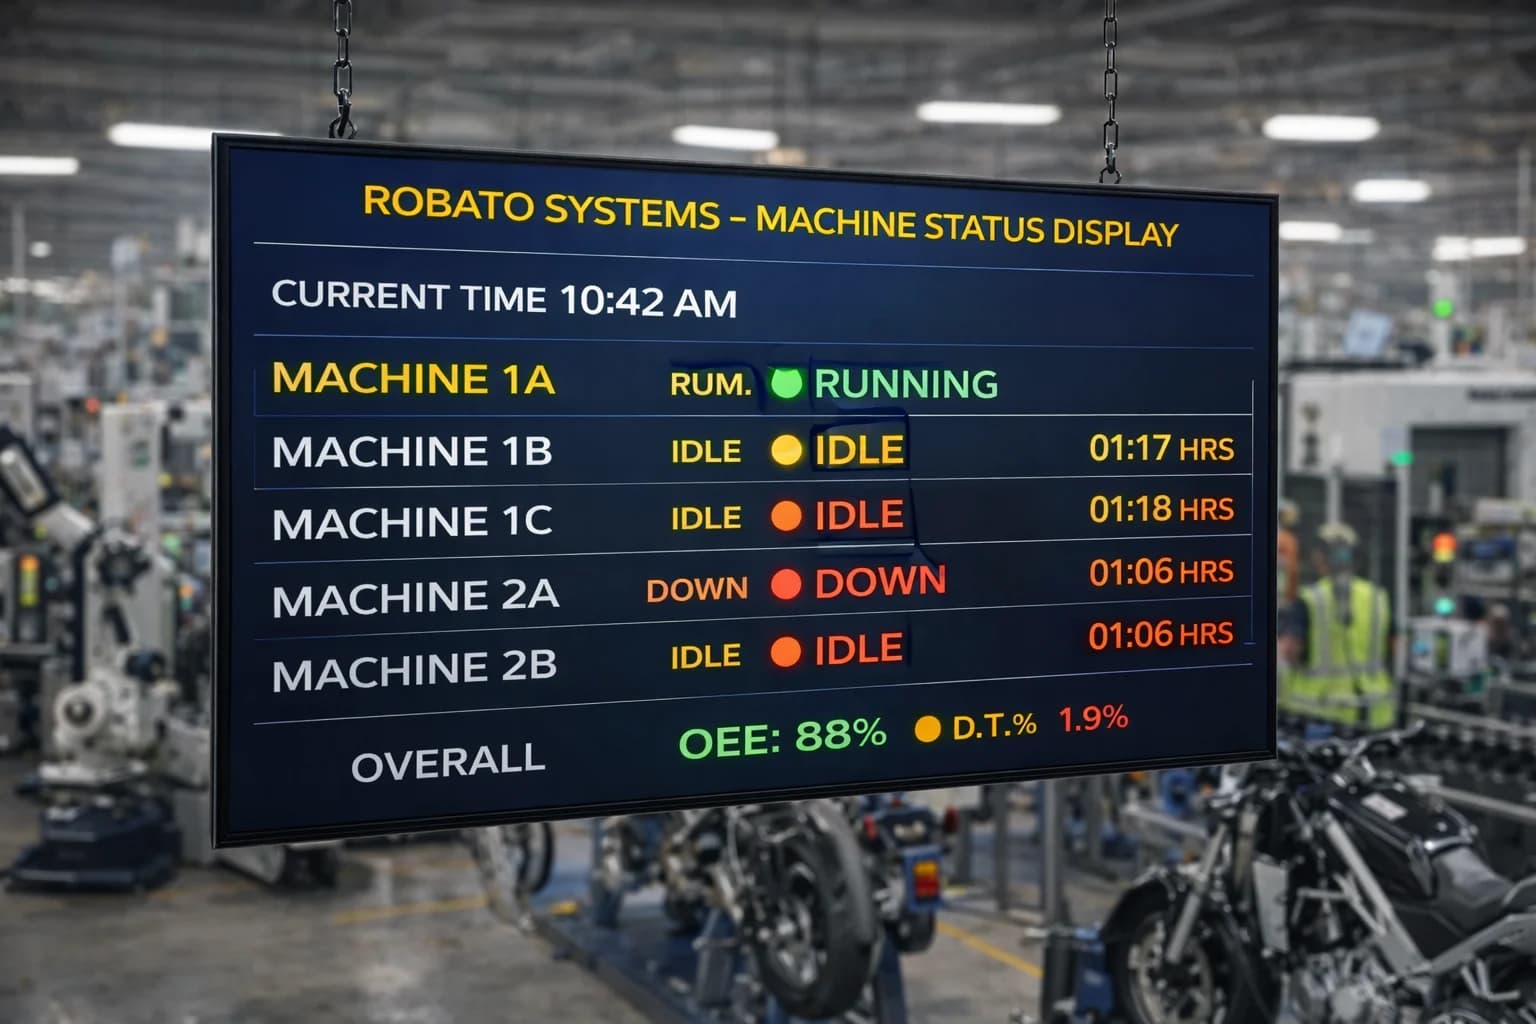
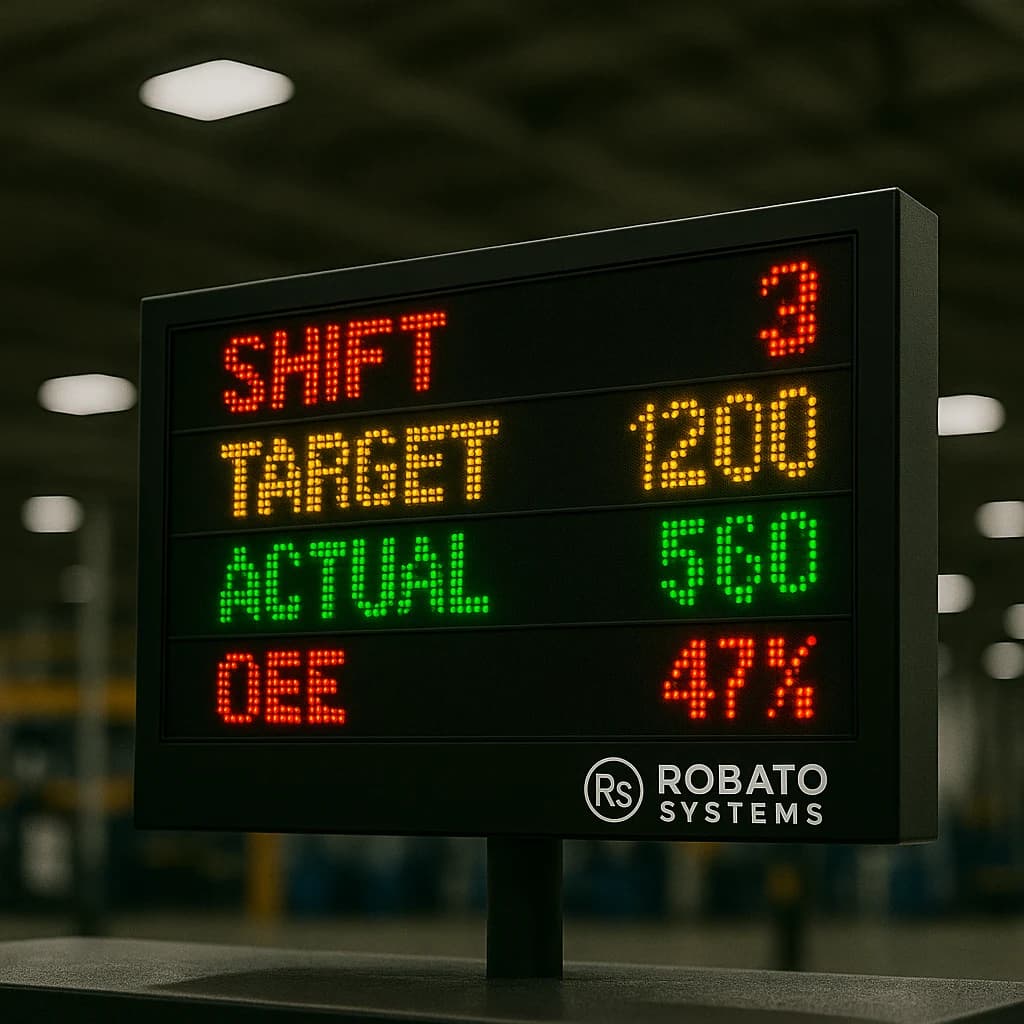
A supervisor can see:
- Current production
- Current target
- Machine status
- Active downtime
- Production rate
- OEE
- Operator information
If a production line starts falling behind target, the issue can be investigated immediately.
For example:
Production target falling behind
↓
Check machine status
↓
Identify downtime
↓
Check downtime reason
↓
Investigate root cause
↓
Take corrective action
This approach helps reduce the time between identifying a production problem and responding to it.
Production Efficiency Metrics by Shift
Shift-level analysis is important for plants operating multiple shifts.
Managers can compare:
- Production per shift
- Target achievement
- OEE
- Downtime
- Machine utilization
- Operator utilization
- Quality performance
However, shift comparisons should account for differences in:
- Product mix
- Production schedule
- Planned maintenance
- Staffing
- Changeovers
- Operating conditions
This provides a more meaningful comparison.
Production Efficiency Metrics by Machine
Machine-level analysis can help identify equipment that consistently contributes to production losses.
A machine performance dashboard can show:
- Production output
- OEE
- Availability
- Performance
- Downtime
- Cycle time
- Production rate
This can help maintenance and production teams prioritize investigation.
Production Efficiency Metrics by Production Line
For factories with multiple production lines, line-level KPI monitoring provides another useful layer of analysis.
Managers can compare:
- Production output
- Production achievement
- OEE
- Downtime
- Quality
- Operator utilization
- Production per operator
This can help identify production lines that require further analysis.
How Production Efficiency Metrics Help Reduce Downtime
Downtime is one of the major sources of lost production capacity.
Production efficiency metrics help manufacturers identify:
- Which machines stop most frequently
- Which downtime reasons occur most often
- How long machines remain stopped
- Which shifts experience the most downtime
- How downtime affects production output
For example, frequency analysis may reveal that a machine experiences many short stoppages rather than one long breakdown.
Both situations affect production, but they may require different improvement strategies.
How Production Efficiency Metrics Improve Workforce Productivity
Workforce productivity can be affected by many operational conditions.
An operator may experience lost production time because:
- A machine breaks down
- Materials are unavailable
- The production line is waiting
- A changeover is taking place
- An upstream process is delayed
By connecting operator data with production and machine data, manufacturers can understand the broader causes of workforce productivity losses.
This prevents workforce metrics from being analyzed without operational context.
Production Efficiency Metrics and Continuous Improvement
Production KPIs become especially valuable when they support a continuous improvement process.
A simple improvement cycle is:
Measure → Analyze → Identify Loss → Improve → Monitor
For example:
- Measure machine downtime.
- Identify the most frequent downtime reason.
- Investigate the underlying cause.
- Implement an improvement.
- Monitor the KPI afterward.
- Determine whether the loss has decreased.
The same process can be applied to:
- Production efficiency
- Quality
- Operator utilization
- Changeover time
- Cycle time
- Machine utilization
How to Select the Right Production Efficiency Metrics
Manufacturers do not need to monitor every possible KPI.
The right metrics depend on the organization's objectives.
If the primary problem is equipment reliability, focus on:
- OEE
- Availability
- Downtime
- MTBF
- MTTR
If the main issue is workforce productivity, focus on:
- Operator utilization
- Production per operator
- Productive time
- Target achievement
If quality is the primary concern, focus on:
- First-pass yield
- Scrap rate
- Rework rate
- Defect rate
If production flow is the main challenge, focus on:
- Cycle time
- Changeover time
- Lead time
- Waiting time
- Production rate
The most effective KPI system aligns metrics with actual manufacturing objectives.
Common Mistakes in Production Efficiency Measurement
Measuring Too Many KPIs
A dashboard containing dozens of metrics may make it difficult to identify what actually requires attention.
Looking Only at Production Quantity
High output does not necessarily mean high efficiency.
Quality, downtime, utilization, and resource consumption also matter.
Ignoring Data Quality
Incorrect machine states or production counts can lead to inaccurate KPIs.
Comparing Different Processes Directly
Different machines, products, and production processes may have different performance characteristics.
Using Metrics Without Context
A low operator utilization value may result from machine downtime rather than workforce inefficiency.
Focusing Only on Historical Reports
Historical analysis is valuable, but real-time information can help teams respond before production losses increase.
Production Efficiency Metrics and Industry 4.0
Industry 4.0 manufacturing relies heavily on connected machines, sensors, data platforms, and digital analytics.
Production efficiency metrics become more powerful when collected automatically from the shop floor.
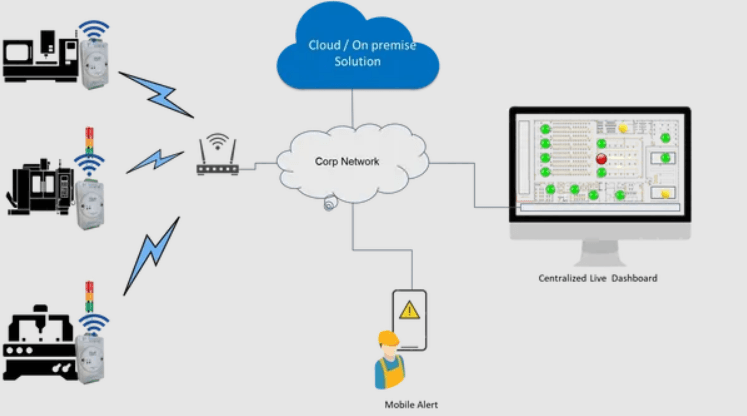
An Industry 4.0 architecture may look like:
Machines and Sensors
↓
IIoT Data Collection
↓
Manufacturing Data Platform
↓
KPI Calculation
↓
Real-Time Dashboard
↓
Production Decision
This reduces dependence on manual data collection and makes production information available faster.
Role of Manufacturing Productivity Software
Manufacturing productivity software can centralize production efficiency metrics in one platform.
Instead of manually combining:
- Production spreadsheets
- Machine reports
- Downtime records
- Operator reports
- Quality reports
a connected platform can bring relevant information together.
This can support:
- Real-time production monitoring
- KPI dashboards
- OEE monitoring
- Downtime analysis
- Operator productivity tracking
- Historical reporting
- Shift analysis
- Production trend analysis
How Robato Systems Supports Production Performance Monitoring
Robato Systems develops IIoT and manufacturing software solutions designed to provide connected visibility across production operations.
Its manufacturing solutions can bring together areas such as:
- Production monitoring
- OEE monitoring
- Machine performance
- Downtime monitoring
- Operator efficiency
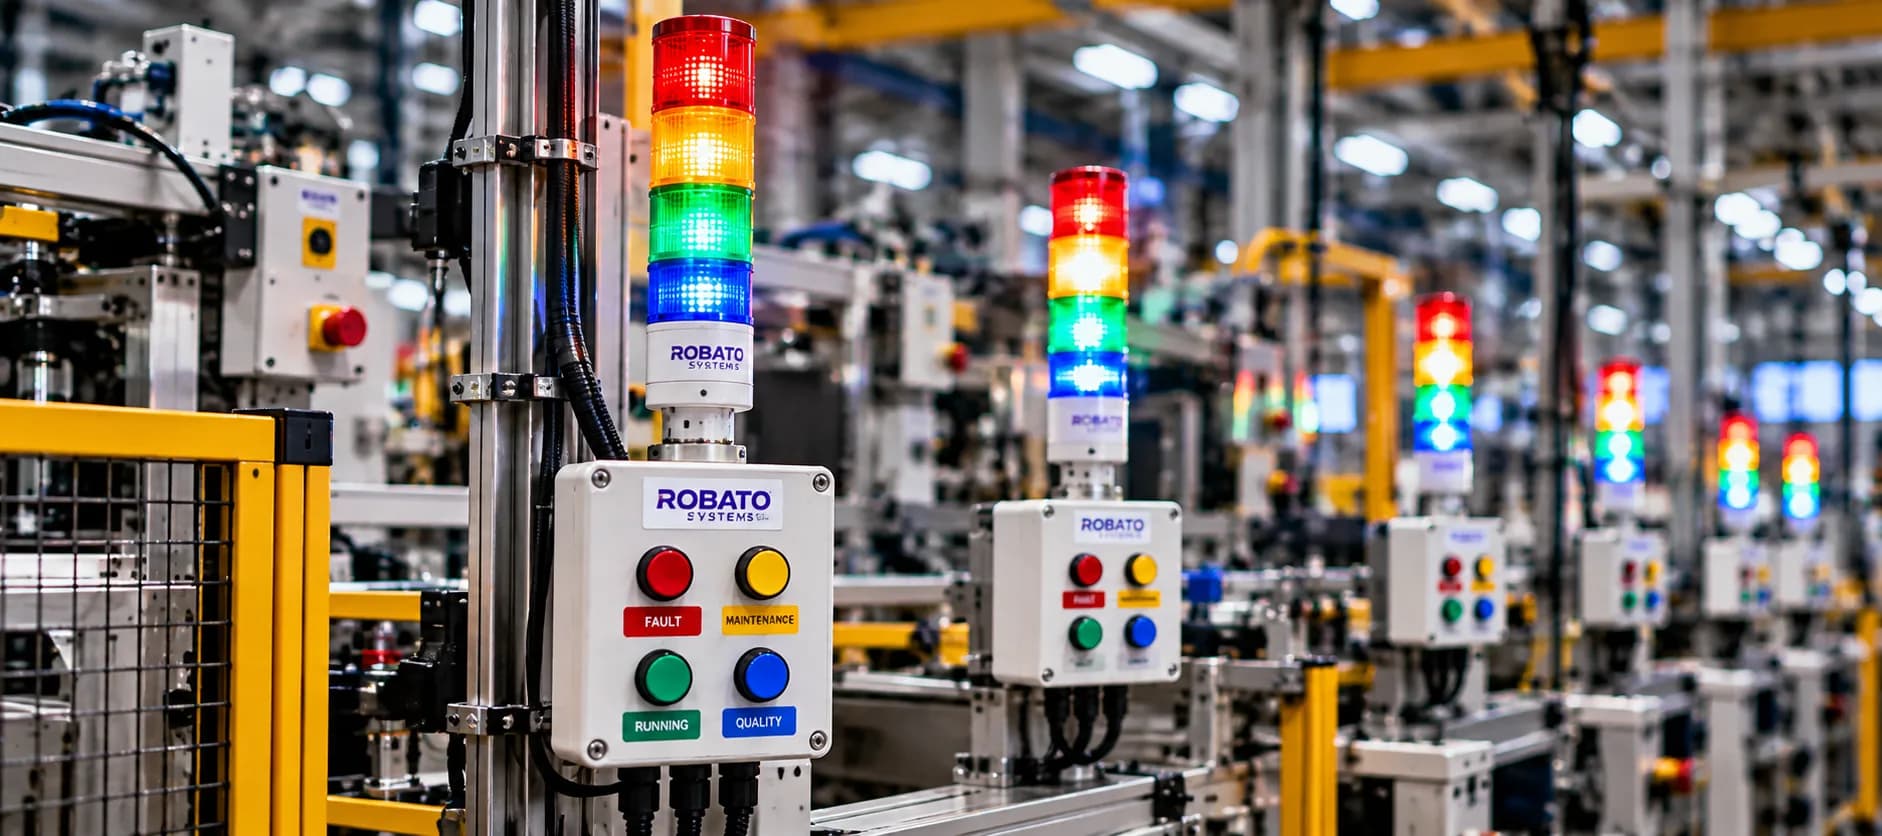
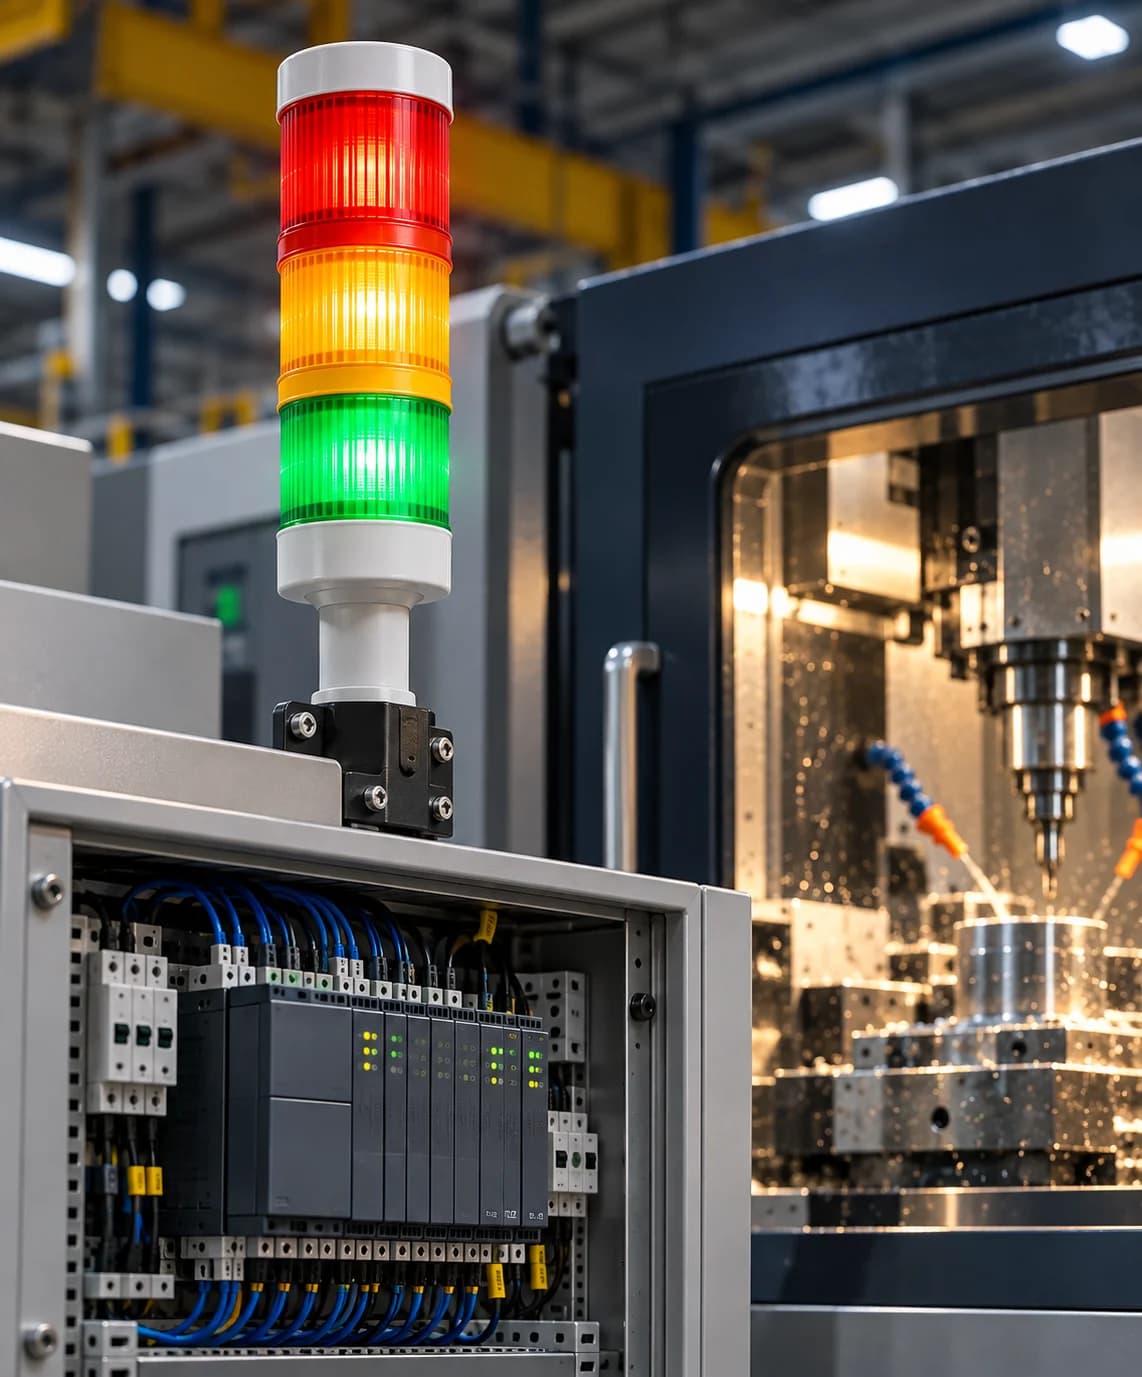
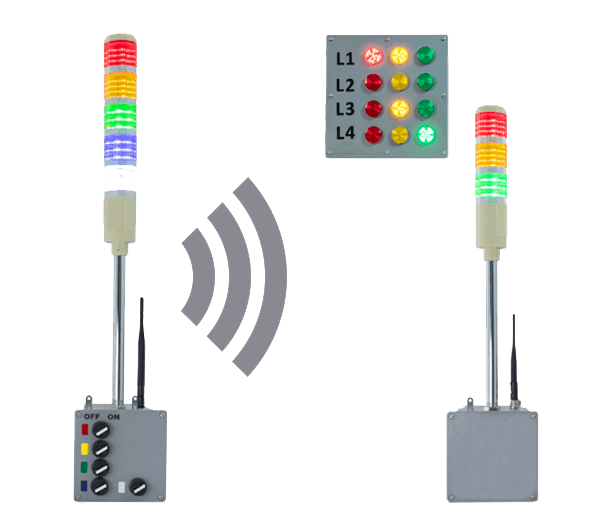
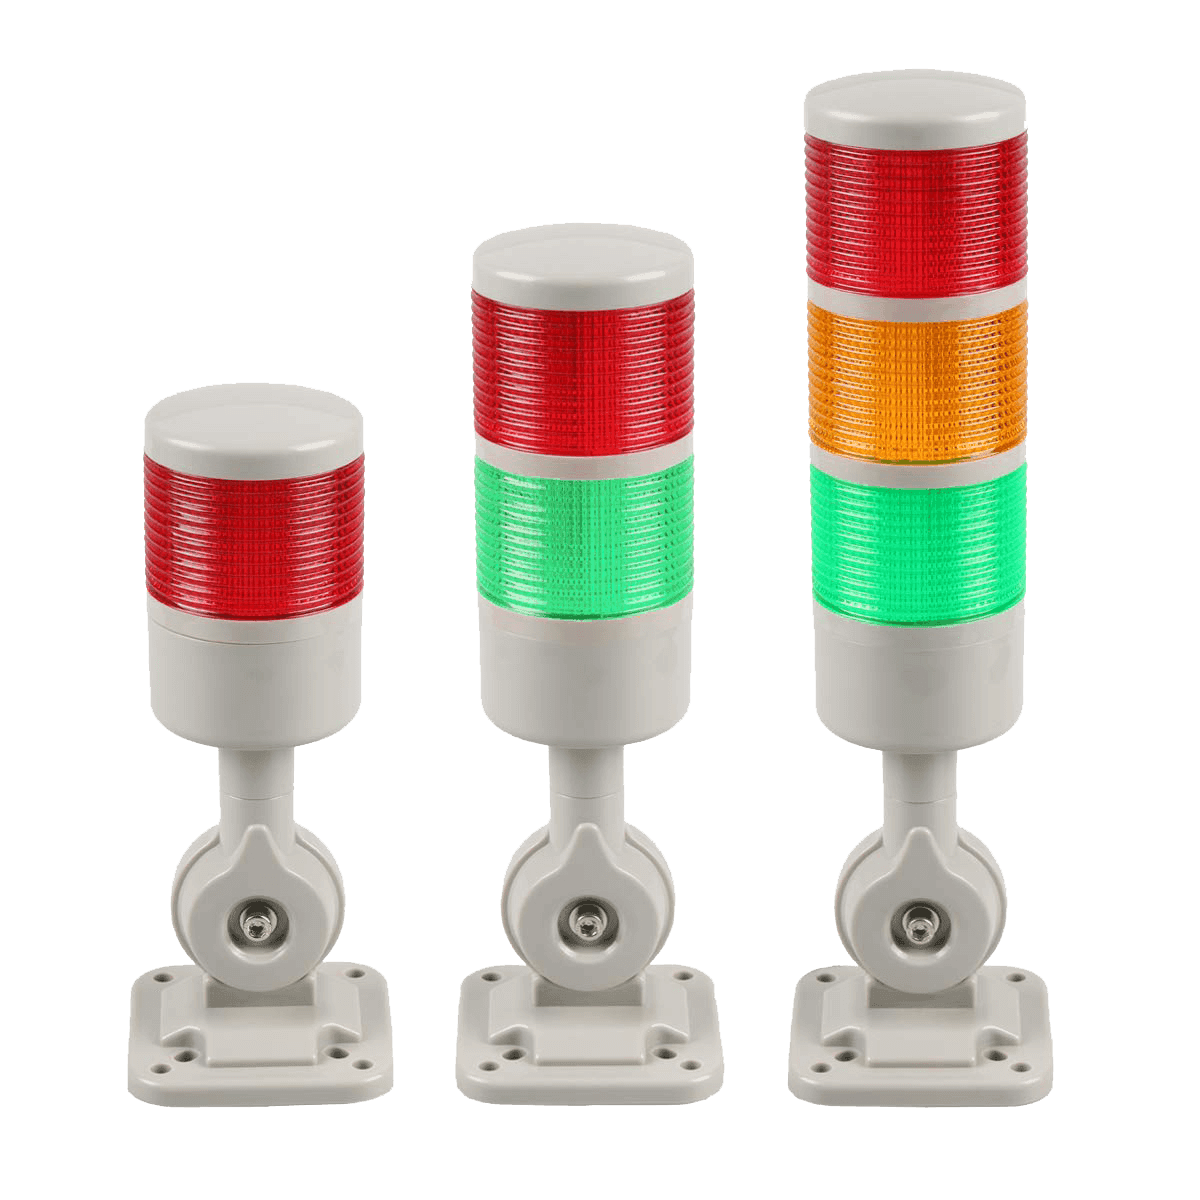
- Digital Andon
- Manufacturing dashboards
By connecting production, machine, downtime, and workforce information, manufacturers can build a more comprehensive view of factory performance.
This can help production teams identify efficiency losses, monitor important manufacturing KPIs, and make more informed operational decisions.
Best Practices for Using Production Efficiency Metrics
Define Every KPI Clearly
Everyone should understand how each metric is calculated.
Use Reliable Data
Automated machine and production data can reduce manual reporting errors.
Monitor Metrics in Real Time
Real-time visibility allows production teams to respond faster.
Analyze Trends
A single KPI value does not always reveal the full story. Monitor trends over time.
Combine Related Metrics
For example, analyze production output together with downtime, OEE, and quality.
Assign Ownership
Each important KPI should have a responsible team or department.
Turn Data Into Action
The purpose of production metrics is not simply reporting. They should support improvement decisions.
Conclusion
Production efficiency metrics provide manufacturers with a structured way to measure and improve production performance.
Important metrics include:
- OEE
- Production output
- Target achievement
- Machine availability
- Machine utilization
- Downtime
- Cycle time
- Production rate
- First-pass yield
- Scrap rate
- Rework rate
- Operator utilization
- Production per operator
- Manufacturing lead time
No single KPI can explain every production problem.
The most effective approach is to combine multiple metrics and analyze them together with the operational context.
With real-time production monitoring, IIoT connectivity, manufacturing dashboards, and productivity software, manufacturers can move from delayed manual reporting toward continuous production performance management.
For modern factories, the objective is not simply to collect more production data. The objective is to use accurate data to identify losses, understand their causes, and continuously improve manufacturing efficiency.
FAQs
What are production efficiency metrics?
Production efficiency metrics are measurable KPIs used to evaluate how effectively a manufacturing operation uses machines, labor, time, materials, and processes to produce output.
What is the most important production efficiency metric?
There is no single metric that is most appropriate for every manufacturing environment. OEE, production output, downtime, quality, utilization, and productivity metrics can each provide different insights.
What are the most common manufacturing efficiency metrics?
Common metrics include OEE, production output, target achievement, machine availability, machine utilization, downtime, cycle time, production rate, scrap rate, rework rate, operator utilization, and production per operator.
How do production efficiency metrics improve manufacturing?
They help identify production losses, bottlenecks, downtime, quality problems, utilization issues, and workforce productivity gaps so that teams can investigate and improve the underlying processes.
How is production efficiency measured?
Production efficiency can be measured using a combination of KPIs such as output, target achievement, OEE, machine utilization, downtime, quality, cycle time, and workforce productivity.
What is the difference between production efficiency and OEE?
OEE is a specific equipment effectiveness metric based on availability, performance, and quality. Production efficiency is a broader concept that can include equipment, workforce, quality, production, and process metrics.
Can production efficiency metrics be monitored in real time?
Yes. IIoT-connected manufacturing systems can collect machine and production data and display relevant KPIs through real-time dashboards.
How does downtime affect production efficiency?
Downtime reduces available production time and can lower production output, machine utilization, workforce productivity, and overall equipment effectiveness.
Can operator productivity be included in production efficiency metrics?
Yes. Production per operator, operator utilization, productive time, and target achievement can provide useful workforce-related production efficiency information.
Why are production efficiency trends important?
Trends help manufacturers identify recurring performance changes and determine whether improvement initiatives are producing sustainable results.