Production Per Operator: A Complete Guide to Measuring Manufacturing Productivity
Manufacturing companies continuously look for ways to increase production output while controlling operational costs. Machines, materials, production planning, maintenance, and workforce performance all contribute to manufacturing efficiency.
Among these factors, production per operator is an important metric for understanding how effectively available workforce capacity is being converted into production output.
Simply knowing the total number of products manufactured during a shift does not always provide enough information.
For example, two production lines may manufacture the same number of products, but one line may require significantly more operators. In that situation, the total production output is identical, but workforce productivity is different.
This is why manufacturers increasingly use production per operator as a workforce productivity metric.
When combined with operator utilization, production targets, machine performance, downtime, quality, and shift data, production per operator can provide valuable insight into shop floor efficiency.
What Is Production Per Operator?
Production per operator measures the amount of production output associated with each operator during a defined period.
The period can be:
- Per hour
- Per shift
- Per day
- Per production batch
- Per production line
- Per machine
- Per product
- Per week or month
A basic calculation is:
Production Per Operator = Total Production Output / Number of Operators
For example, if a production team manufactures 8,000 units during a shift using 20 operators:
8,000 / 20 = 400 units per operator
This provides a simple way to understand workforce productivity.
However, real manufacturing environments are more complex. Operators may work different shifts, machines may have different production rates, and downtime or changeovers may affect output.
Therefore, production per operator becomes more useful when it is connected to actual shop floor data.
Why Production Per Operator Matters in Manufacturing
Manufacturing productivity cannot be evaluated only by looking at total production.
A plant may increase production by adding more operators, but this does not necessarily mean that workforce efficiency has improved.
Production per operator helps provide additional context.
It can help manufacturing managers understand:
- How much output is generated by available workforce capacity
- Whether workforce allocation is efficient
- Which shifts have higher production output
- Which production lines require more operators
- Whether staffing levels match production requirements
- Where productivity gaps may exist
- How operator utilization affects production
- How downtime impacts workforce productivity
This makes production per operator useful for both daily production management and longer-term workforce planning.
Production Per Operator vs Total Production
Total production measures how many units were manufactured.
Production per operator considers the workforce required to achieve that output.
Consider two production lines.
Production Line A
- Production: 10,000 units
- Operators: 20
- Production per operator: 500 units
Production Line B
- Production: 10,000 units
- Operators: 30
- Production per operator: 333 units
Both lines have the same total production output.
However, the workforce requirement is different.
This does not automatically mean that Line A is better because many factors can affect staffing requirements, including:
- Product complexity
- Automation level
- Machine type
- Quality requirements
- Production process
- Material handling
- Manual operations
- Safety requirements
The metric should therefore be used as an operational indicator rather than as a standalone measure of employee performance.
How to Calculate Production Per Operator
The basic formula is straightforward.
Production Per Operator = Total Production / Number of Operators
For example:
A factory produces 12,000 components during a shift.
The production team consists of 24 operators.
Production per operator:
12,000 / 24 = 500 units per operator
The same calculation can be performed across different periods.
Production Per Operator Per Hour
If a team produces 4,800 units during 8 production hours with 12 operators:
Production per operator per hour:
4,800 / 12 / 8 = 50 units per operator per hour
This metric can help compare workforce productivity across different production durations.
Important Factors That Affect Production Per Operator
Production per operator is influenced by much more than operator effort.
Manufacturing managers should consider the surrounding production conditions.
Machine Performance
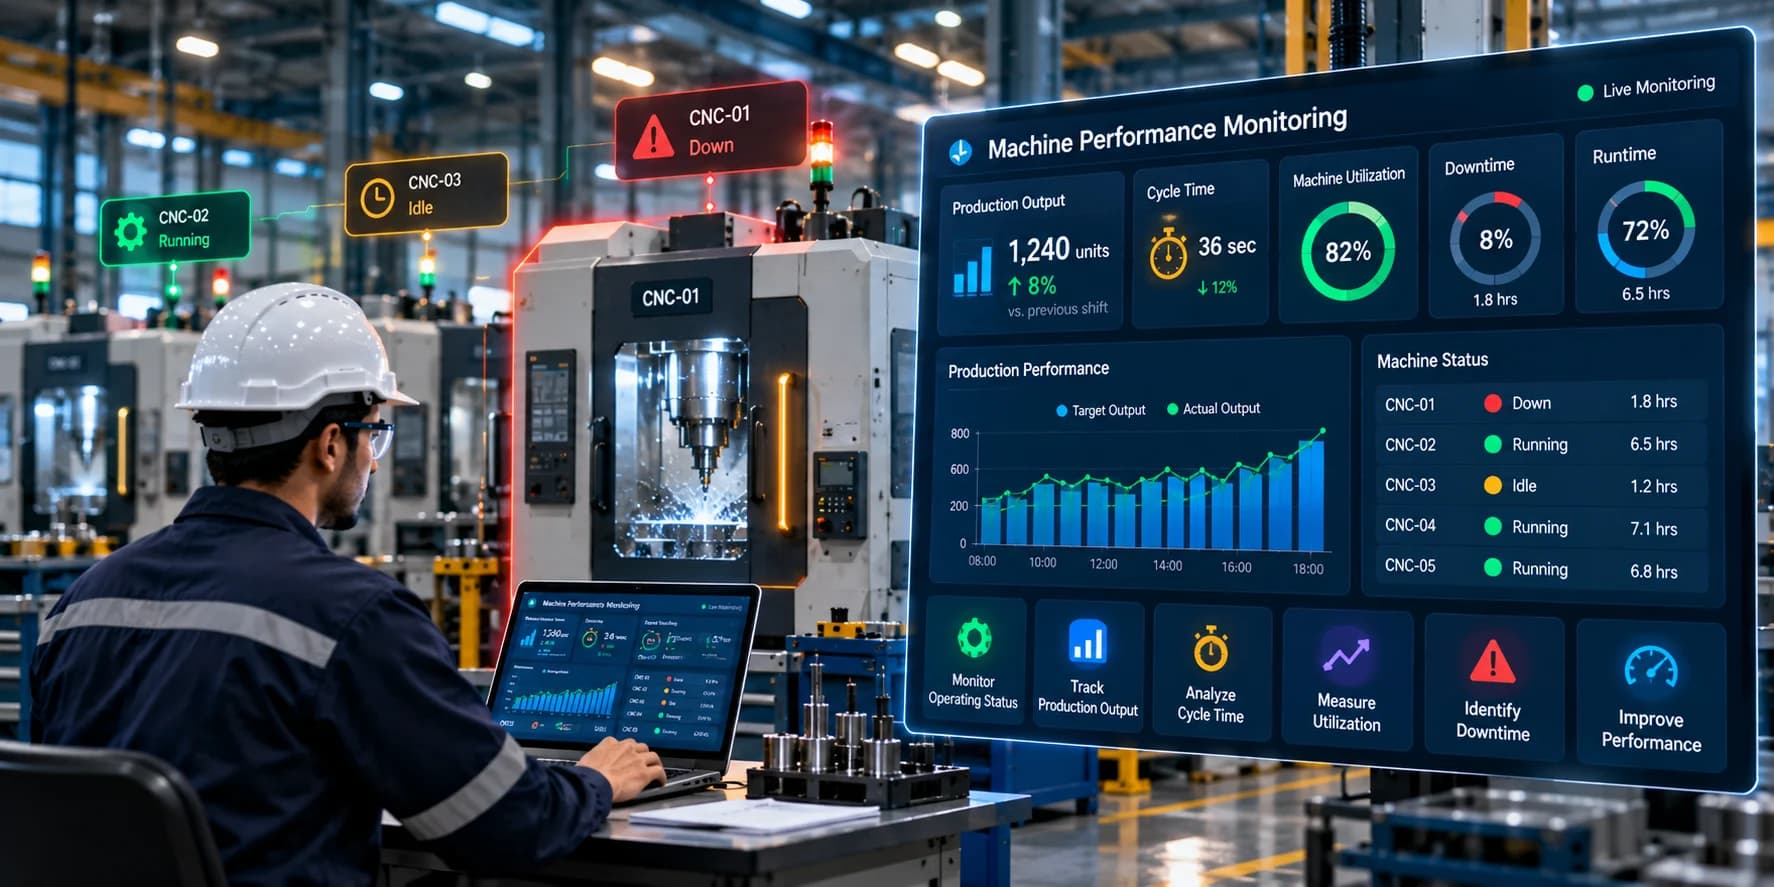
Machine speed, availability, and reliability can directly affect output.
If an operator is working with a machine that frequently stops, production per operator may decrease even when the operator remains available and ready to work.
Machine Downtime
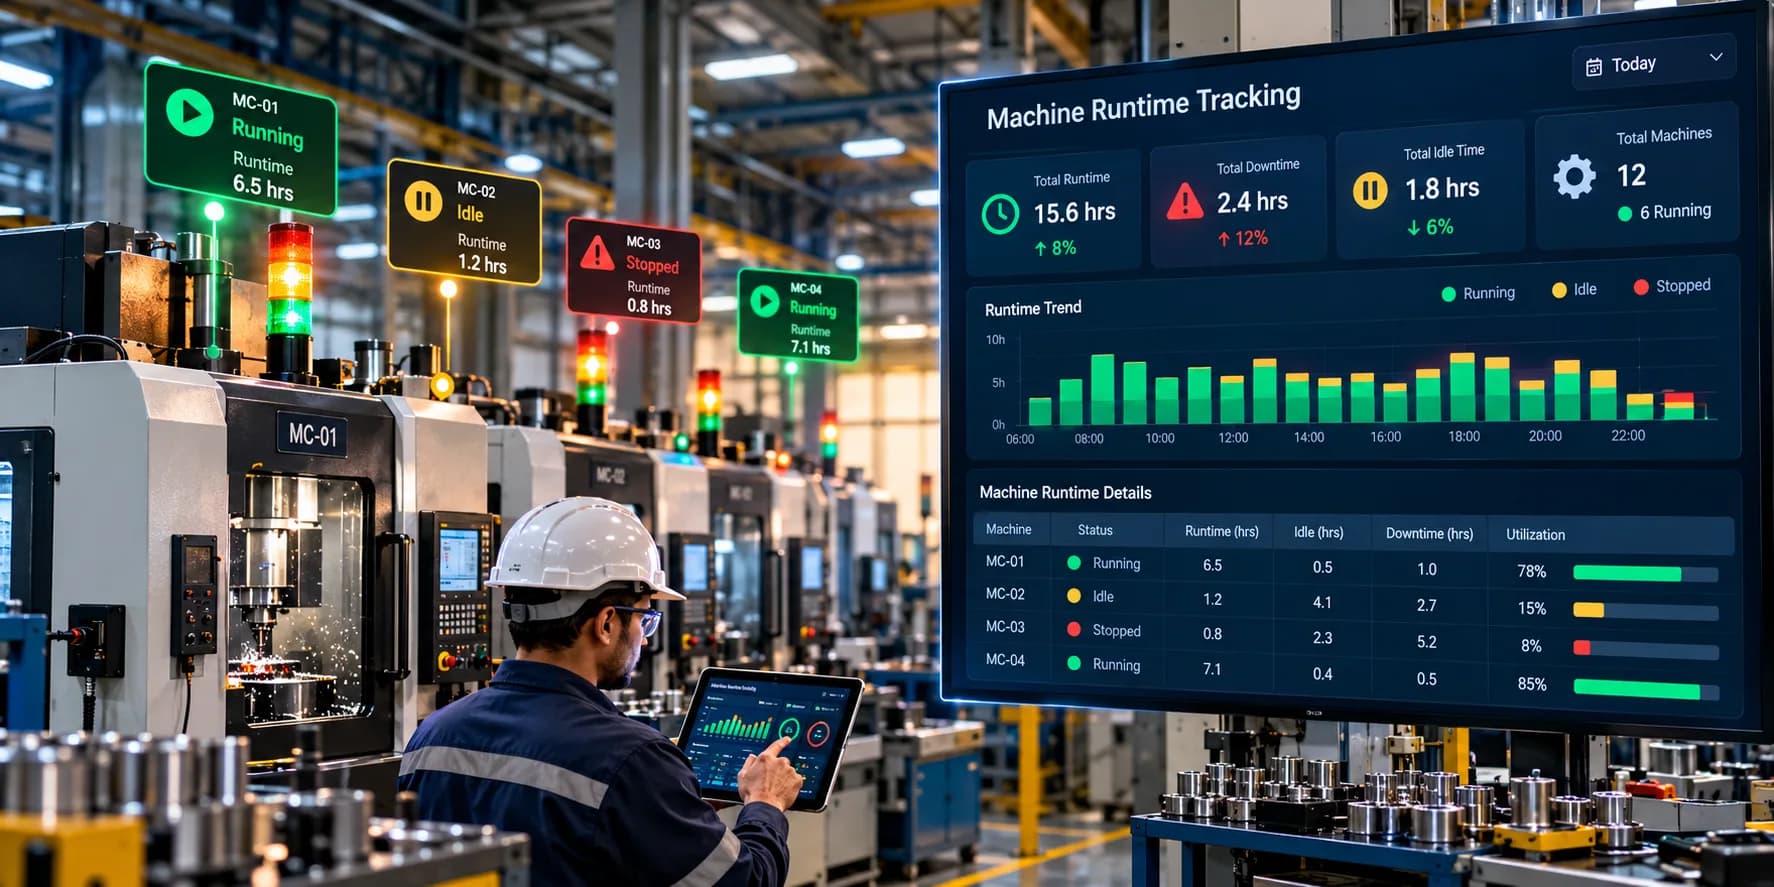
Unplanned machine downtime can reduce production output while operators remain assigned to the affected equipment.
This can create a lower production-per-operator value without necessarily indicating a workforce problem.
Material Availability
Material shortages can stop production.
Operators may be available but unable to produce because required materials or components have not reached the workstation.
Changeover Time
Frequent product changeovers can reduce available production time.
Long setup and changeover processes may therefore reduce production output during a shift.
Product Complexity
Different products require different amounts of operator involvement.
A simple product may require limited manual intervention, while a complex product may require several manual operations.
Production per operator should therefore be compared carefully across different products.
Quality Requirements
Additional inspection, rework, and quality-control processes can affect production output.
A higher production quantity does not automatically indicate better manufacturing performance if quality levels are poor.
Production Per Operator and Operator Productivity
Production per operator is one way to measure operator productivity.
Operator productivity generally considers the relationship between workforce input and production output.
Other useful operator productivity metrics can include:
- Units per operator
- Units per operator hour
- Target achievement
- Productive time
- Operator utilization
- Idle time
- Production cycle time
- Rework associated with production
- Output per shift
Using several metrics together provides a more complete understanding of workforce performance.
Production Per Operator by Shift
Shift-level analysis can help manufacturing managers identify production patterns.
A dashboard can compare production per operator across:
- First shift
- Second shift
- Third shift
- Weekend shifts
- Different production teams
For example, management may identify that one shift consistently produces fewer units per operator.
This should not immediately be interpreted as an operator issue.
Managers can investigate:
- Machine downtime
- Material availability
- Staffing levels
- Product mix
- Changeovers
- Maintenance activities
- Production scheduling
- Quality issues
This approach helps identify the actual operational cause behind productivity differences.
Production Per Operator by Production Line
Production per operator can also be monitored across different production lines.
For example:
| Production Line | Operators | Output | Production Per Operator |
|---|---|---|---|
| Line A | 10 | 5,000 | 500 |
| Line B | 12 | 5,400 | 450 |
| Line C | 8 | 4,800 | 600 |
This type of analysis can help identify differences in workforce utilization and production capacity.
However, lines should be compared only when their processes, products, operating conditions, and staffing requirements are reasonably comparable.
Production Per Operator and Workforce Utilization
Production per operator and operator utilization monitoring provide complementary information.
Production per operator answers:
How much output is being generated per operator?
Operator utilization answers:
How much of the available operator time is being used for defined productive activities?
These metrics can reveal different situations.
For example, an operator may have high utilization but low production output because the machine operates slowly.
Another operator may have lower utilization because the machine experienced an extended breakdown.
By monitoring both metrics, manufacturing managers can investigate workforce productivity together with production constraints.
Tracking Production Per Operator in Real Time
Traditional production reports are often prepared after a shift ends.
By that point, production managers may have limited opportunity to correct the issue.
Real-time production monitoring changes this approach.
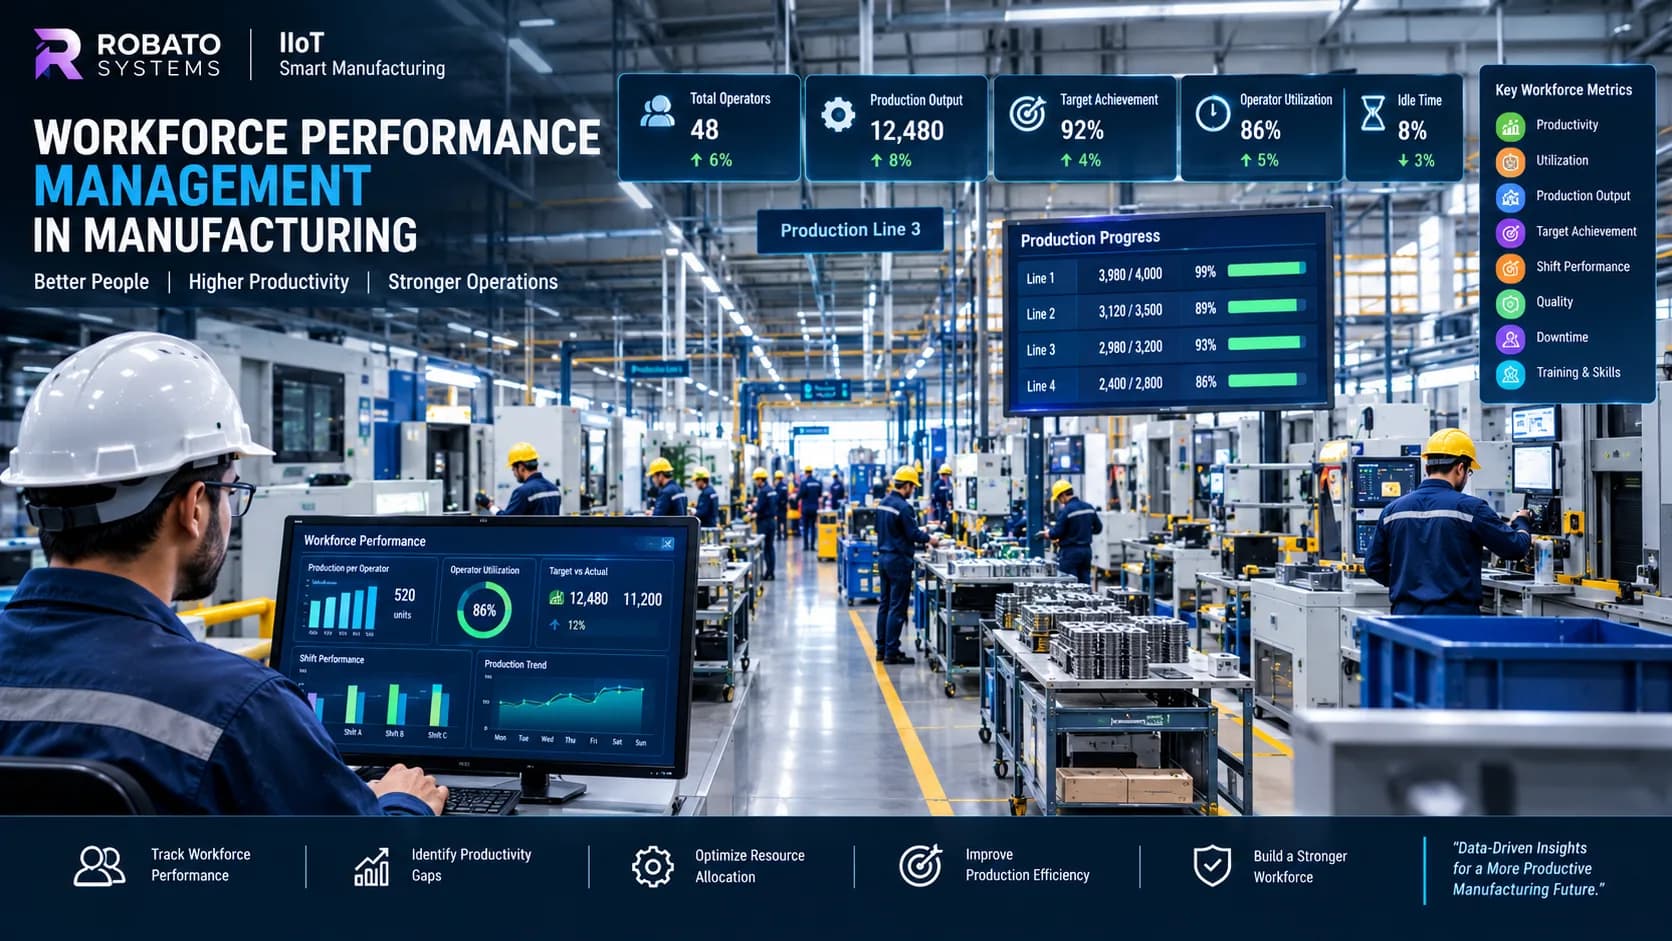
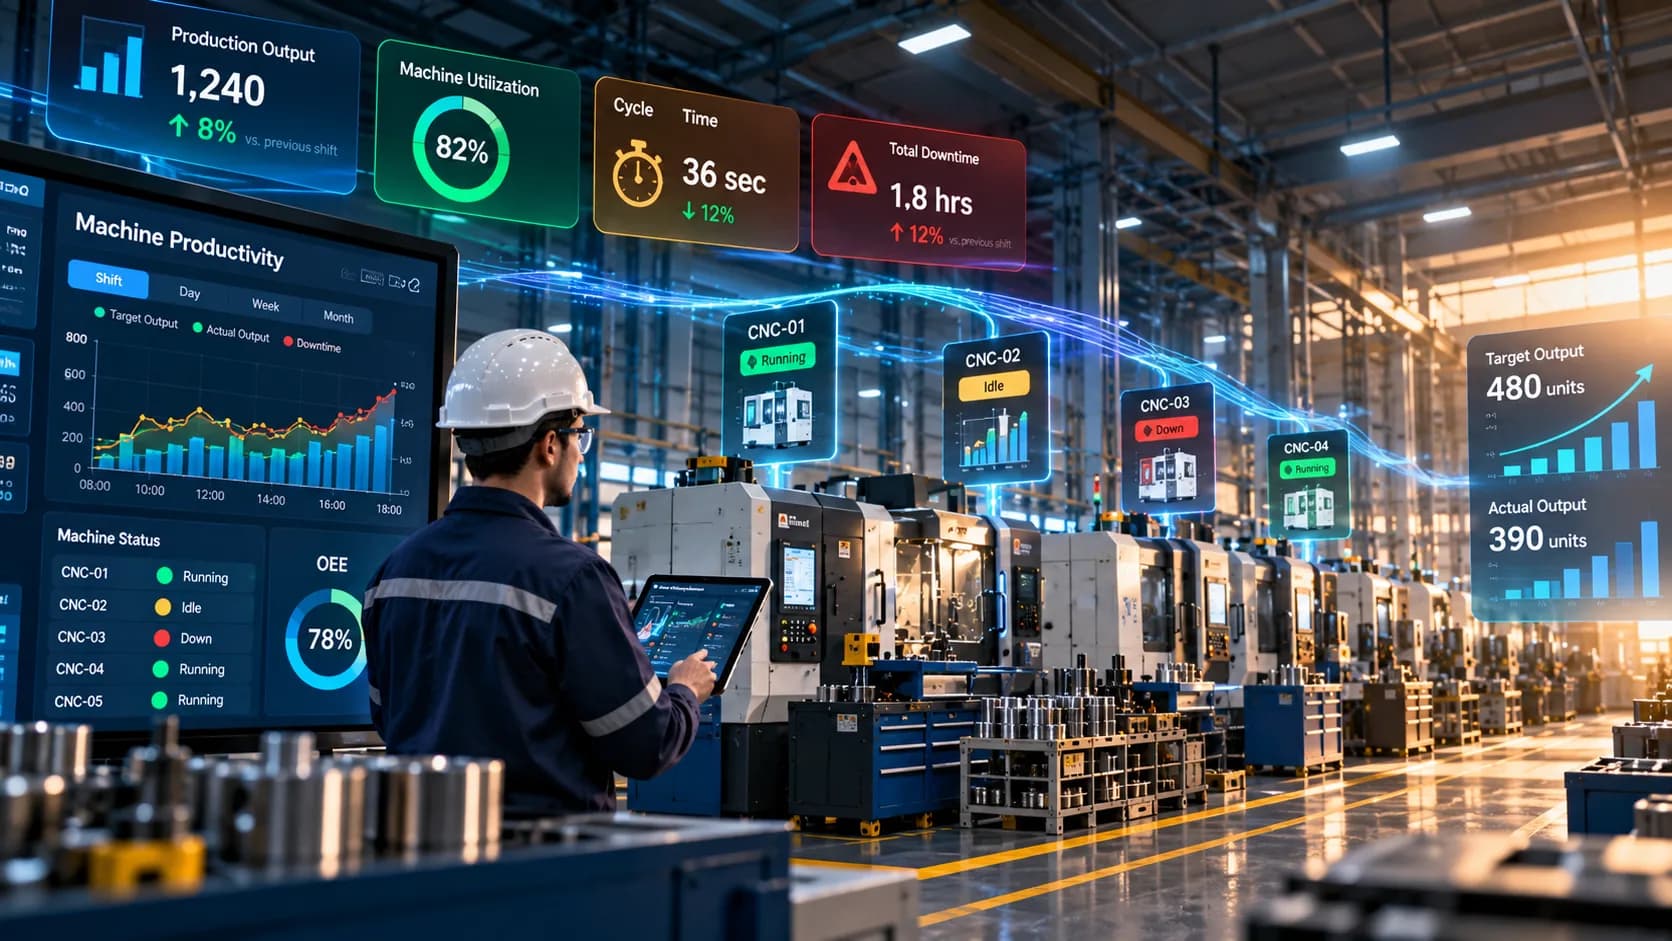
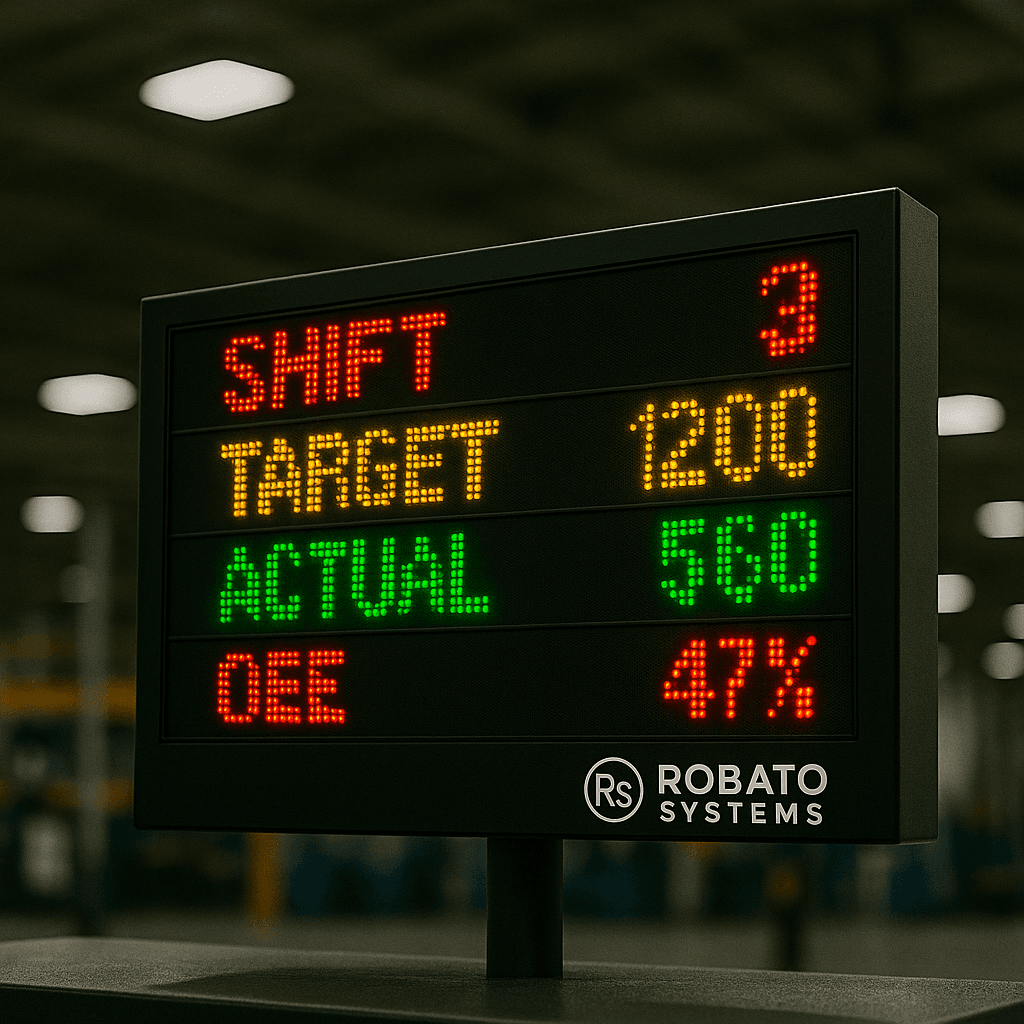
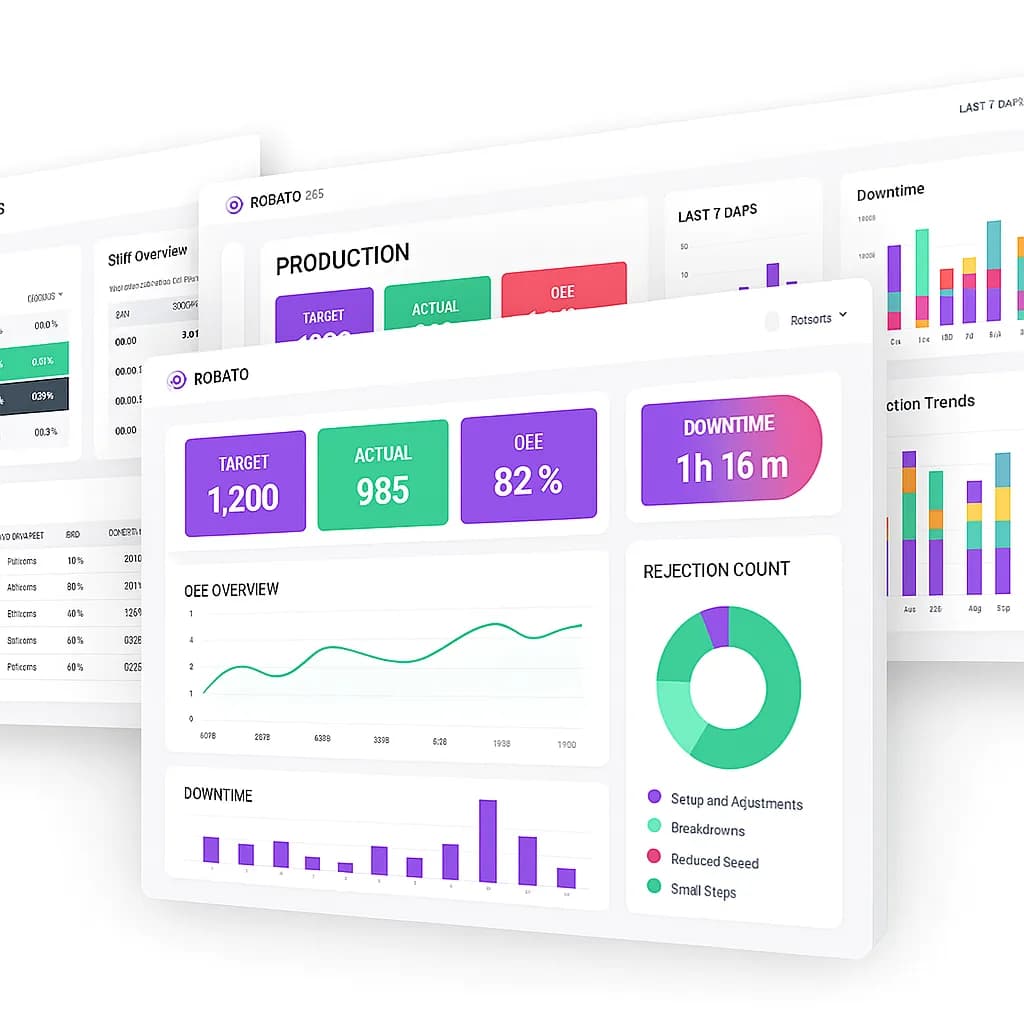
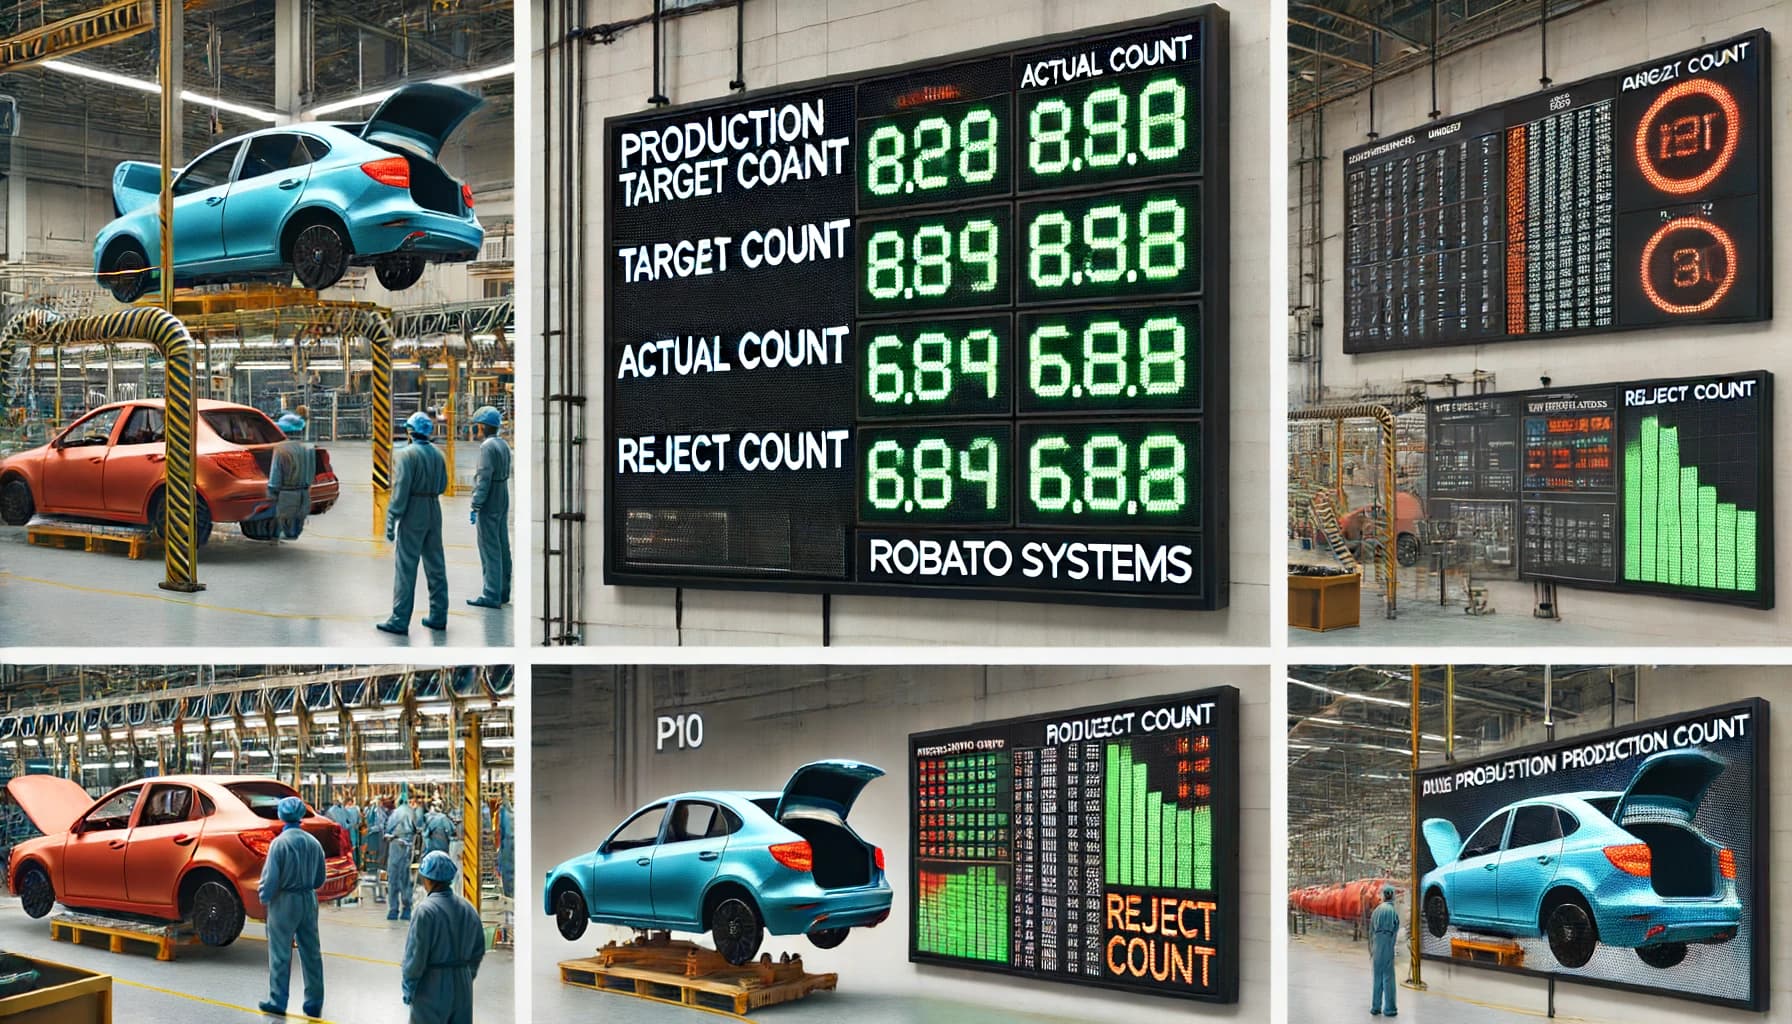
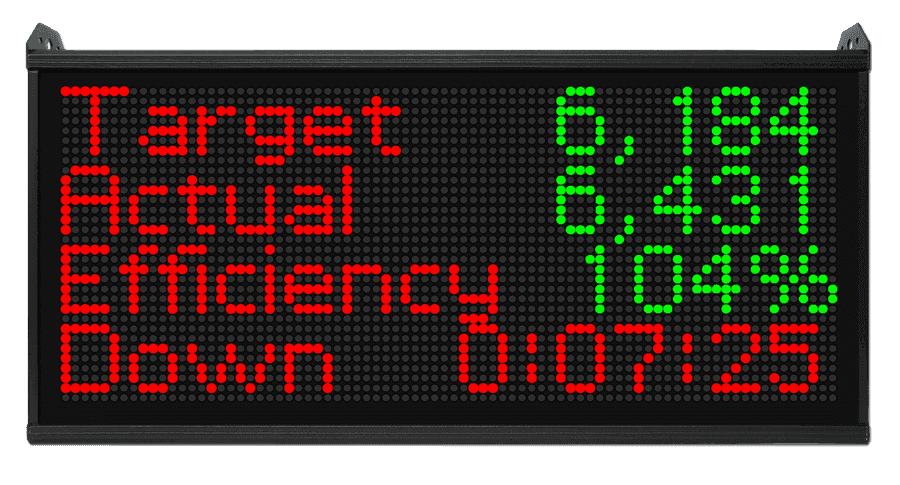
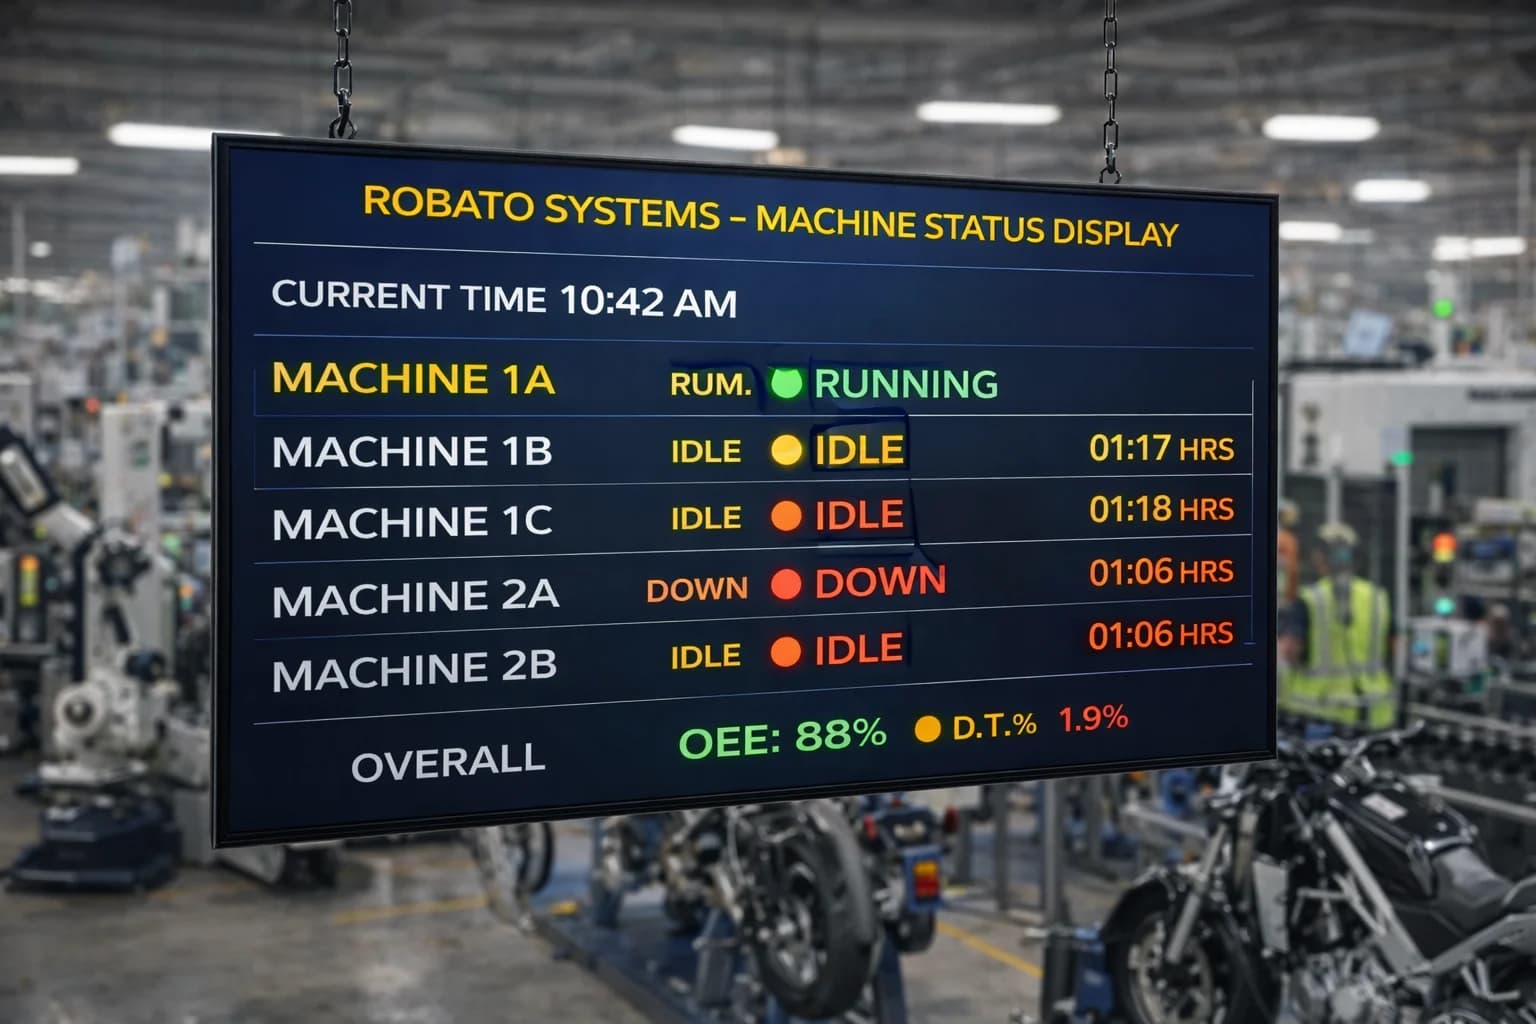
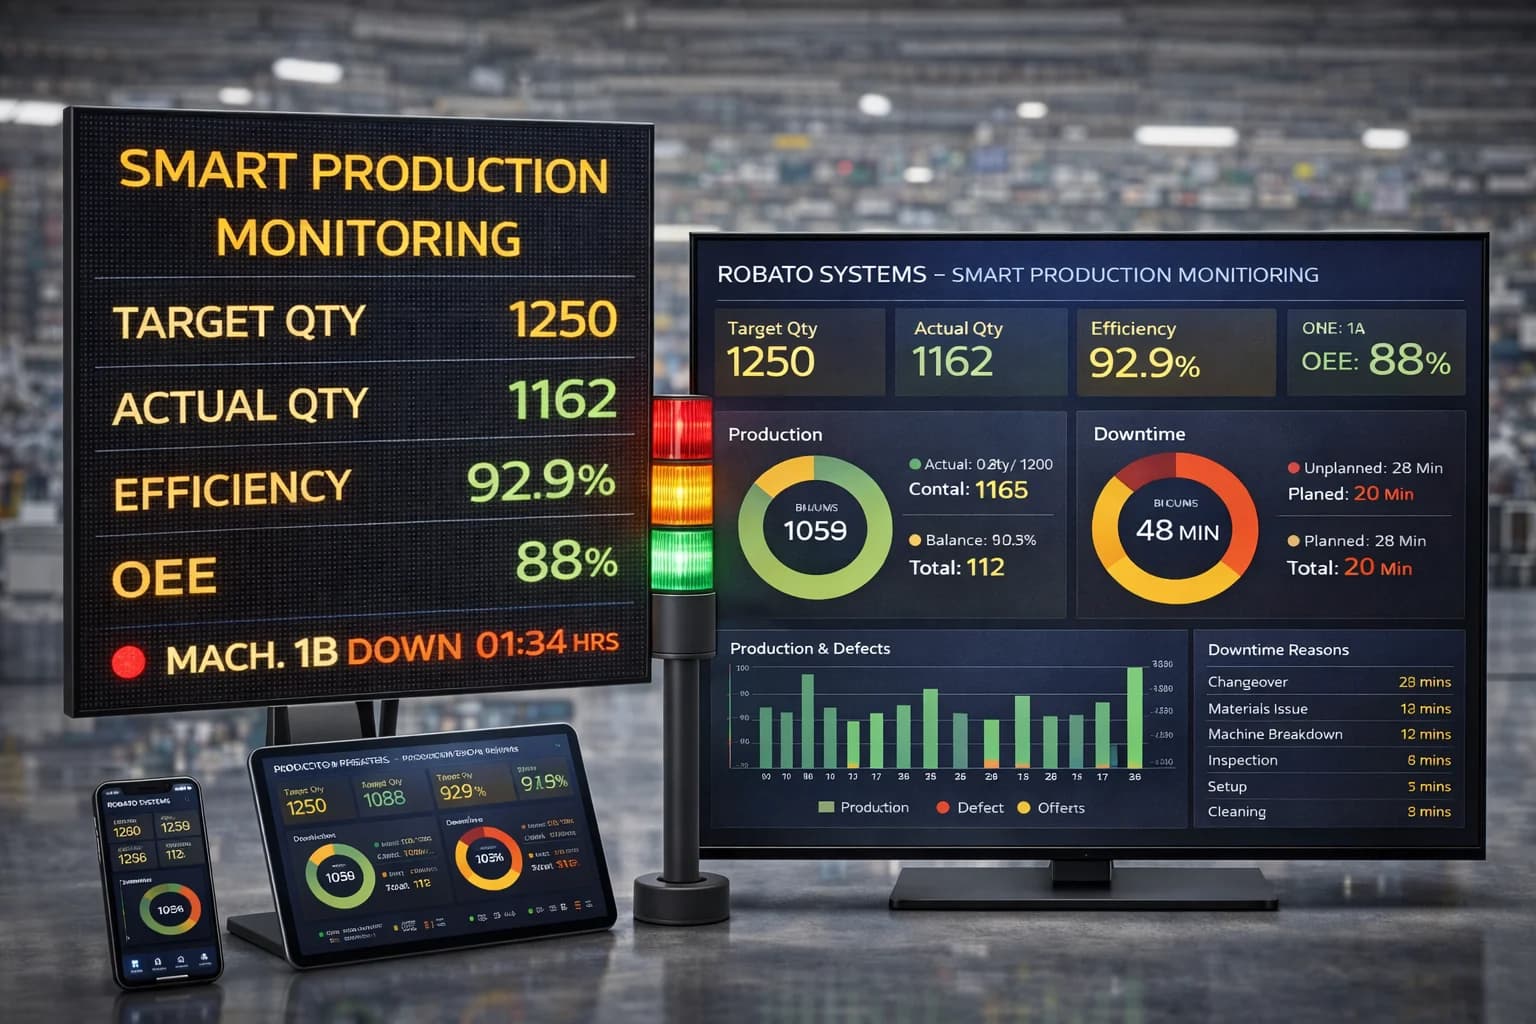
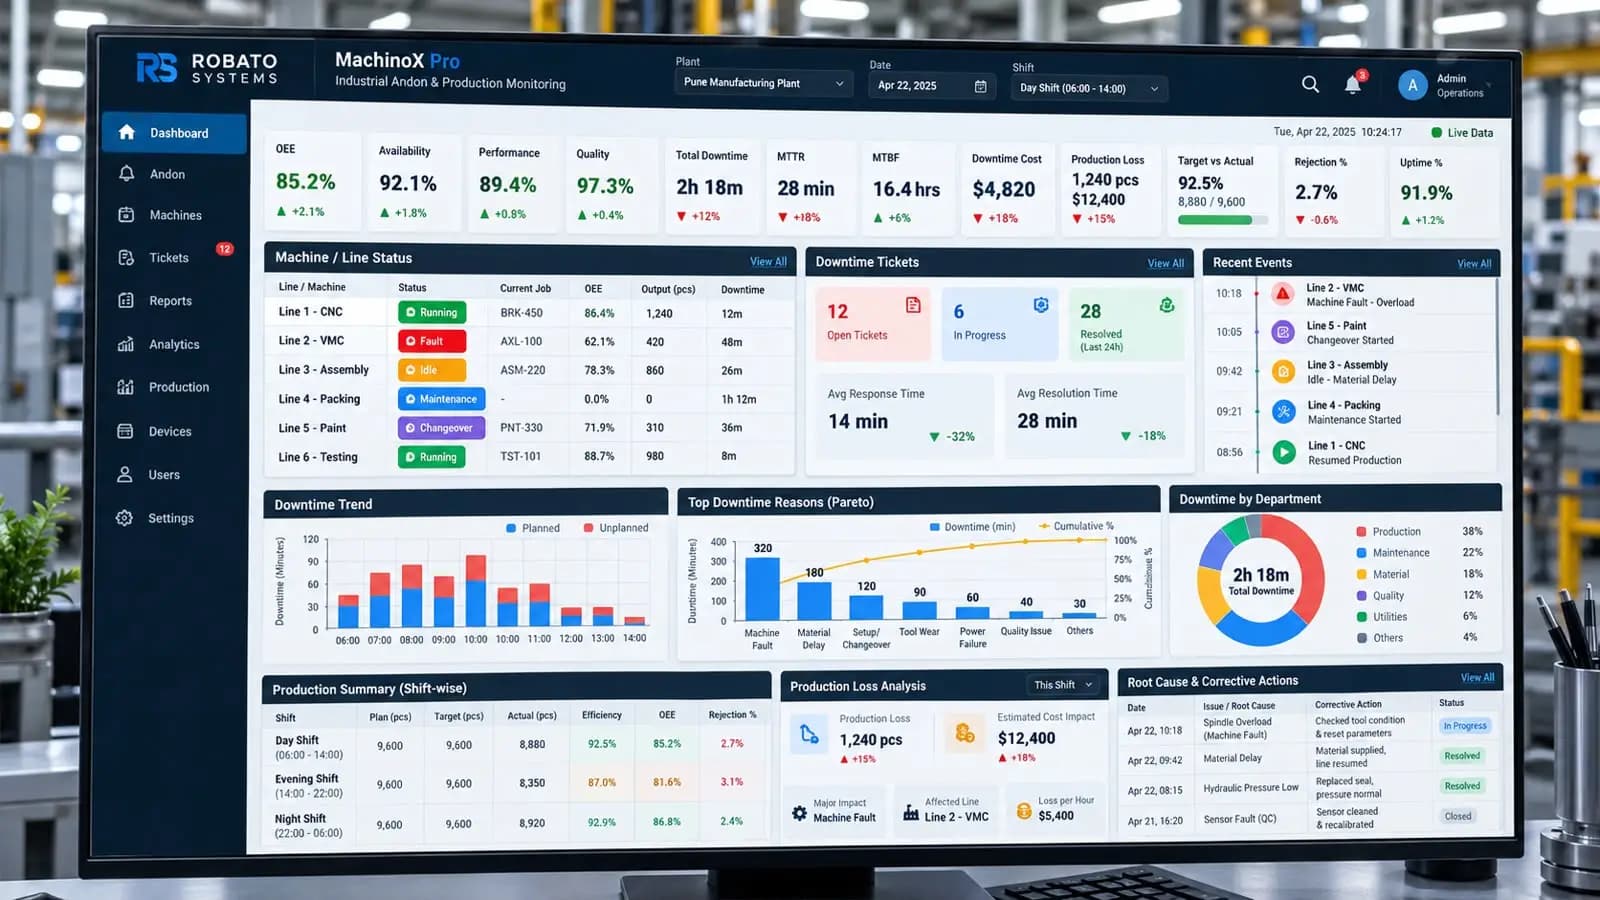
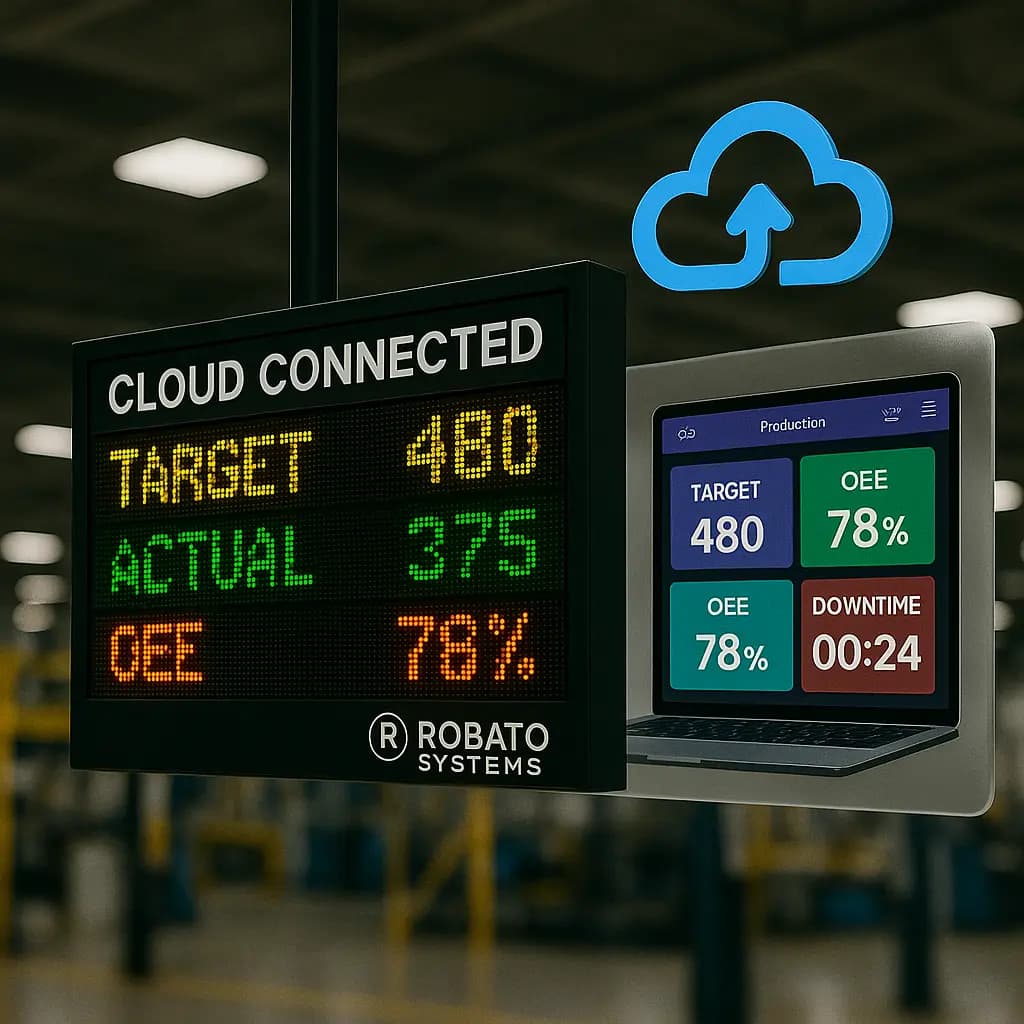
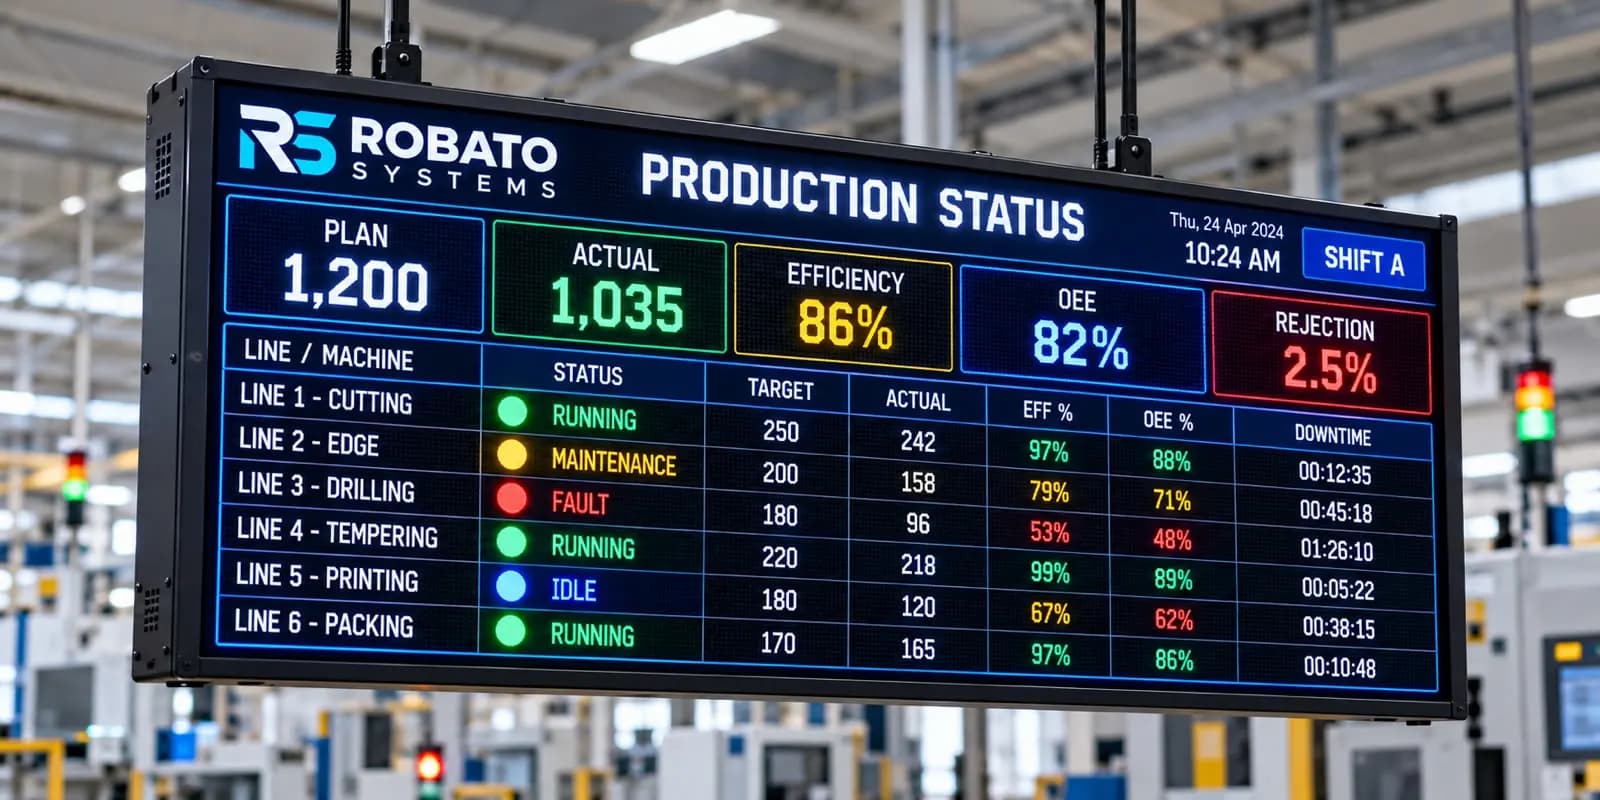
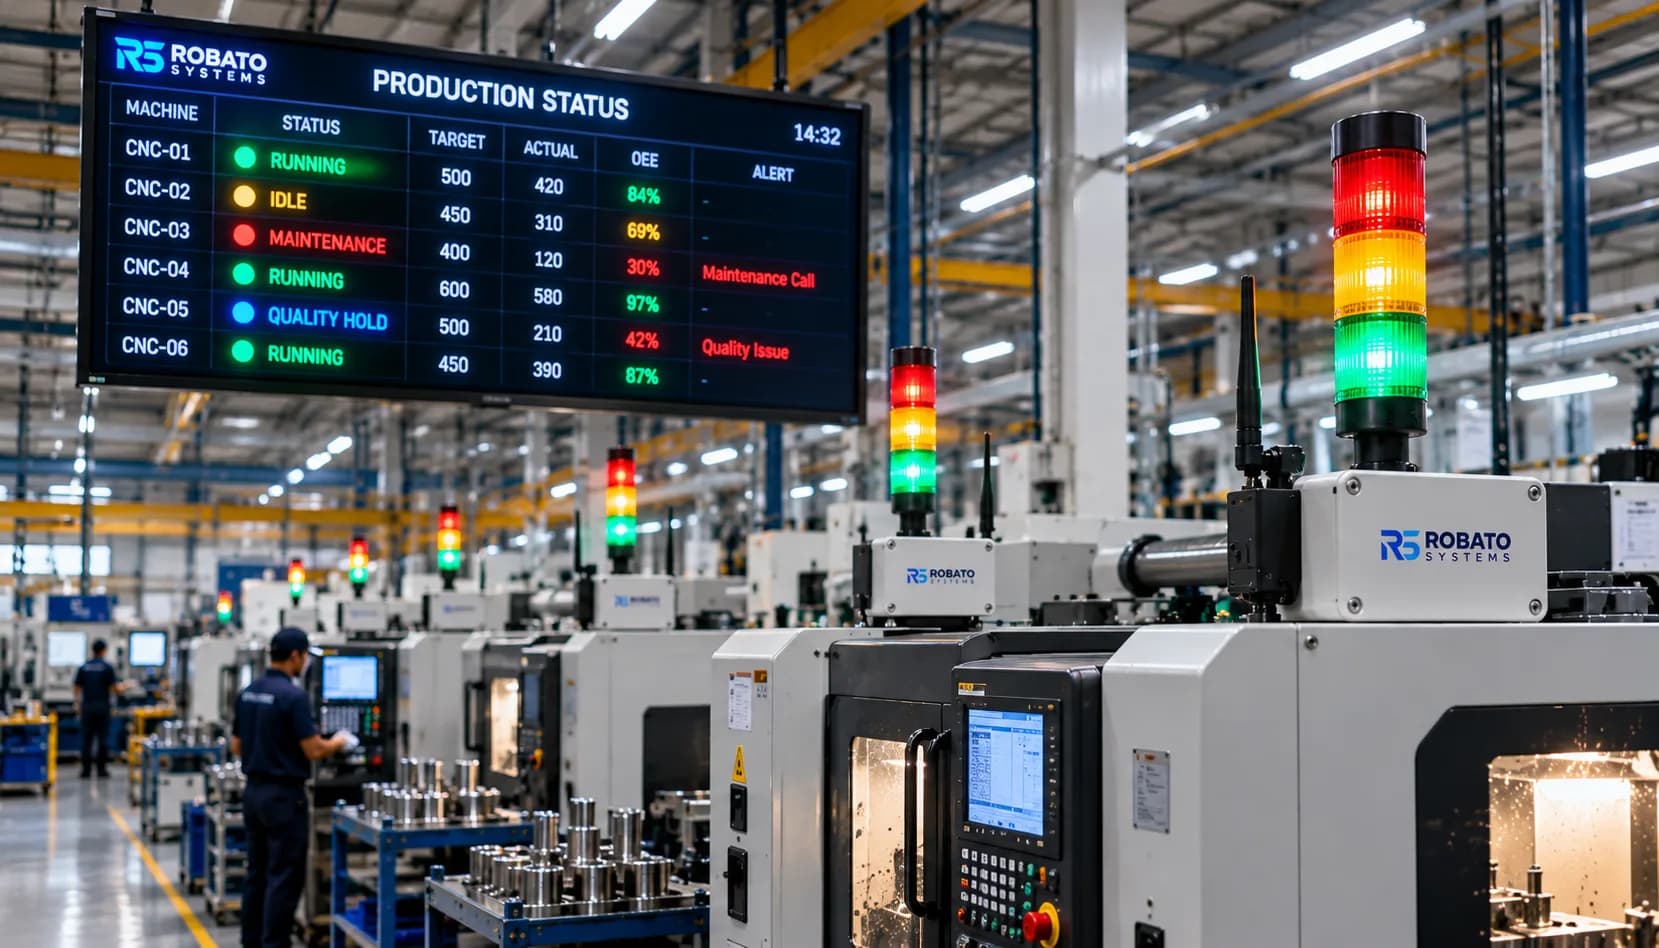
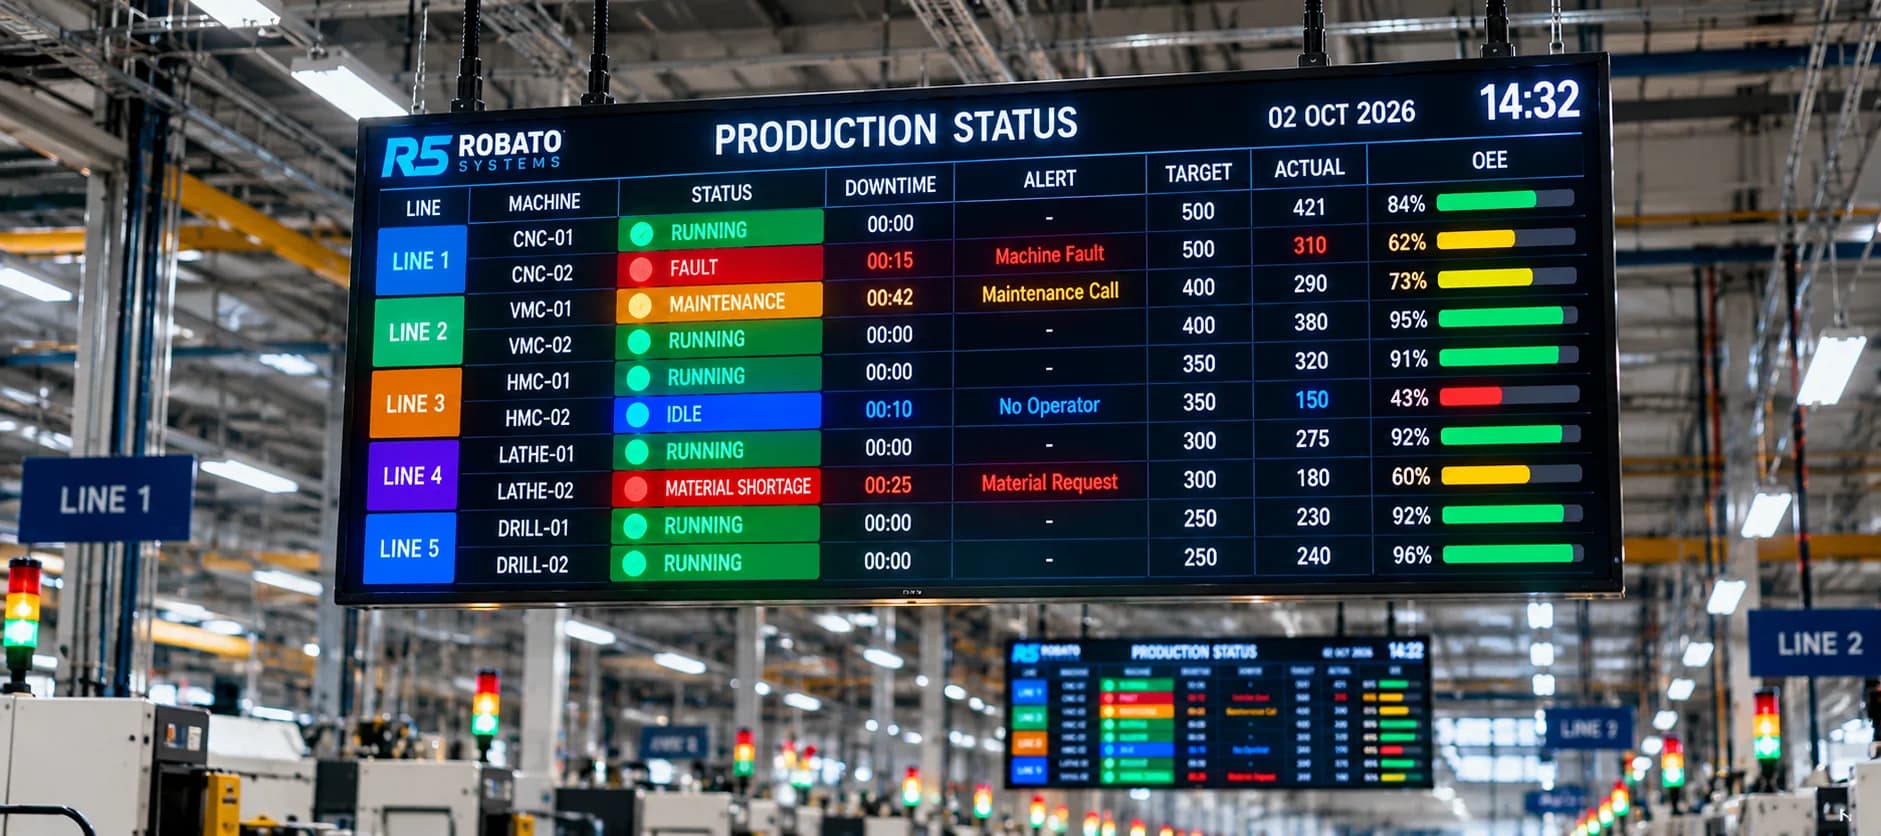
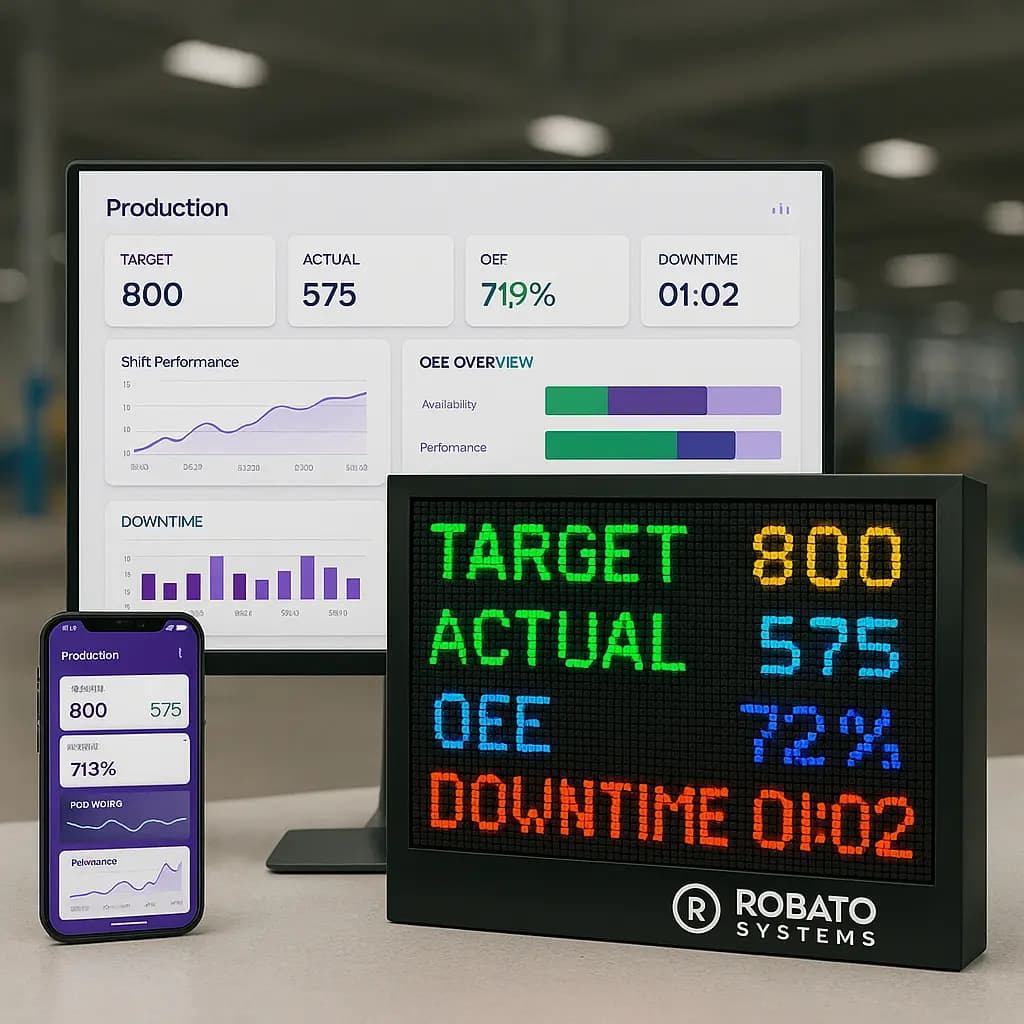
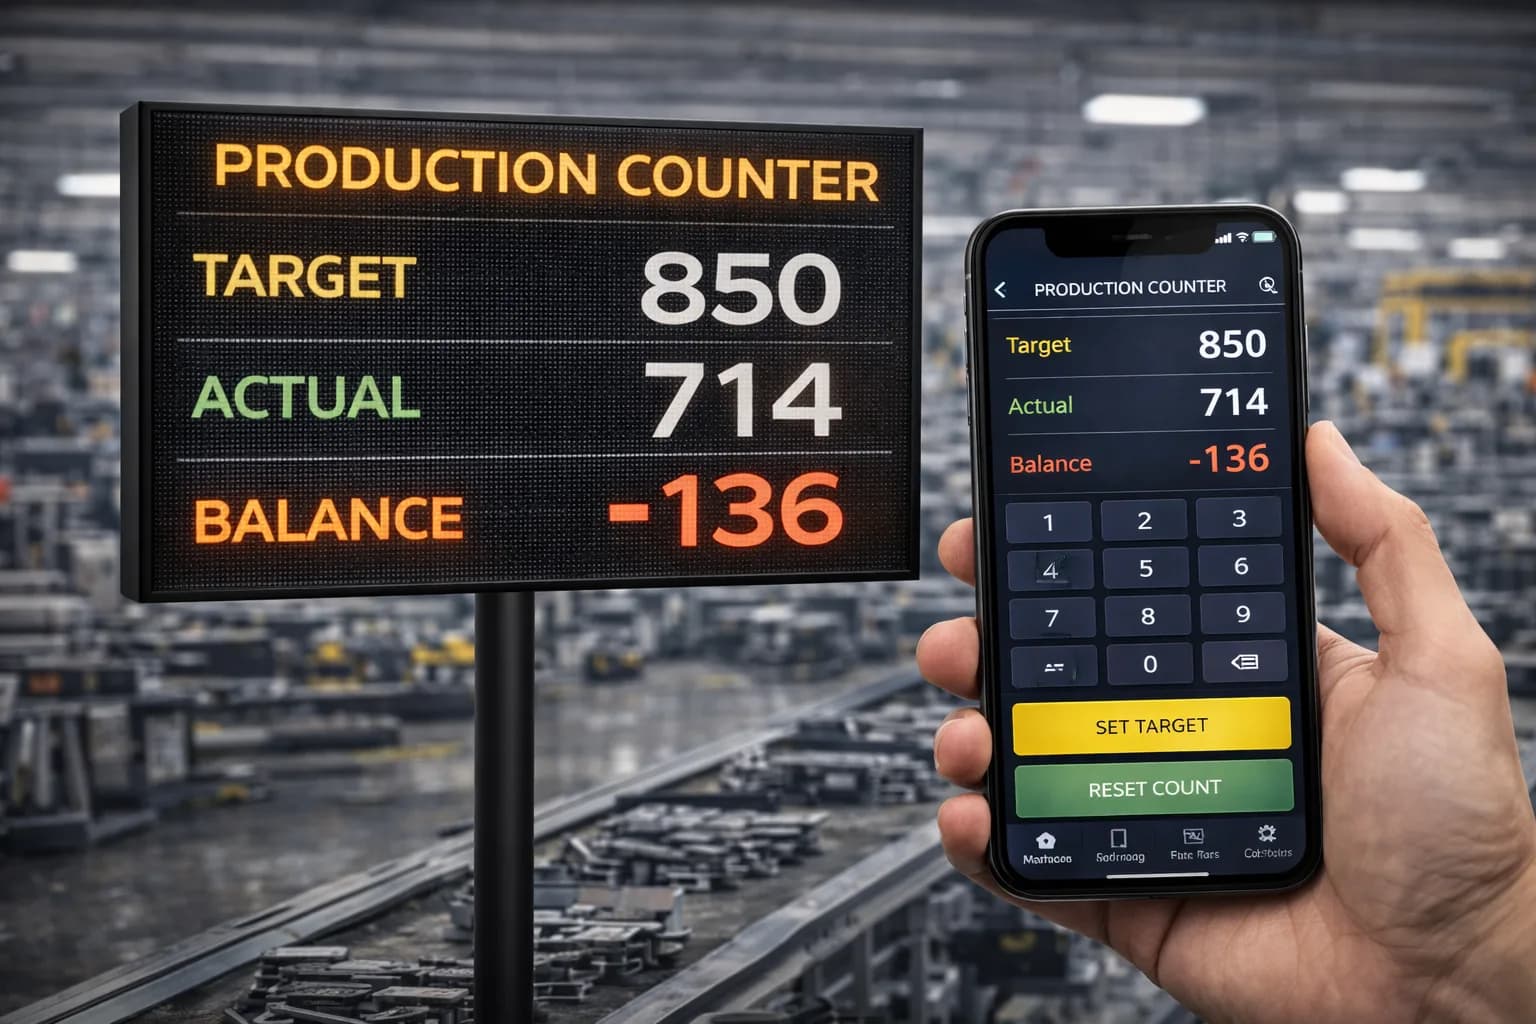
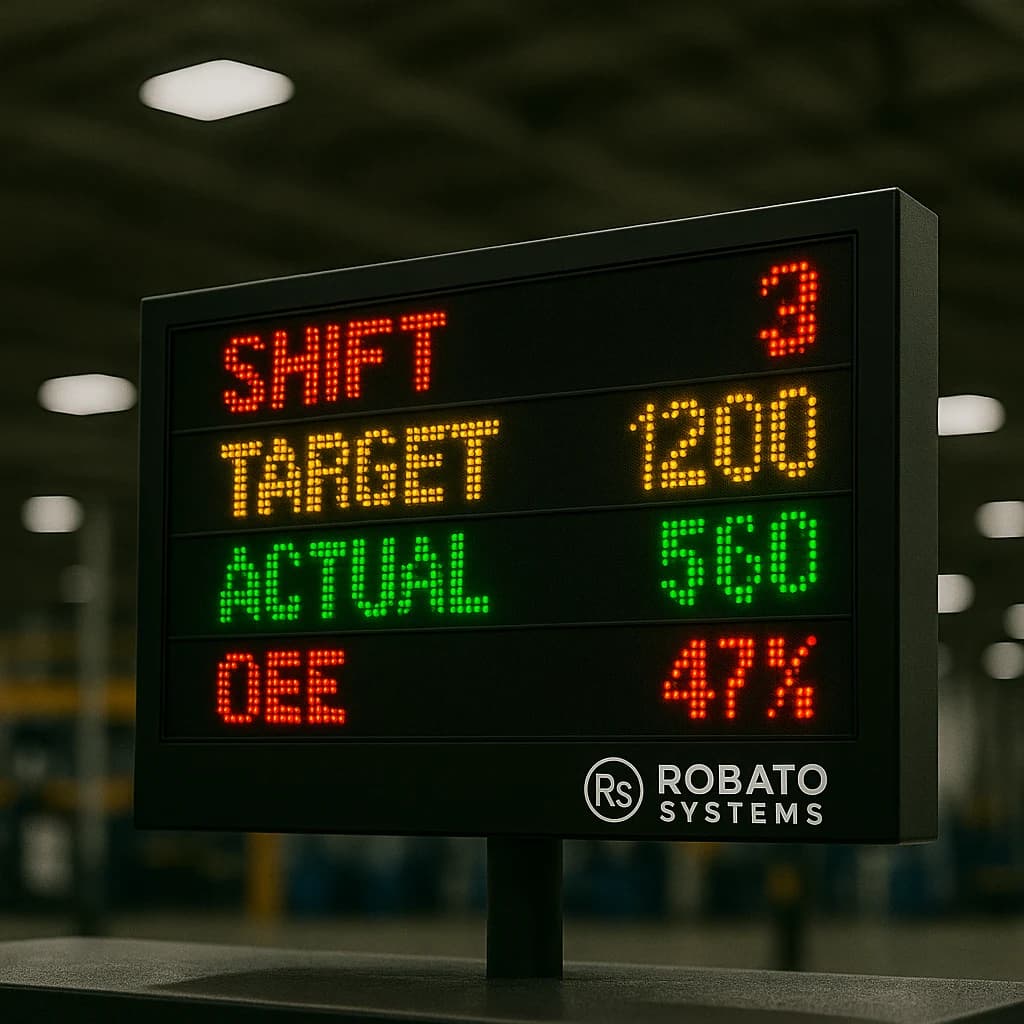
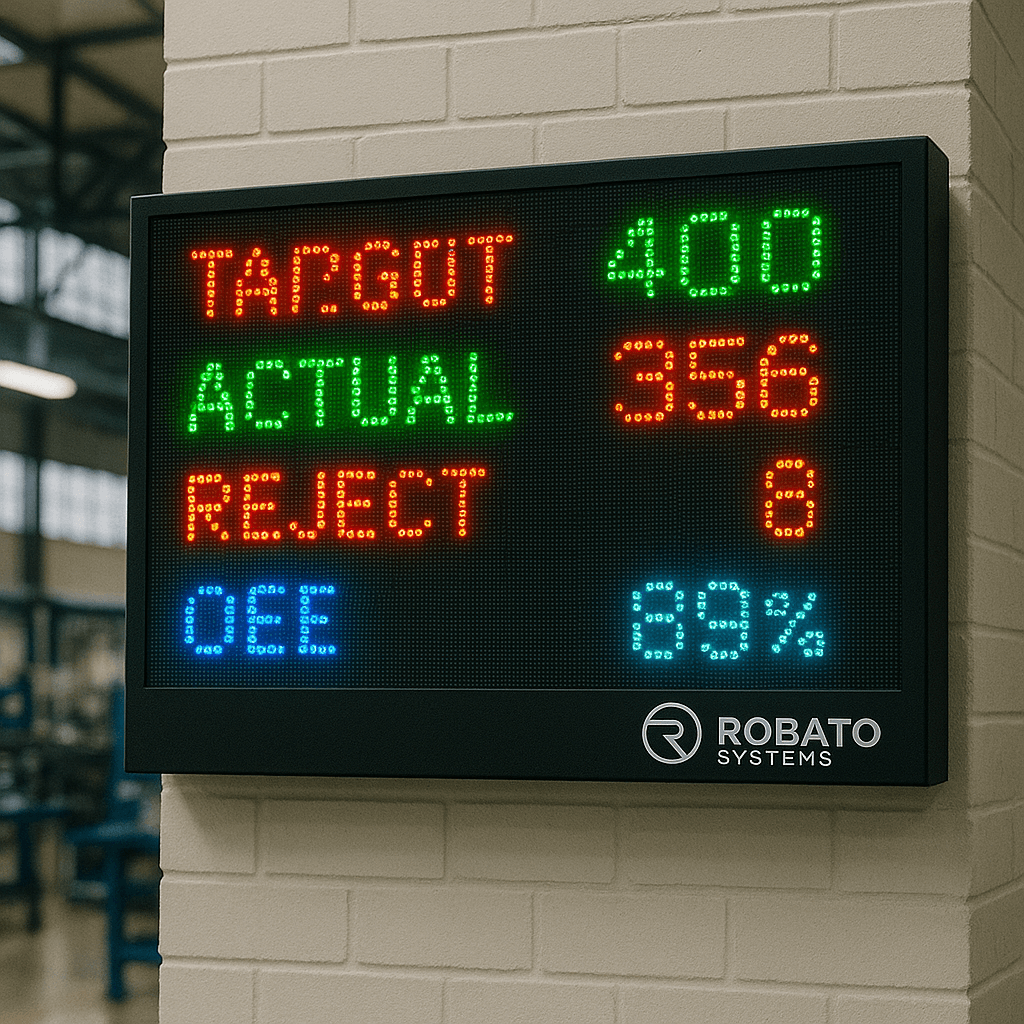
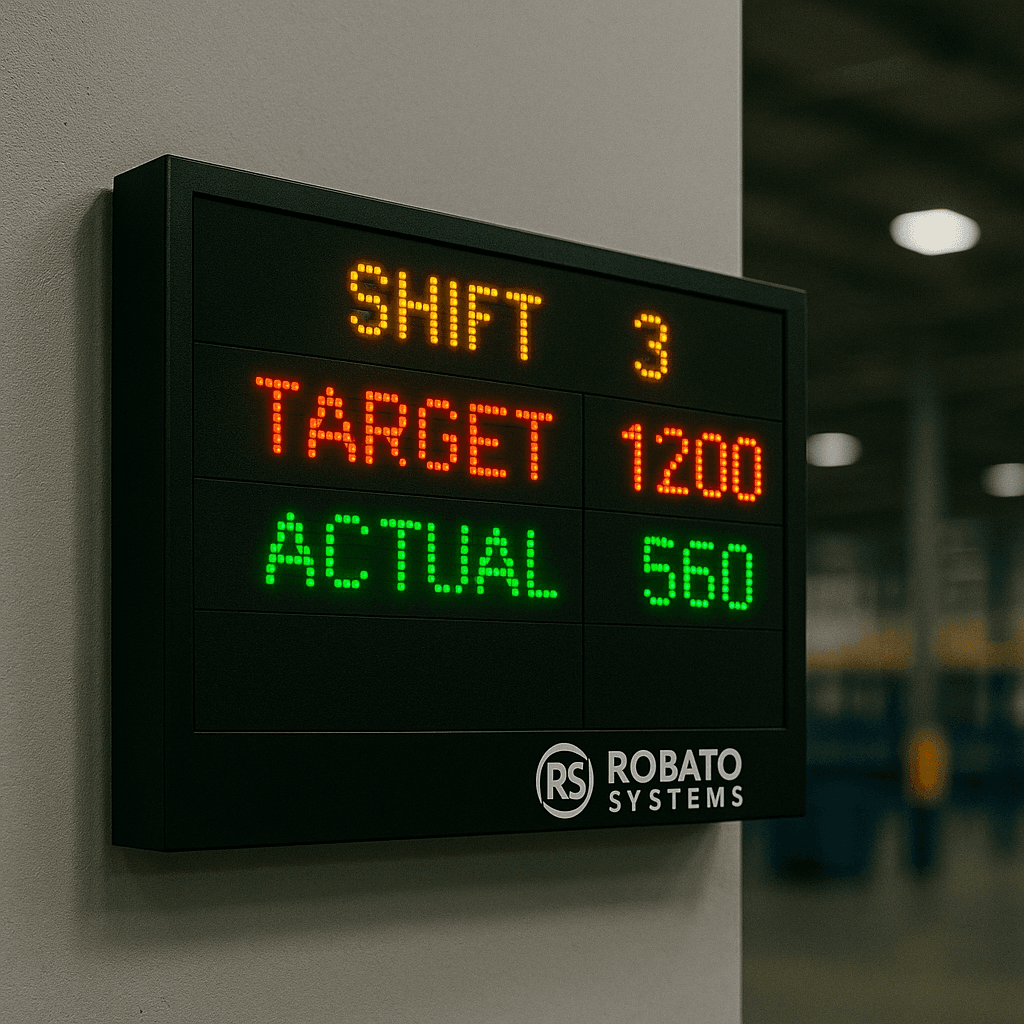
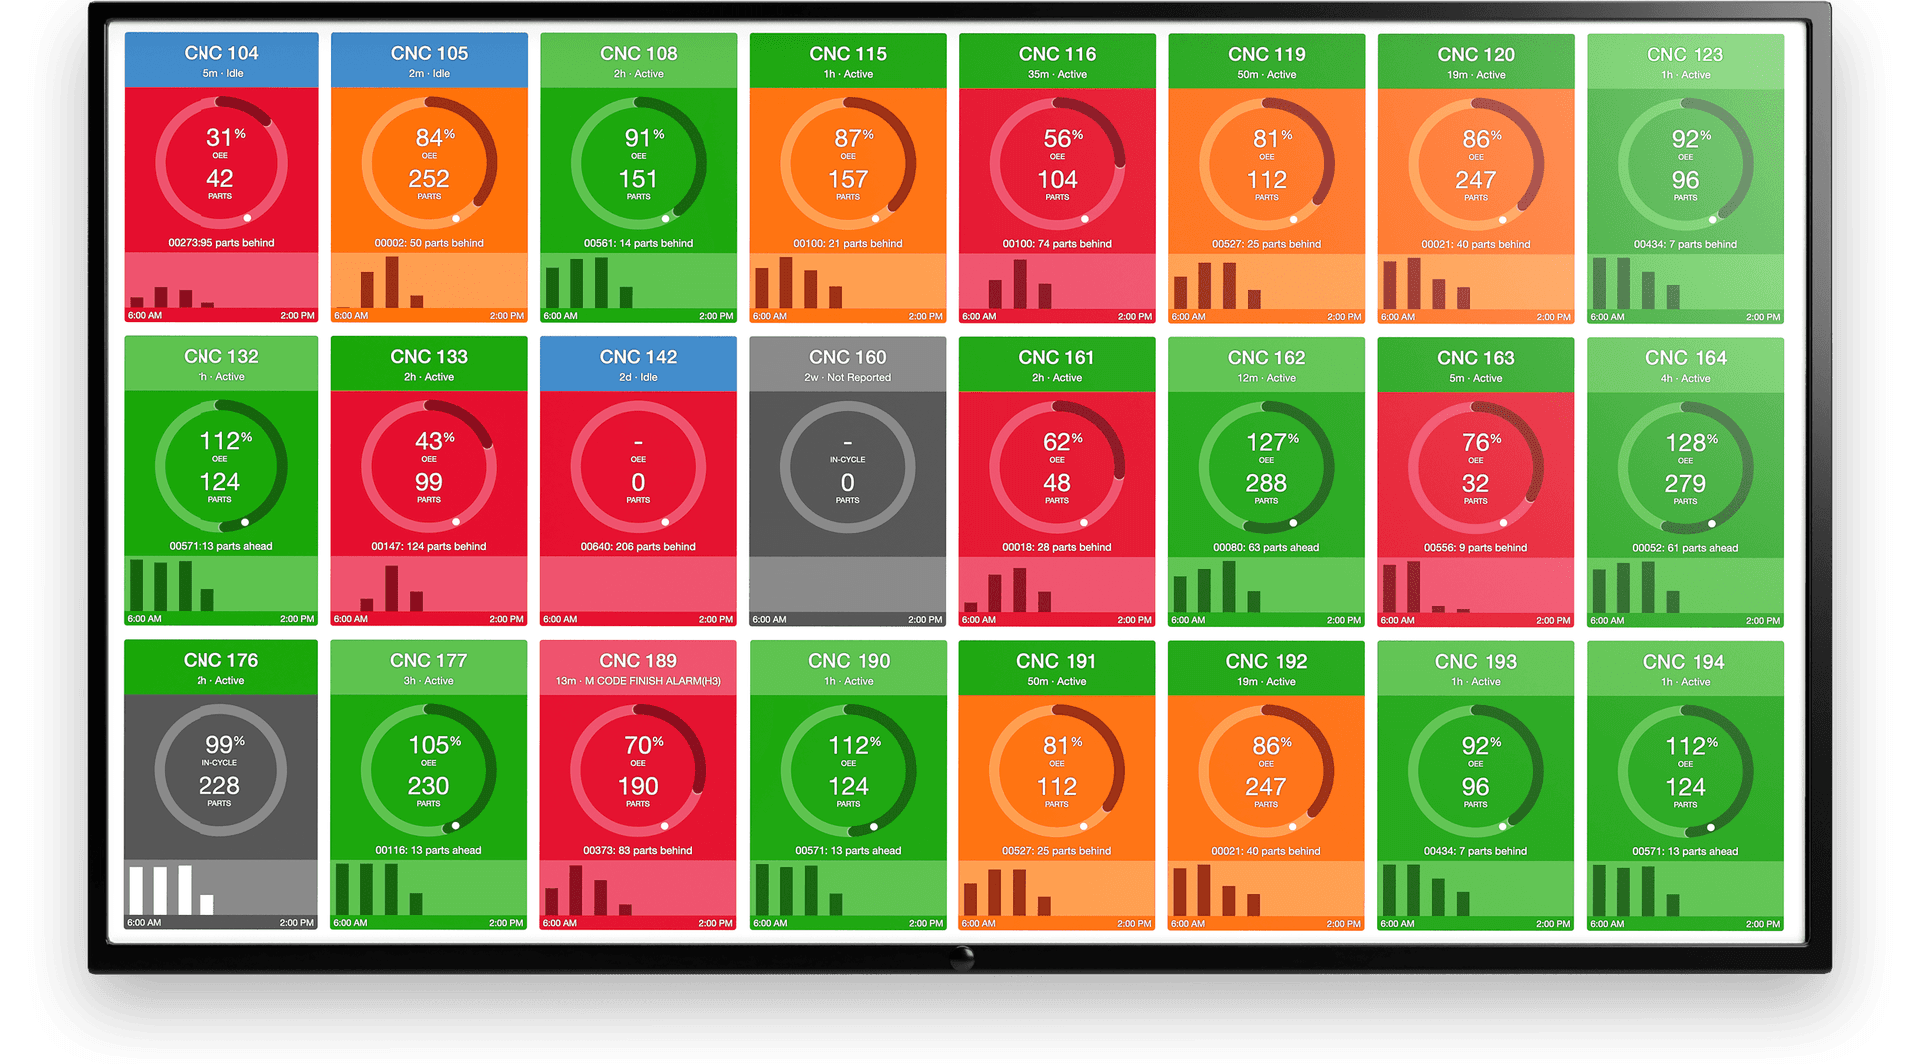
A digital manufacturing dashboard can display:
- Current production output
- Production target
- Production per operator
- Operator count
- Current shift
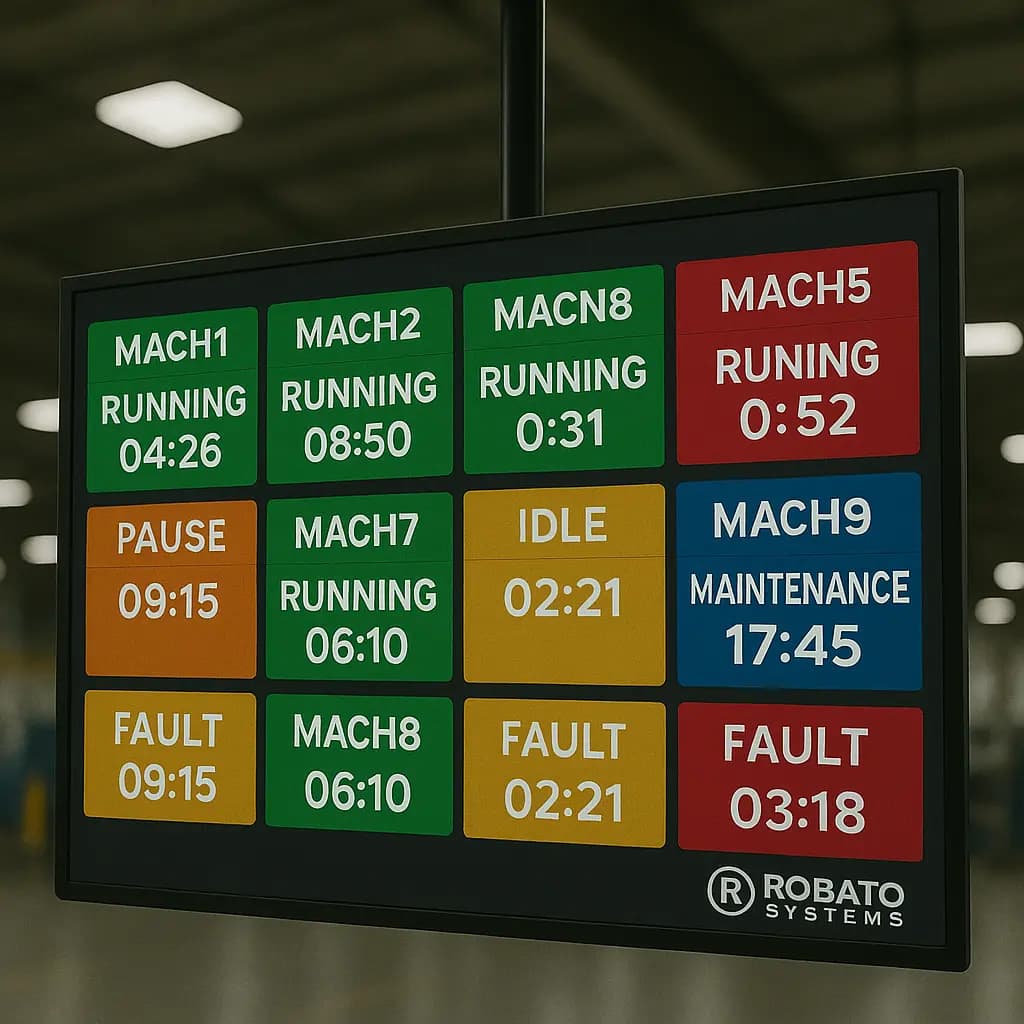
- Machine status
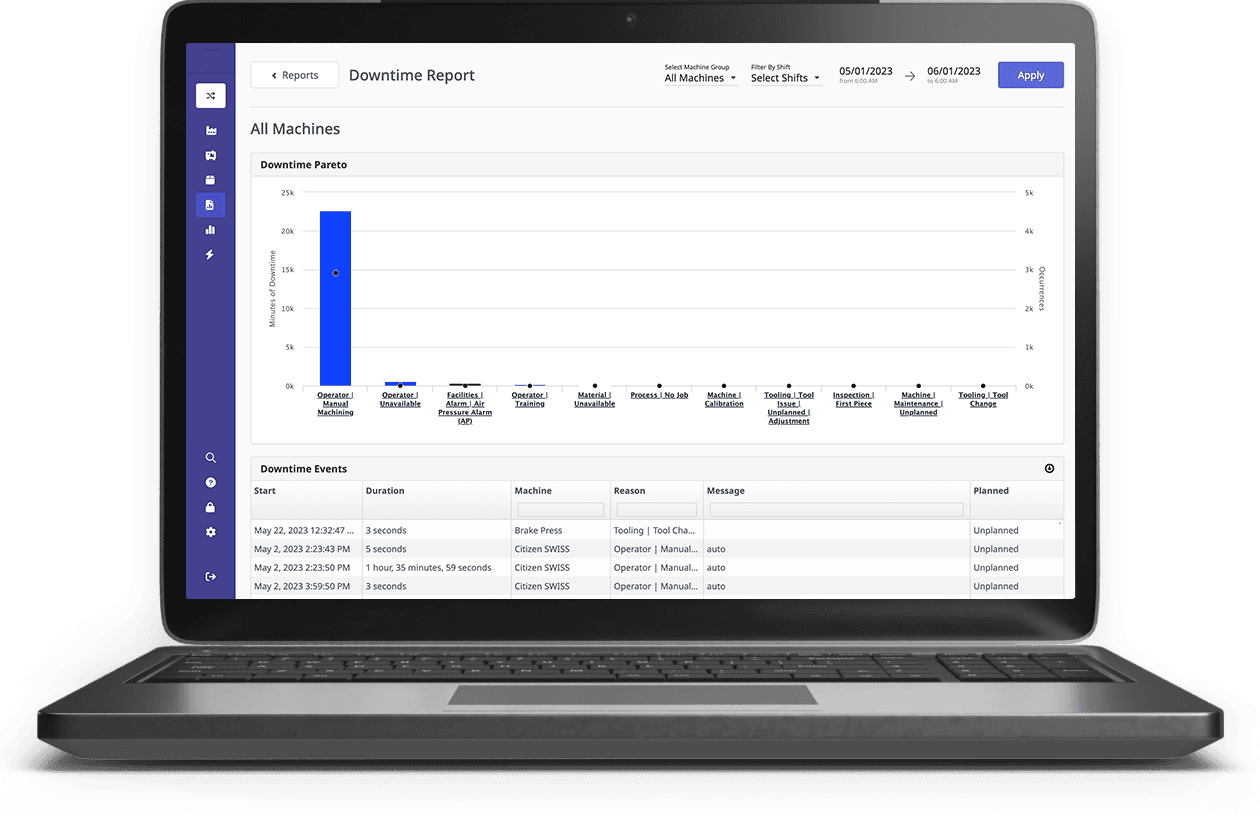
- Downtime
- Production achievement
- Operator utilization
This allows supervisors to identify production gaps while the shift is still active.
For example, if production per operator is significantly below the expected level, the supervisor can investigate whether the cause is:
- Machine downtime
- Material shortage
- Production bottleneck
- Quality issue
- Staffing imbalance
- Changeover
- Process interruption
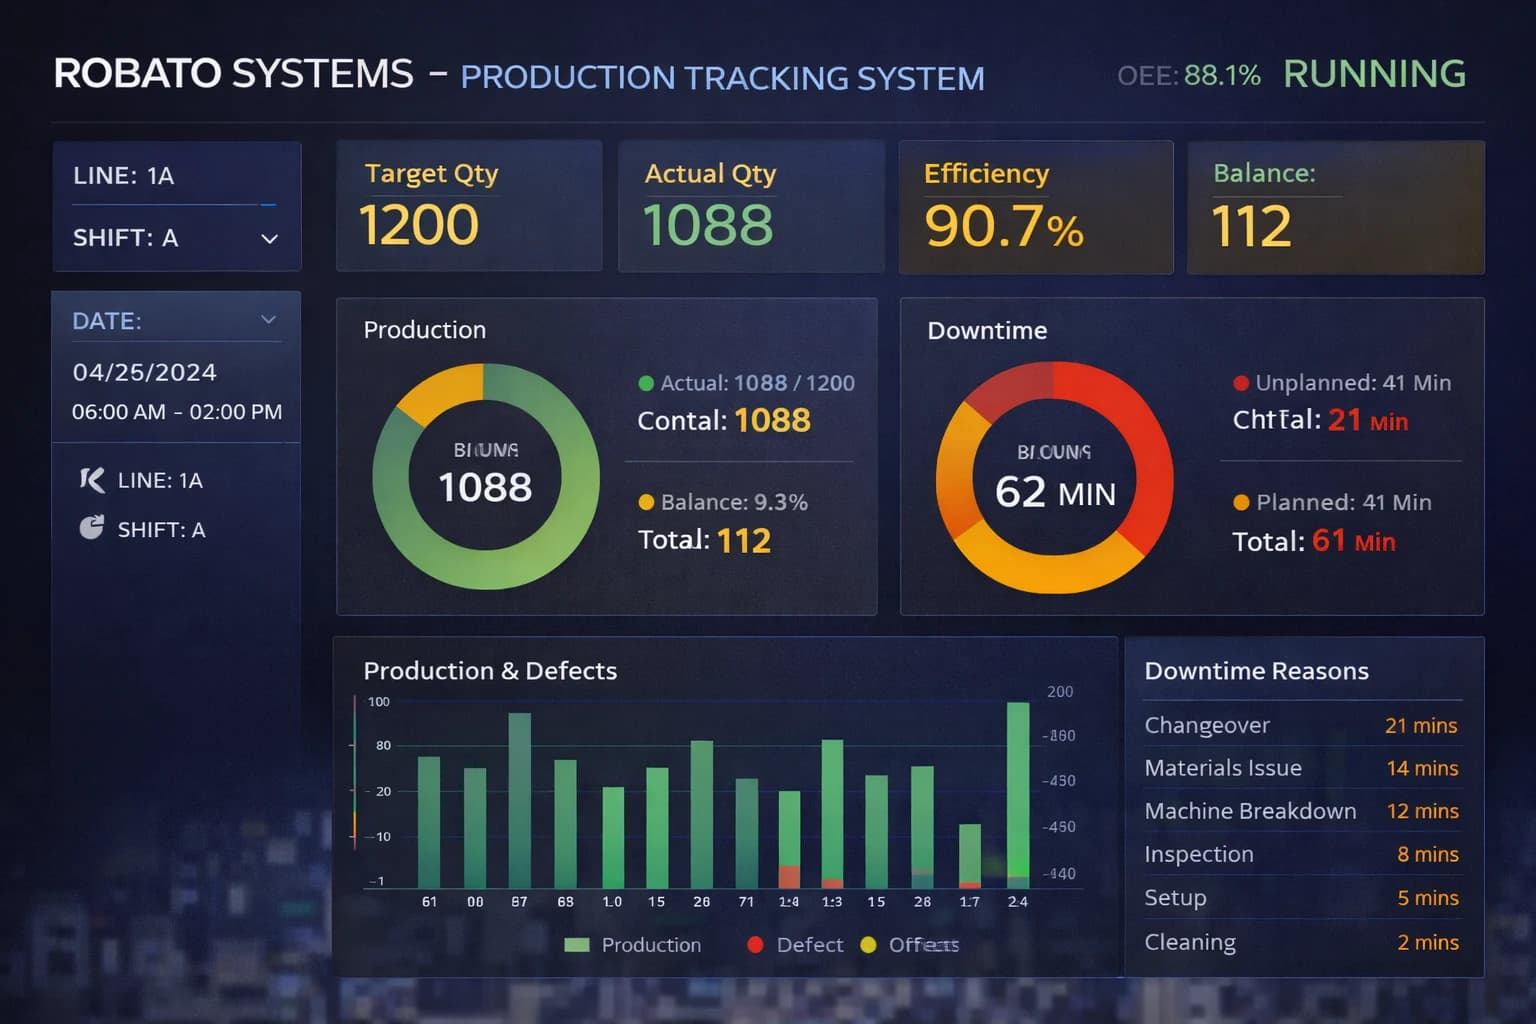
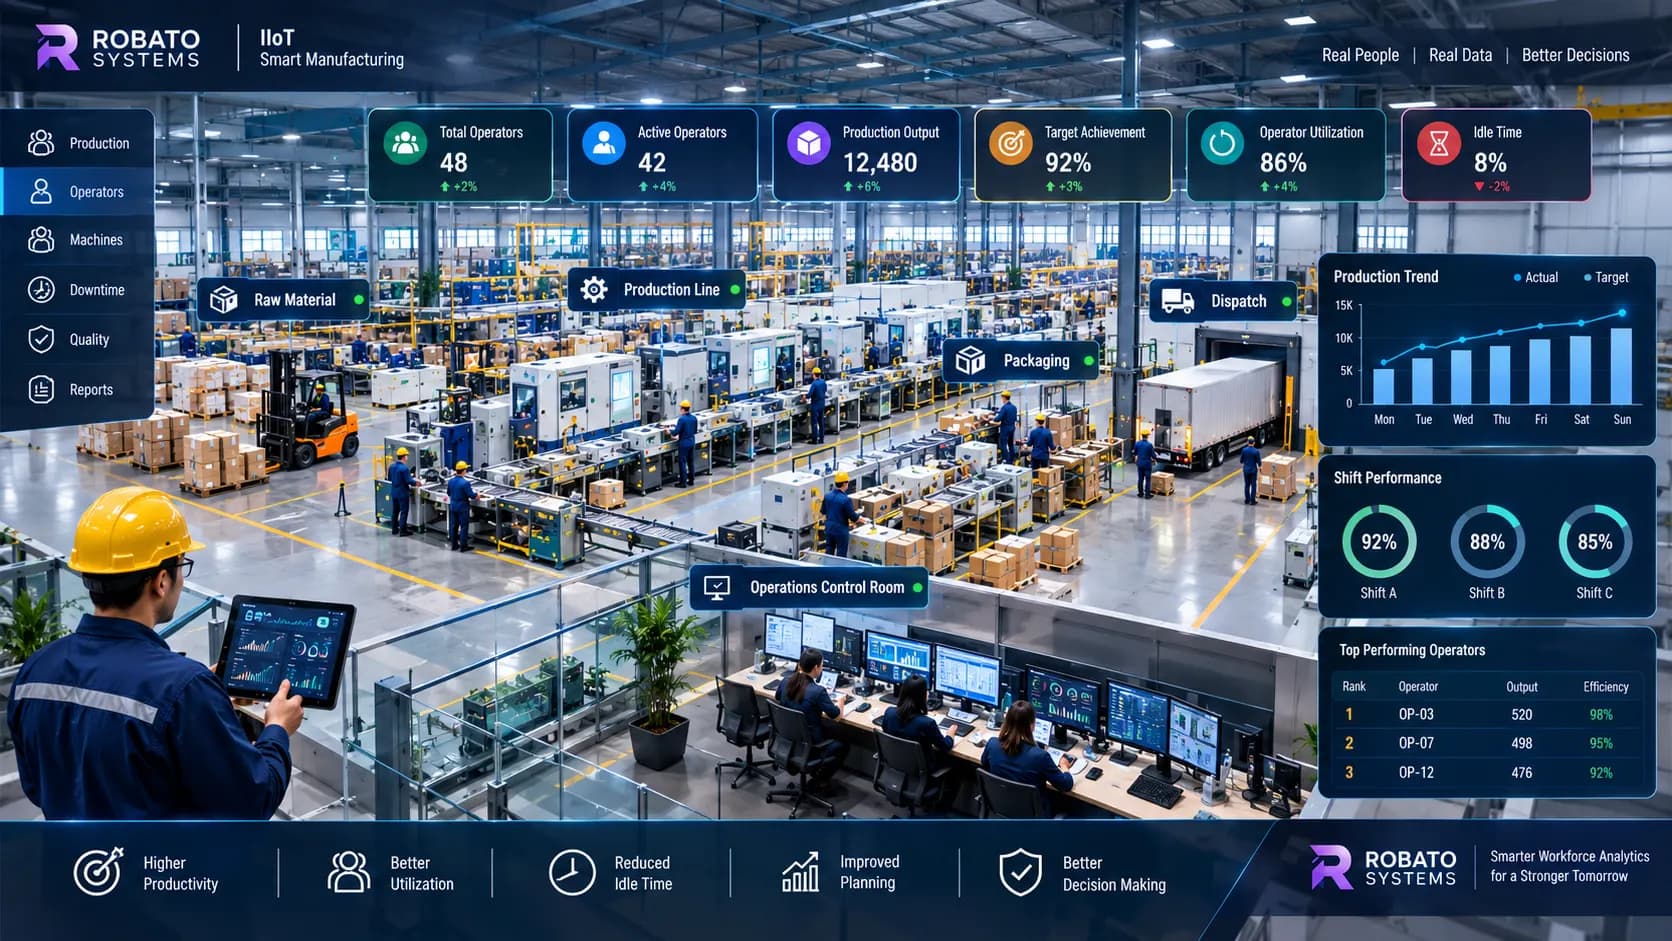
Production Per Operator Dashboard
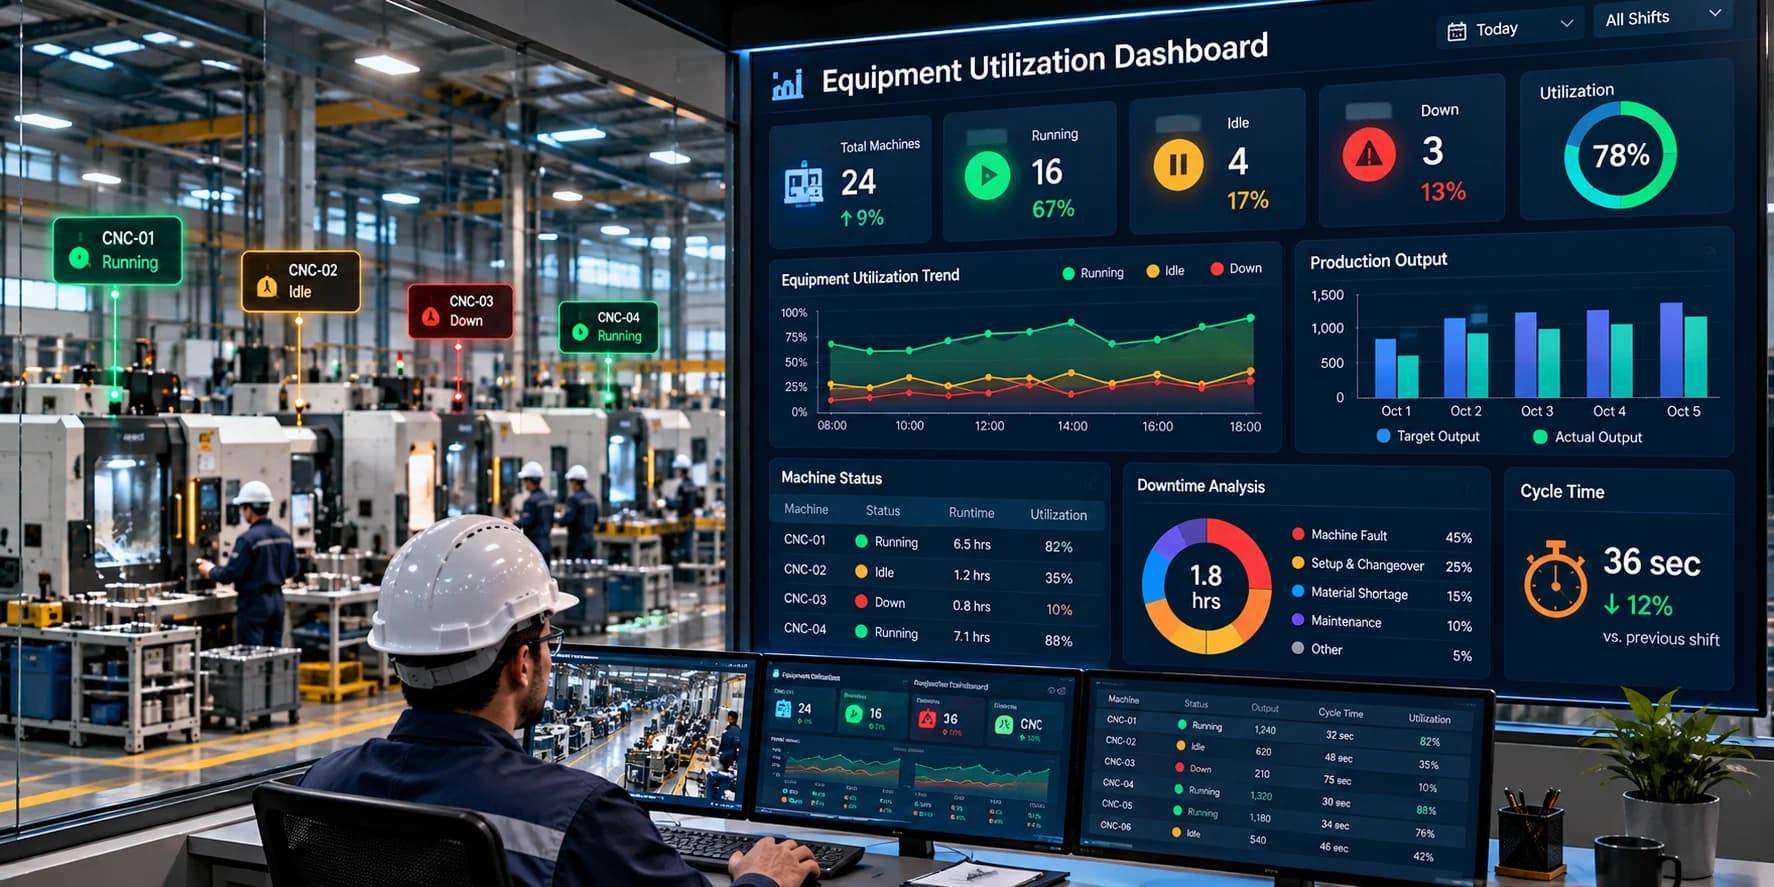
A production per operator dashboard can provide centralized visibility into workforce productivity.
A useful dashboard can contain several sections.
Workforce Overview
Display:
- Total operators
- Active operators
- Available operators
- Operators assigned to production
- Operators affected by downtime
Production Overview
Display:
- Planned production
- Actual production
- Production target
- Production achievement
- Production per operator
Shift Analysis
Display:
- Production per operator by shift
- Operator count by shift
- Target vs actual production
- Utilization by shift
Line Analysis
Display:
- Production per operator by line
- Production output
- Operator count
- Machine downtime
- Production efficiency
Trend Analysis
Historical charts can show how production per operator changes over:
- Days
- Weeks
- Months
- Production campaigns
- Product types
This makes it easier to identify recurring productivity patterns.
Benefits of Tracking Production Per Operator
Better Workforce Planning
Historical production-per-operator data can help managers understand workforce requirements for different production volumes.
Improved Resource Allocation
Production managers can identify where operator capacity is being underused or where additional workforce may be required.
Better Production Scheduling
Workforce productivity data can support more realistic production planning.
Identification of Productivity Gaps
Unexpected changes in production per operator can trigger further investigation.
Improved Shift Analysis
Managers can compare workforce productivity across shifts while considering machine and production conditions.
Data-Driven Workforce Decisions
Instead of relying entirely on assumptions or manual reports, managers can use production data to support operational decisions.
Better Manufacturing Visibility
When integrated with production and machine monitoring systems, production per operator becomes part of a broader manufacturing performance picture.
Manual Production Tracking vs Digital Monitoring
Many factories still use spreadsheets, paper production reports, or manual operator records.
These methods can make workforce productivity analysis difficult.
Common challenges include:
- Delayed data
- Manual calculations
- Inconsistent reporting
- Missing production information
- Difficulty comparing shifts
- Limited historical analysis
- High administrative effort
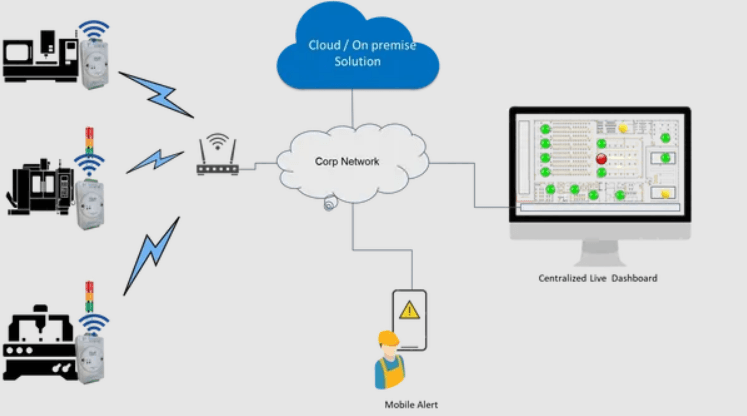
A digital production monitoring system can automatically collect production information and associate it with machines, shifts, lines, and operators.
This provides faster and more consistent visibility.
How to Improve Production Per Operator
Improving production per operator should focus on improving the overall production process rather than simply increasing operator workload.
Reduce Machine Downtime
Reliable machines allow operators to spend more available time on production.
Downtime monitoring can help identify recurring machine problems.
Reduce Material Waiting
Ensuring materials are available at the right workstation at the right time can reduce unnecessary waiting.
Optimize Workforce Allocation
Operators can be assigned according to production requirements, skills, workload, and process needs.
Improve Changeover Processes
Reducing unnecessary changeover time increases the amount of time available for actual production.
Improve Production Planning
Better production scheduling can help align workforce availability with production demand.
Monitor Production Bottlenecks
Identifying bottlenecks can reveal where operators or machines are waiting for upstream or downstream processes.
Track Productivity Trends
Continuous monitoring makes it easier to identify whether improvement initiatives are actually increasing productivity.
Production Per Operator and Manufacturing KPIs
Production per operator should be considered alongside other manufacturing KPIs.
Important related metrics include:
- Overall Equipment Effectiveness
- Machine utilization
- Operator utilization
- Production achievement
- Downtime
- Cycle time
- First-pass yield
- Scrap rate
- Rework rate
- Production efficiency
- Labor productivity
Combining these KPIs provides a broader understanding of factory performance.
For example, increasing production per operator while quality decreases may not represent a genuine improvement.
Similarly, increasing production output while machine downtime rises may indicate that additional capacity constraints need to be addressed.
Production Per Operator and OEE
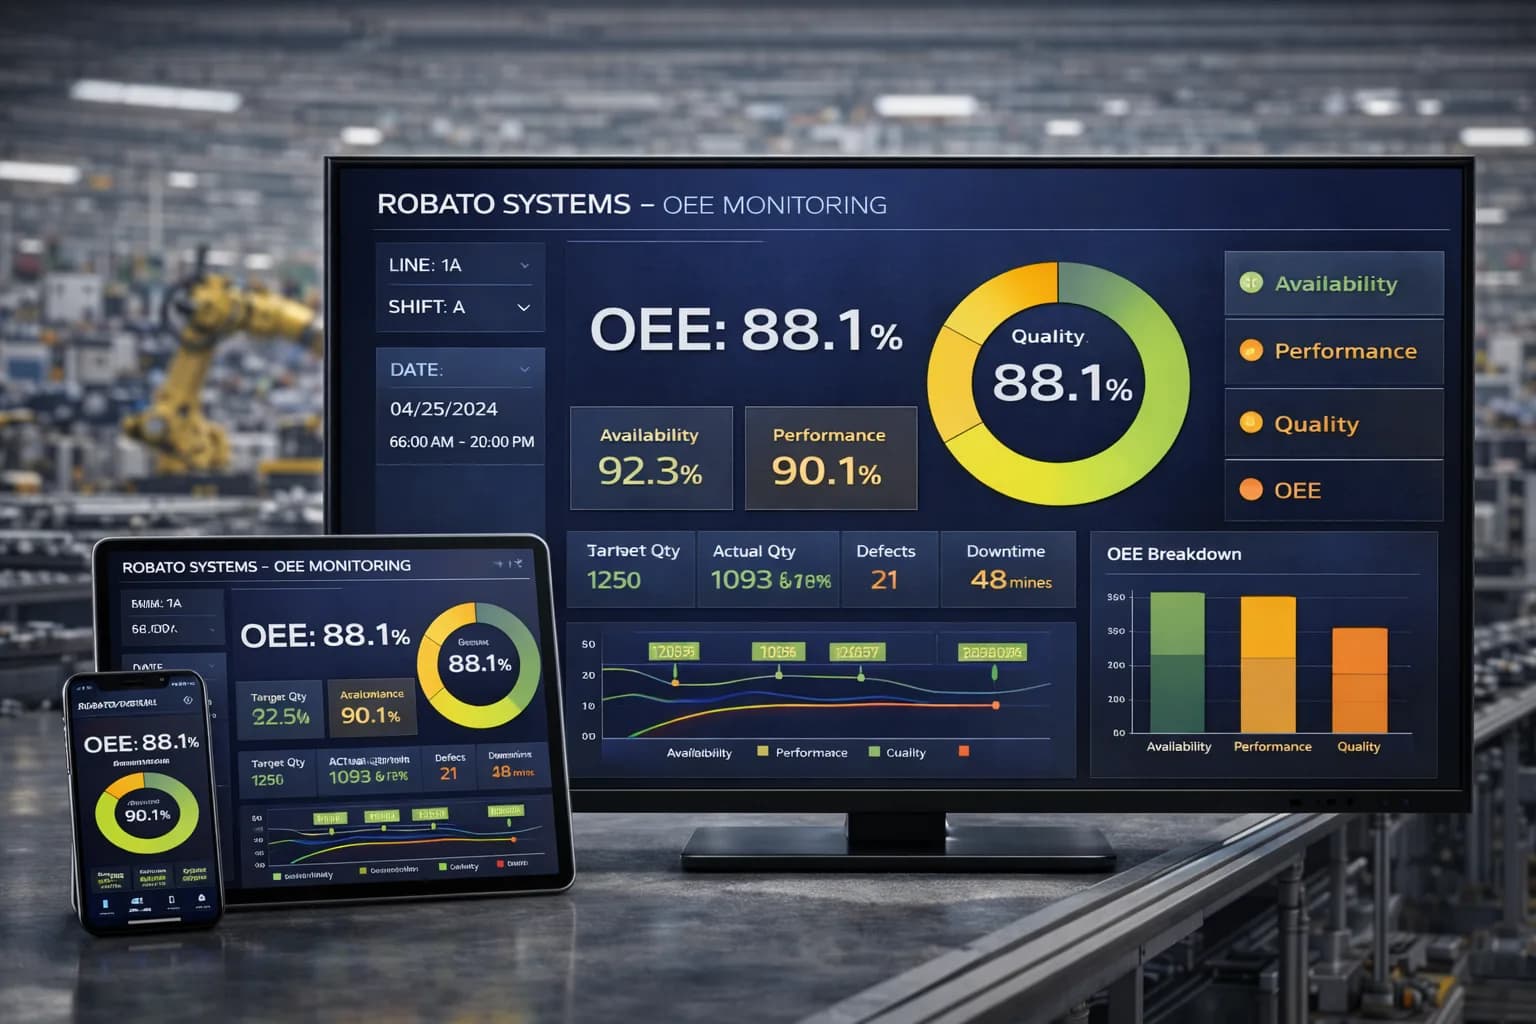
OEE (Overall Equipment Effectiveness) focuses primarily on equipment effectiveness through availability, performance, and quality.
Production per operator focuses on the relationship between production output and workforce involvement.
These metrics measure different areas of manufacturing performance.
When combined, they can help managers understand interactions between:
- Equipment
- Operators
- Production output
- Quality
- Downtime
For example, low OEE combined with low production per operator may indicate equipment or process constraints that are affecting both machine and workforce productivity.
Using Production Per Operator for Continuous Improvement
Production per operator can support continuous improvement programs by providing measurable data.
A typical improvement cycle can be:
Measure → Analyze → Identify Losses → Improve → Monitor → Standardize
For example:
- Measure production per operator.
- Identify shifts or lines with recurring productivity gaps.
- Analyze downtime, waiting, changeovers, and production conditions.
- Implement improvements.
- Monitor the resulting production-per-operator trend.
- Standardize successful processes.
This creates a data-driven approach to workforce and production improvement.
Best Practices for Production Per Operator Tracking
1. Use Consistent Definitions
Define exactly what production output and operator count mean within the organization.
2. Track Time Periods Consistently
Compare similar shifts, production periods, and operating conditions.
3. Consider Product Differences
Do not directly compare products with significantly different production complexity without appropriate context.
4. Include Downtime Data
Production output should be analyzed alongside machine downtime and production interruptions.
5. Monitor Quality
High output should not come at the expense of product quality.
6. Analyze Trends
Historical data is often more useful than a single shift's result.
7. Use Multiple KPIs
Production per operator should be part of a broader manufacturing KPI framework.
8. Focus on Process Improvement
The metric should help identify operational constraints and improvement opportunities rather than become a standalone employee ranking.
Role of Manufacturing Productivity Software
Modern manufacturing productivity software can bring production, workforce, machine, and operational information into one centralized system.
Instead of calculating production per operator manually, a digital system can connect:
- Operator information
- Production counts
- Machine data
- Shift information
- Production targets
- Downtime
- Quality information
- OEE metrics
This creates a more complete view of manufacturing productivity.
For organizations operating multiple production lines or plants, centralized dashboards can make it easier to monitor workforce productivity across the manufacturing environment.
How Robato Systems Can Help Monitor Manufacturing Productivity
Robato Systems develops IIoT and manufacturing software solutions designed to provide better visibility into production operations.
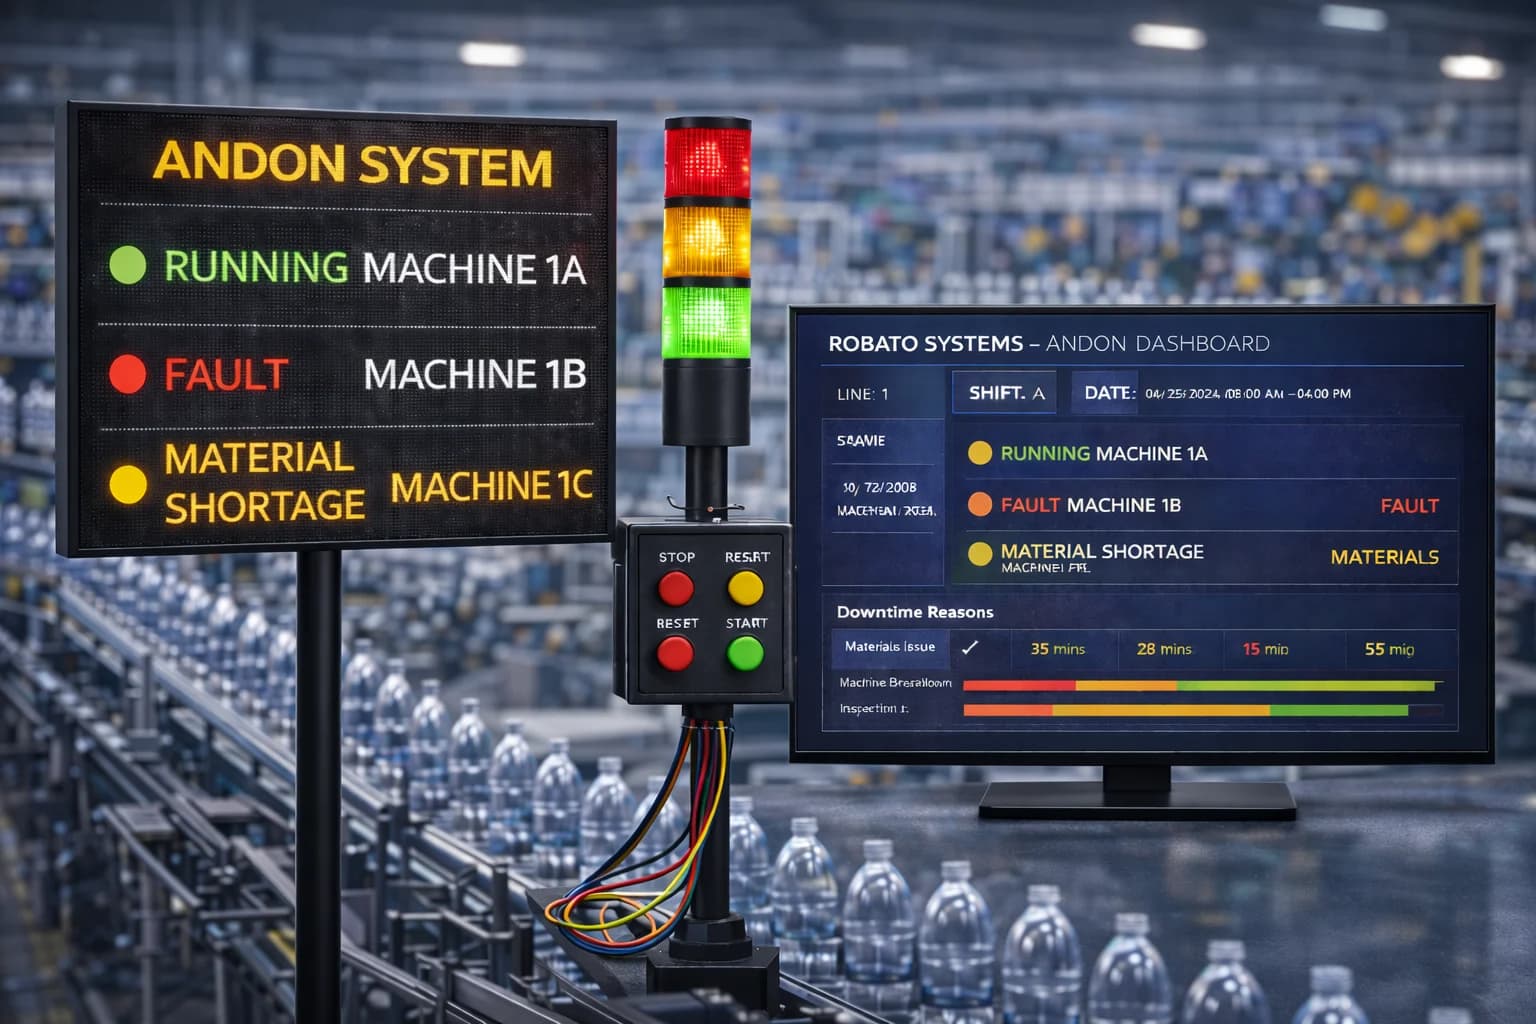
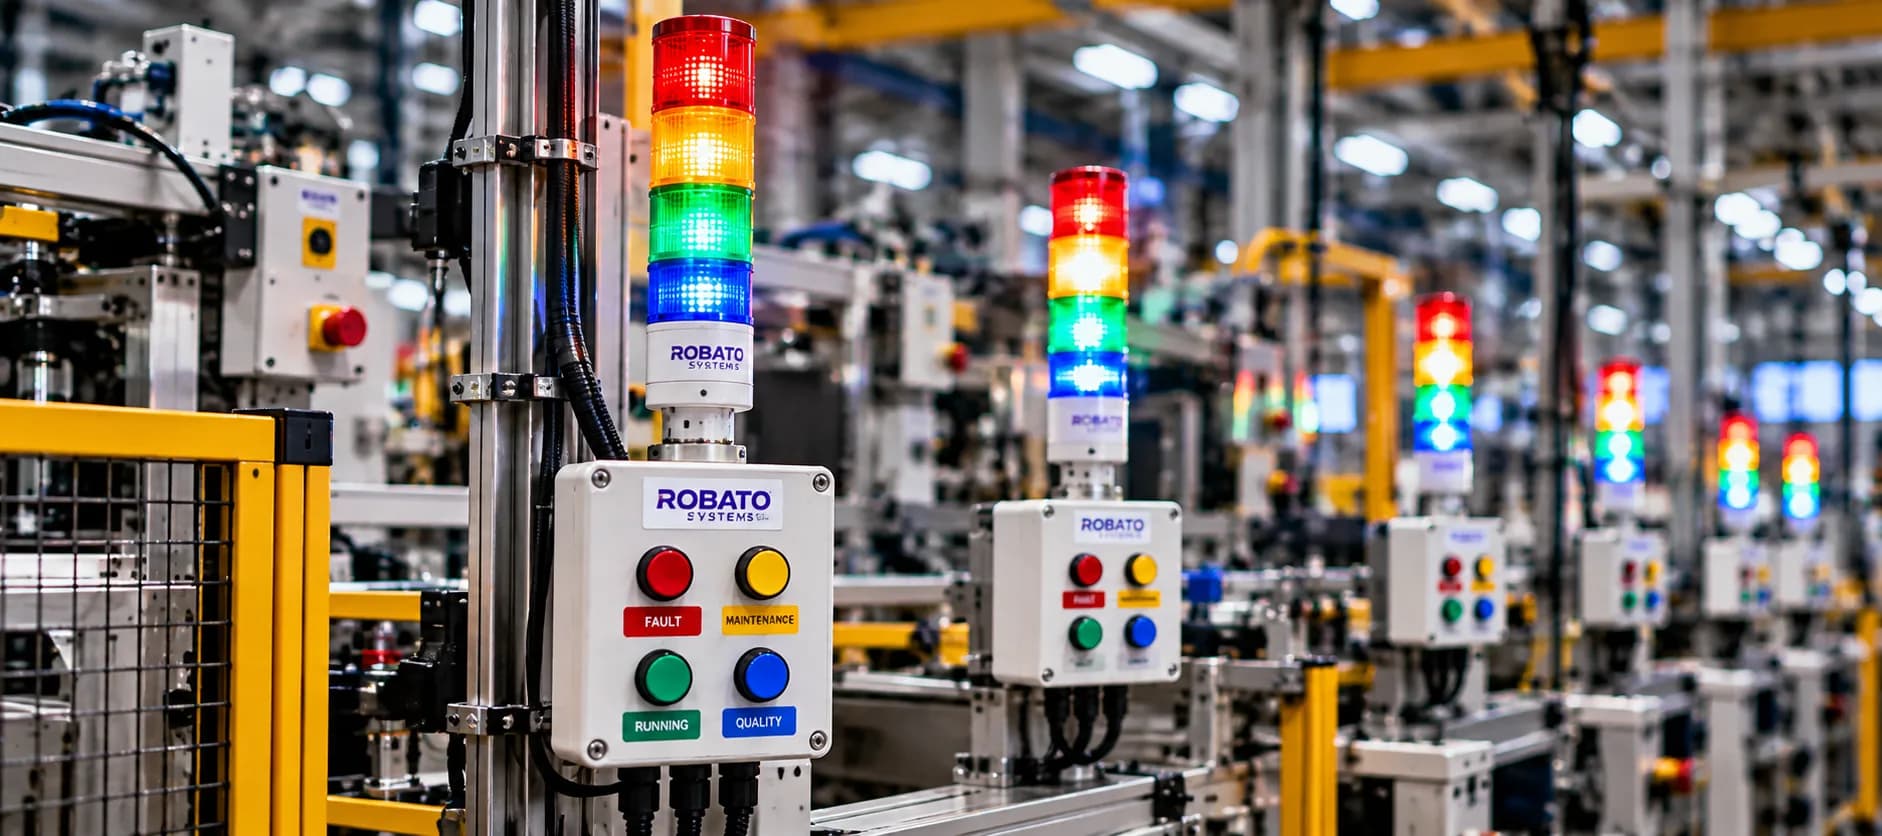
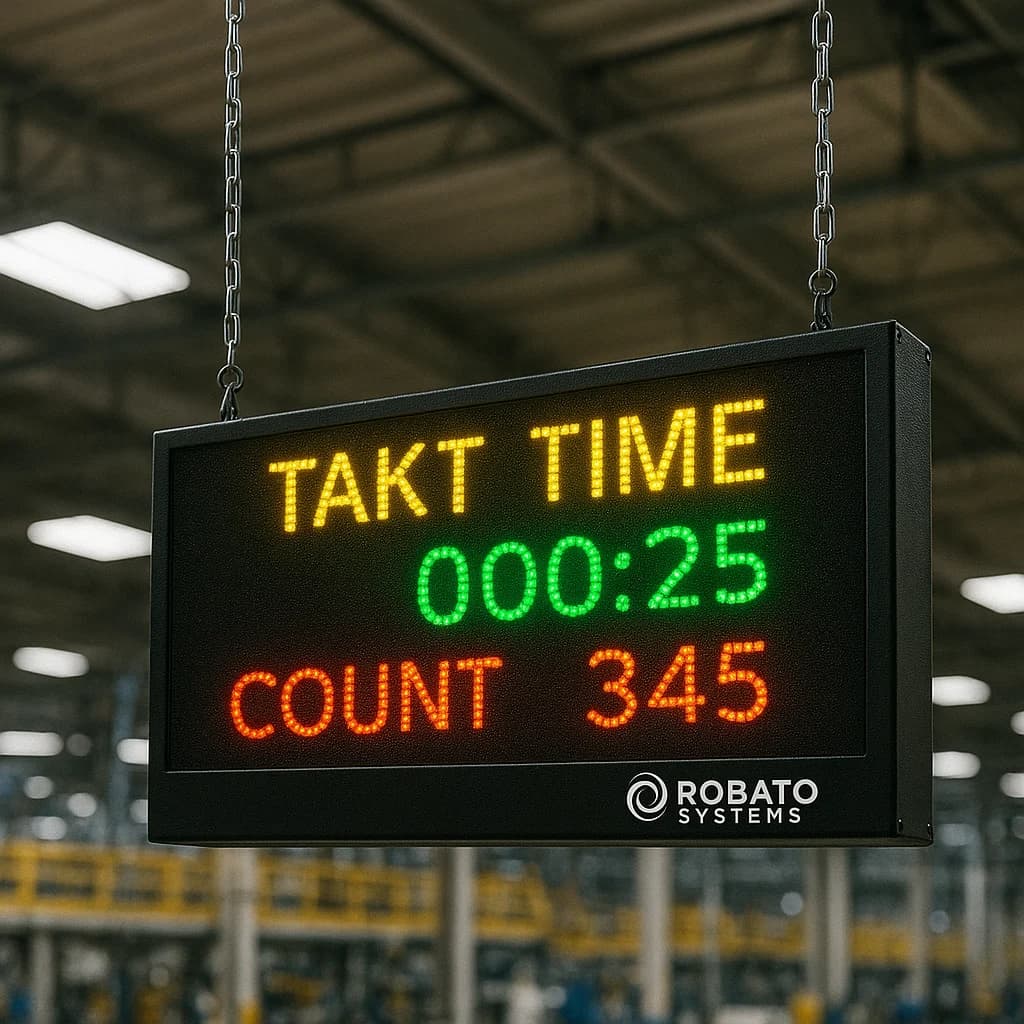
Production monitoring, OEE monitoring, downtime tracking, operator efficiency, and digital Andon capabilities can work together to provide a connected view of shop floor performance.
By connecting production information with operator and machine data, manufacturers can analyze metrics such as production output, operator utilization, downtime, target achievement, and production efficiency.
This can help production managers move from manual reporting toward real-time, data-driven manufacturing management.
Conclusion
Production per operator is a useful manufacturing productivity metric for understanding how workforce capacity is associated with production output.
By tracking production output against the number of operators, manufacturers can gain additional visibility into workforce productivity, staffing requirements, production efficiency, and operational performance.
However, the metric should never be analyzed in isolation.
Machine downtime, material availability, product complexity, changeovers, quality, production scheduling, and operator utilization can all influence the result.
When production per operator is combined with real-time production monitoring, operator utilization, OEE, downtime tracking, and manufacturing KPIs, it becomes a valuable part of a broader factory performance management strategy.
For modern manufacturing organizations, digital monitoring can make this analysis faster, more consistent, and more actionable.
FAQs
What is production per operator?
Production per operator is a manufacturing productivity metric that measures the amount of production output associated with each operator during a defined period.
How do you calculate production per operator?
The basic calculation is total production output divided by the number of operators involved in producing that output.
Why should manufacturers track production per operator?
It helps manufacturers understand workforce productivity, compare production performance, identify resource allocation opportunities, and analyze production efficiency.
Is production per operator the same as operator productivity?
Production per operator is one metric used to understand operator productivity. Operator productivity can also include utilization, target achievement, productive time, quality, and other workforce-related measurements.
Can production per operator be tracked in real time?
Yes. With digital production monitoring software, production data can be connected with operator, shift, machine, and production information to provide real-time visibility.
What factors affect production per operator?
Machine performance, downtime, material availability, product complexity, changeover time, production planning, quality requirements, staffing, and operator utilization can all affect production per operator.
How can production per operator be improved?
Manufacturers can improve it by reducing downtime, improving material availability, optimizing workforce allocation, reducing changeover time, improving production planning, and identifying production bottlenecks.
Can production per operator be used with OEE?
Yes. Production per operator and OEE measure different aspects of manufacturing performance and can be analyzed together for a broader view of production efficiency.
What should a production per operator dashboard include?
A dashboard can include production output, operator count, production target, production achievement, production per operator, shift performance, machine downtime, operator utilization, and historical trends.
Is production per operator suitable for every manufacturing process?
The metric can be useful across many manufacturing environments, but comparisons should account for differences in product complexity, automation, process requirements, staffing models, and operating conditions.