Introduction
Manufacturing productivity depends on more than the number of machines installed on a factory floor. What matters is how effectively those machines are used to produce the required output within the available production time.
A machine may be operational for most of a shift and still deliver lower-than-expected productivity because of slow cycles, frequent short stops, inefficient changeovers, material shortages, or inconsistent production performance.
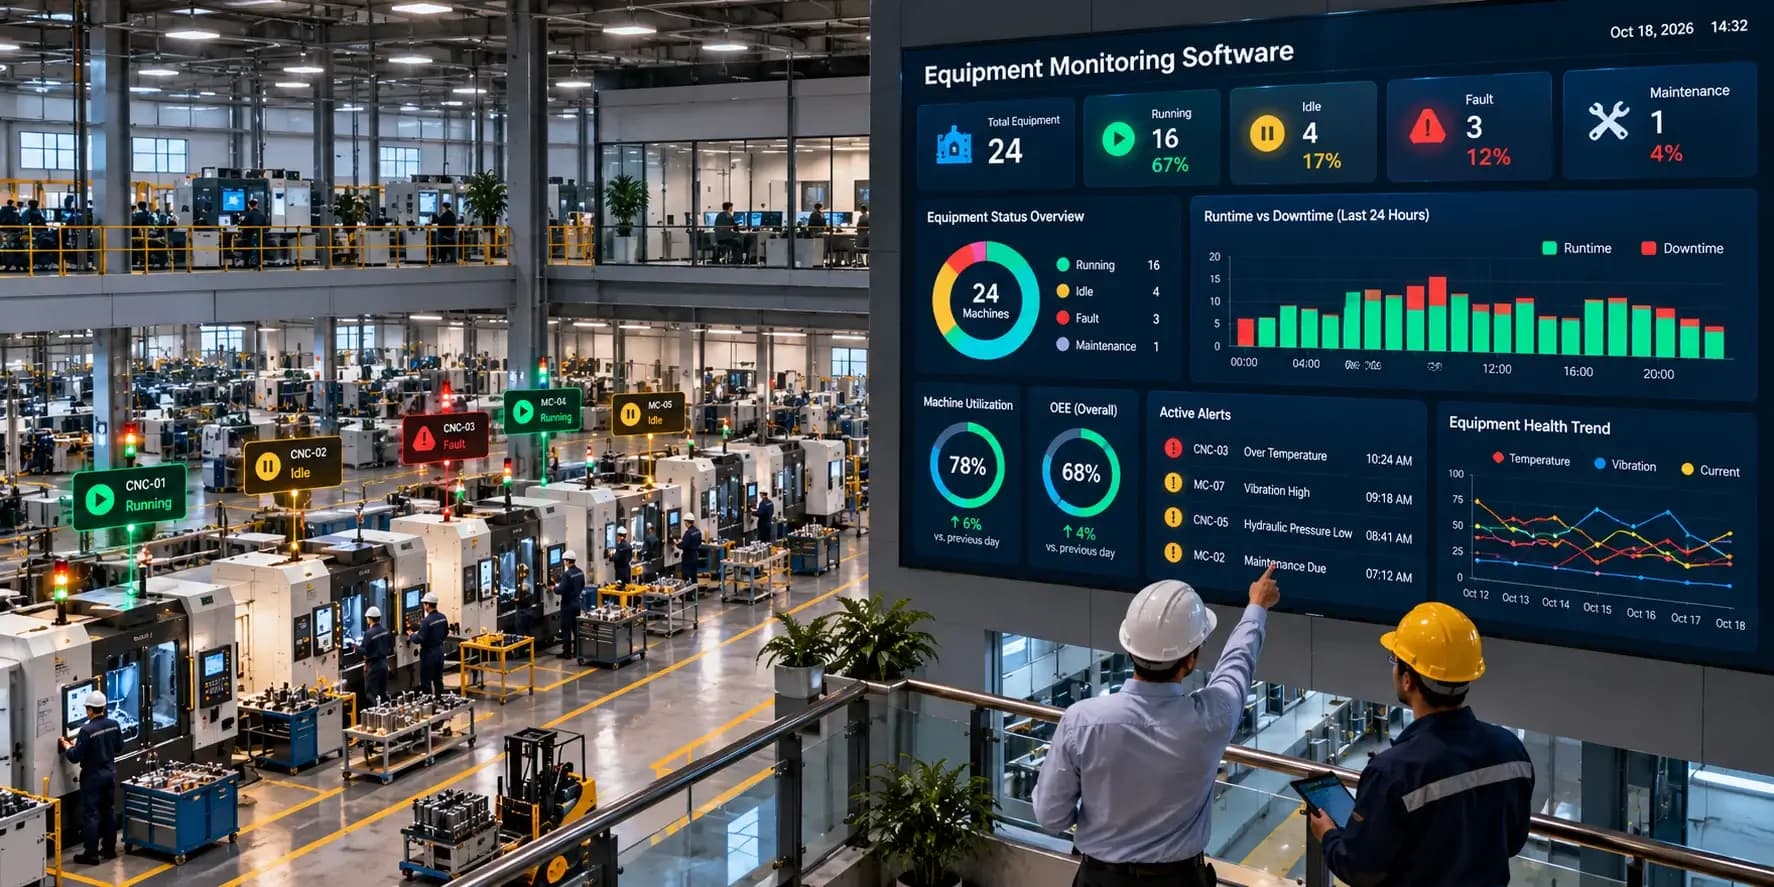
Machine Productivity Monitoring helps manufacturers measure and understand these conditions using machine and production data. Instead of relying only on manual production records, organizations can track machine activity, production output, cycle times, operating periods, downtime, and other relevant indicators.
The result is a clearer picture of how production equipment is performing and where productivity losses may be occurring.
This guide explains machine productivity monitoring, the metrics involved, how it works, its benefits, implementation methods, common challenges, and best practices for manufacturing environments.
What Is Machine Productivity Monitoring?
Machine productivity monitoring is the process of collecting, measuring, and analyzing data related to the productive output of manufacturing equipment.
The objective is to understand the relationship between:
Available production time
Actual machine operating time
Production output
Expected production output
Cycle time
Downtime
Idle time
Production interruptions
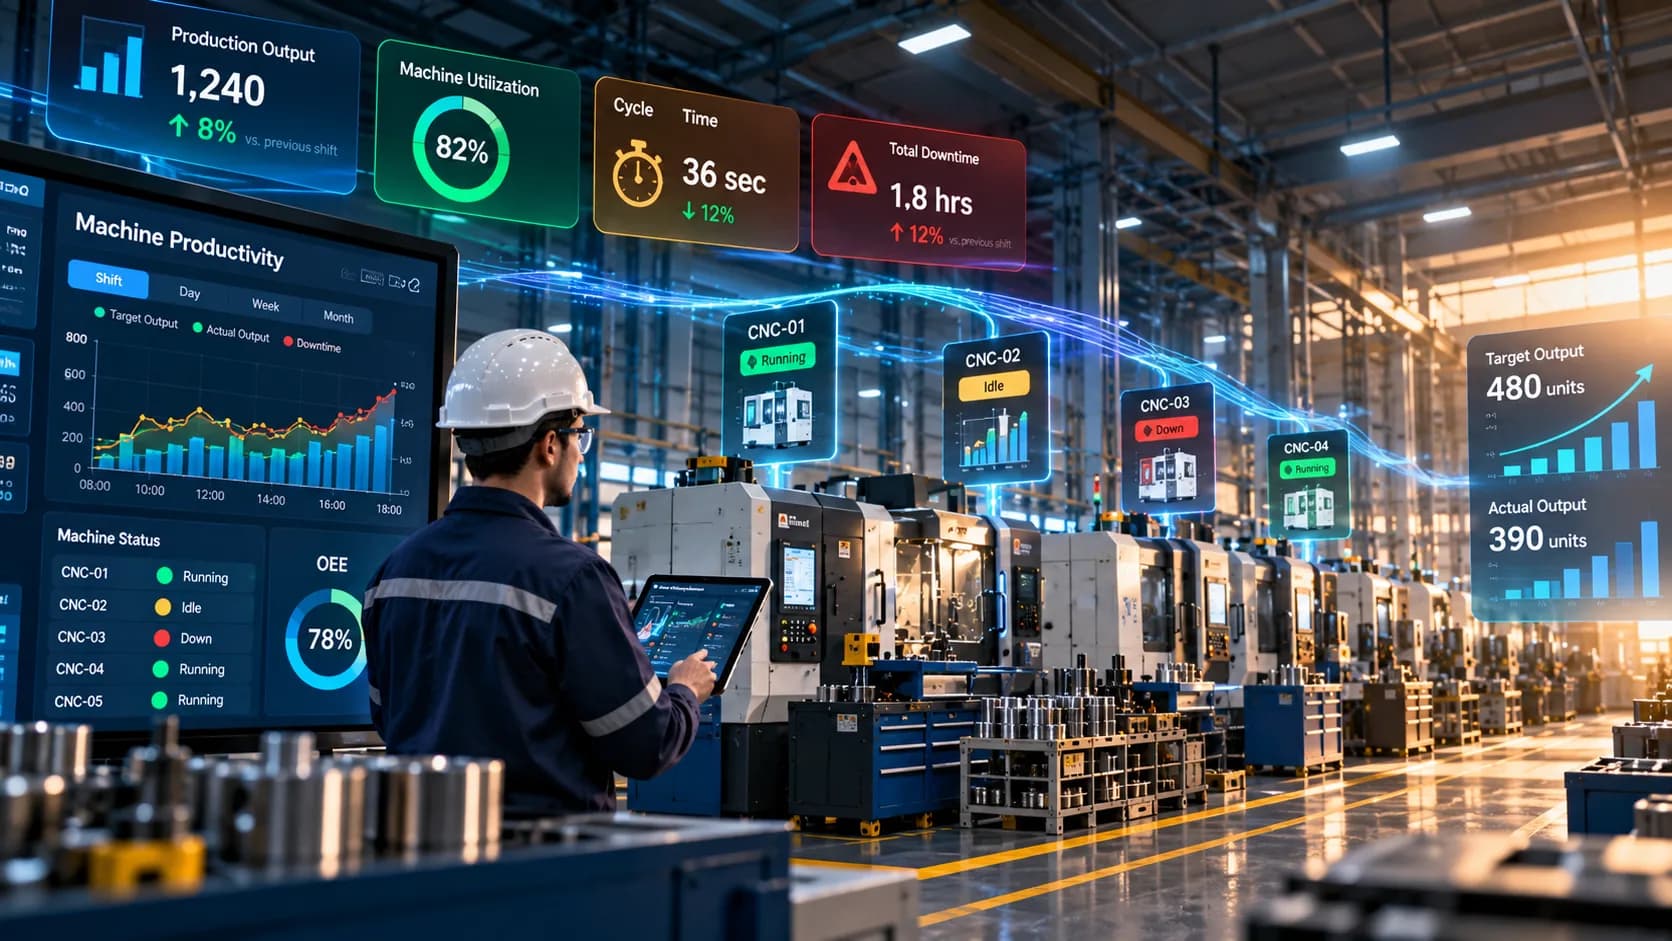
For example, suppose a machine is expected to produce 480 units during an eight-hour shift. If it produces only 390 units, productivity monitoring can help identify what happened during the shift.
The difference may be caused by downtime, slower production cycles, changeovers, material availability, quality issues, or other operational factors.
Machine productivity monitoring therefore goes beyond simply counting production output. It provides the operational context needed to understand that output.
Why Is Machine Productivity Monitoring Important?
Production managers often need to answer questions such as:
How much did each machine produce?
Which machines are operating below target?
Why was production lower during a particular shift?
How much time was lost to downtime?
Which machines have the longest cycle times?
Are production rates consistent across shifts?
Is available machine capacity being used effectively?
Without reliable machine-level data, these questions can require manual investigation.
Machine productivity monitoring creates a measurable record of equipment activity and production performance.
This helps organizations move from “we produced less than expected” to “we can identify where and when production capacity was lost.”
How Does Machine Productivity Monitoring Work?
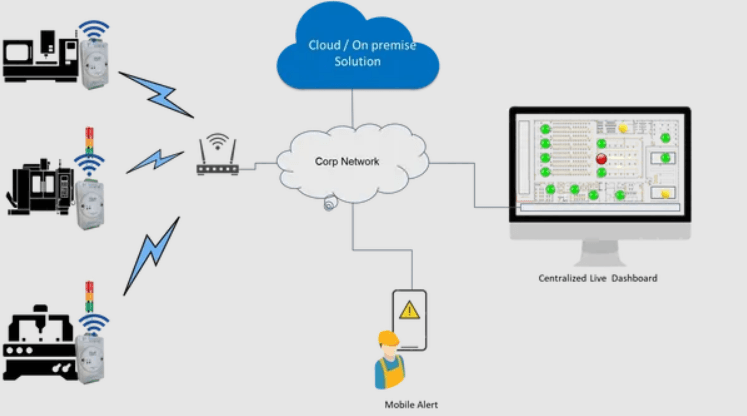
A machine productivity monitoring system generally combines machine data, production information, calculations, dashboards, and reporting.
1. Machine Data Collection
The system collects relevant information from manufacturing equipment.
Depending on the factory environment, this may include:
Production signals
Cycle counts
Machine counters
PLC data
CNC data
Sensor information
Production system data
2. Production Data Processing
The collected data is processed into meaningful production information.
For example, individual machine signals can be converted into:
Running time
Stopped time
Production cycles
Output quantity
Cycle duration
Idle periods
3. Productivity Calculation
The software can compare actual production performance with defined targets or expected operating conditions.
This allows teams to identify machines that are producing below expected levels.
4. Dashboard Visualization
The information is displayed through dashboards that can provide machine-level, line-level, shift-level, or plant-level visibility.
5. Analysis and Improvement
Production teams analyze the data to identify productivity losses and determine what operational changes may improve output.
What Is the Difference Between Machine Productivity and Machine Efficiency?
The terms are related but are not identical.
Machine efficiency generally focuses on how effectively available machine time and capacity are used.
Machine productivity focuses more directly on the output achieved relative to the resources or time used to produce that output.
For example:
| Machine Efficiency | Machine Productivity |
|---|---|
| Focuses on equipment utilization | Focuses on production output |
| Runtime | Units produced |
| Downtime | Production rate |
| Idle time | Output per hour |
| Utilization | Cycle performance |
| Availability | Output against target |
Both should be considered together.
A machine can have high utilization but still produce below target because its production cycle is too slow.
Similarly, a machine may produce a good number of units but experience excessive downtime that limits overall capacity.
Key Metrics for Machine Productivity Monitoring
Selecting the right metrics is important because productivity cannot be understood from a single number.
Production Output
Production output represents the number of units, parts, batches, or cycles produced during a specific period.
Output can be measured by:
Hour
Shift
Day
Week
Month
Production order
Production Rate
Production rate indicates how much output a machine generates over a specific period.
For example:
Production Rate = Units Produced ÷ Operating Time
This can help compare machines operating under similar conditions.
Cycle Time
Cycle time is the amount of time required to complete one production cycle.
Monitoring cycle time can reveal whether a machine is operating at its expected production speed.
Target vs. Actual Output
Comparing planned production with actual output helps identify production gaps.
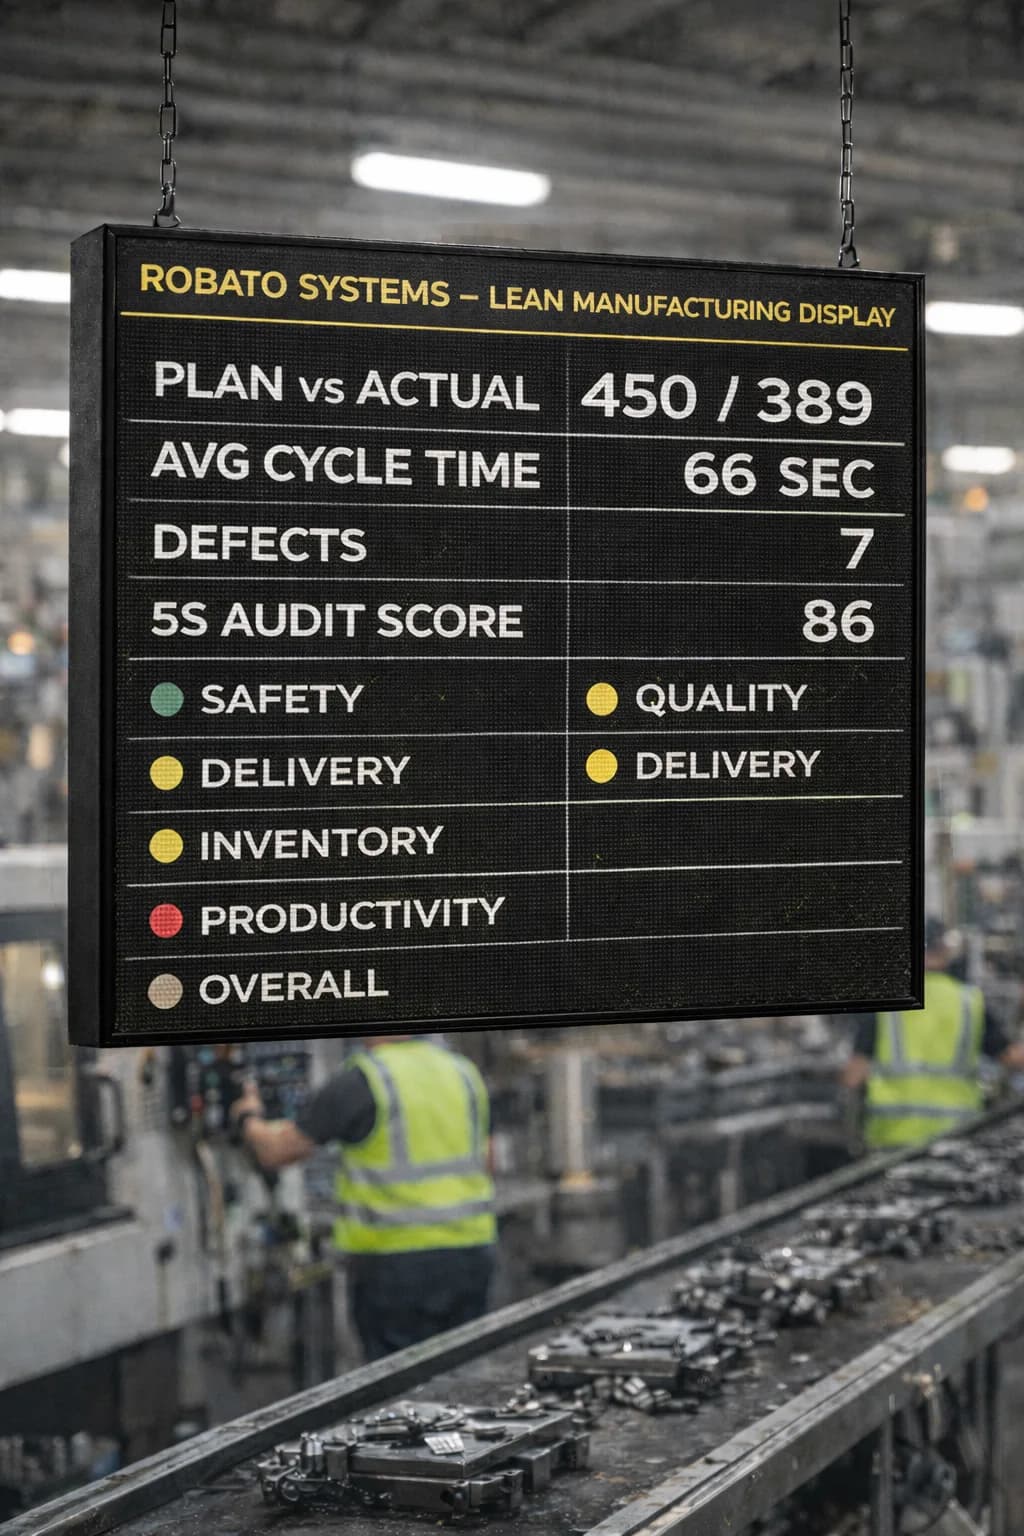
For example:
Target: 500 units
Actual: 450 units
Production gap: 50 units
The next step is determining why the gap occurred.
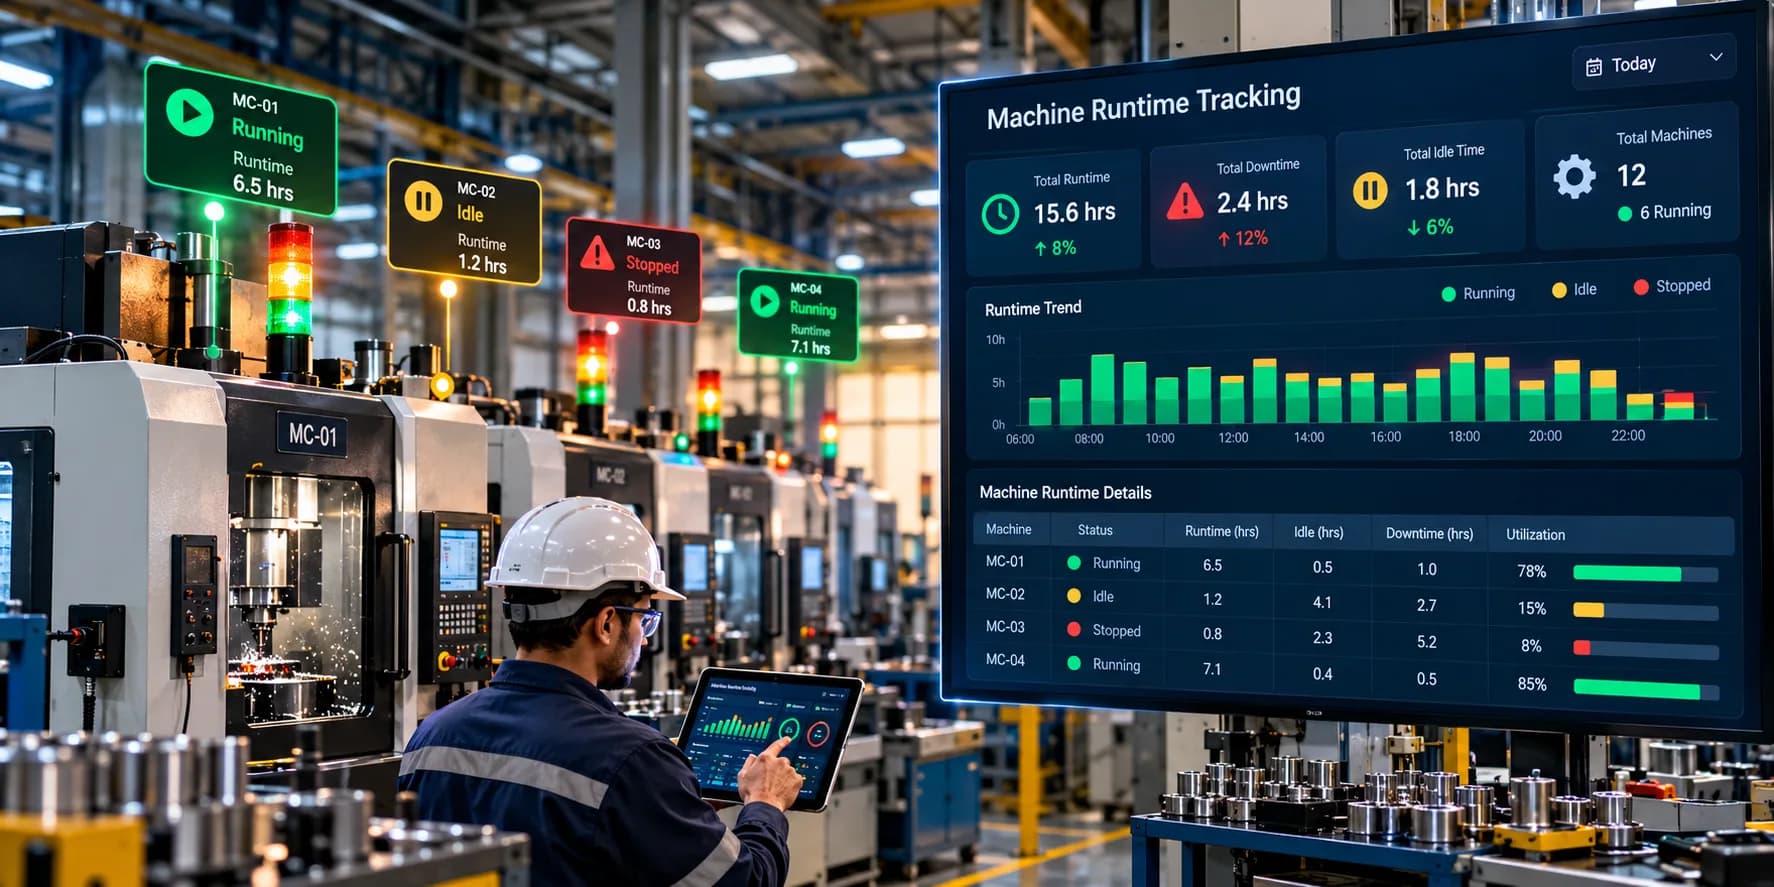
Machine Runtime
Runtime indicates how long the machine was actively operating.
A machine with high available time but low runtime may require investigation into scheduling, material availability, or operational interruptions.
Downtime
Downtime represents periods when production equipment is stopped or unavailable.
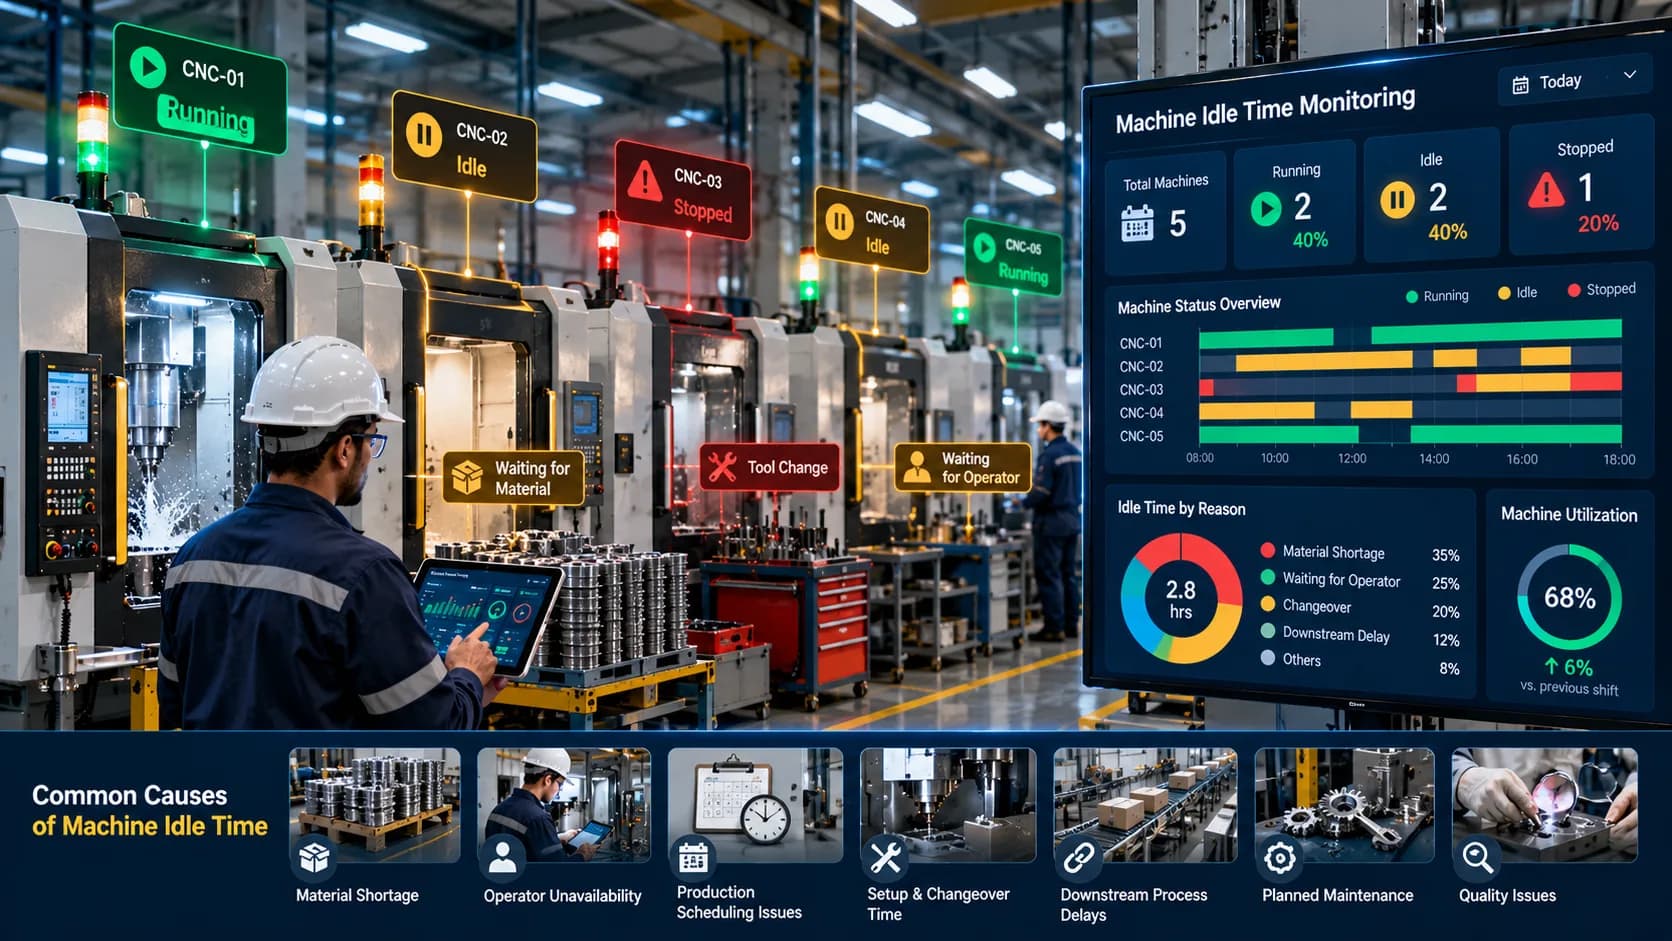
Idle Time
Idle time represents periods when equipment is available but not actively producing.
Utilization
Utilization provides an indication of how much available equipment capacity is being used.
Factors That Affect Machine Productivity
Several factors can influence machine productivity.
Machine Downtime
Unexpected breakdowns can directly reduce available production time.
Slow Cycle Times
A machine can remain operational while producing at a slower rate than expected.
This type of productivity loss may not be visible through simple running/stopped monitoring.
Frequent Short Stops
Repeated short interruptions can accumulate into significant production losses.
Examples include:
Minor machine adjustments
Sensor interruptions
Material positioning
Tool-related issues
Operator interventions
Changeover Time
Production changes between products can reduce productive operating time.
Longer-than-planned changeovers can have a measurable impact on shift output.
Material Availability
A machine cannot maintain productivity if required raw materials or components are unavailable.
Operator Availability
Some manufacturing processes depend heavily on operator interaction. Staffing or availability issues can therefore affect output.
Quality Problems
Rejects and rework can reduce effective production output even when the machine appears to be operating normally.
Maintenance Activities
Planned maintenance can reduce available production time but may be necessary to prevent more serious failures.
Machine Productivity Monitoring vs. Manual Production Tracking
Many factories still rely on operators or supervisors to record production information manually.
Manual tracking can provide basic production records, but it becomes difficult to maintain consistent and detailed information across many machines and shifts.
| Manual Production Tracking | Machine Productivity Monitoring |
|---|---|
| Manual entries | Automated data collection where supported |
| Periodic reporting | Continuous or near-real-time monitoring |
| Limited machine-level visibility | Detailed equipment-level information |
| Difficult to identify short stops | Short interruptions can be analyzed |
| Time-consuming reporting | Automated dashboards and reports |
| Limited historical analysis | Historical productivity trends |
| Higher dependence on manual records | Centralized machine data |
Automated monitoring does not eliminate the need for operators or supervisors. Instead, it gives them better information for making production decisions.
Benefits of Machine Productivity Monitoring
1. Better Understanding of Production Output
Managers can see how much each machine produces and how production changes over time.
2. Identification of Productivity Losses
The system can help reveal losses caused by downtime, idle periods, slow cycles, or repeated interruptions.
3. Improved Shift Comparisons
Production teams can compare productivity across shifts and identify significant differences.
4. Better Machine Utilization
Understanding actual machine usage helps organizations identify equipment that is underused or operating below expectations.
5. Faster Problem Identification
Real-time or near-real-time monitoring can make production interruptions visible sooner.
6. Improved Production Planning
Historical machine productivity data can support more realistic production planning and capacity decisions.
7. Data-Driven Continuous Improvement
Teams can establish performance baselines and measure whether improvement initiatives produce measurable changes.
How to Calculate Machine Productivity
The exact productivity formula depends on the manufacturing process.
A simple productivity measurement can be expressed as:
Machine Productivity = Actual Output ÷ Productive Operating Time
For example, if a machine produces 400 units during 8 hours of productive operation:
400 ÷ 8 = 50 units per hour
This metric can then be compared with:
Historical performance
Production targets
Standard cycle rates
Other comparable machines
However, production teams should be careful when comparing productivity figures because different products, materials, cycle requirements, and operating conditions can affect output.
Target vs. Actual Machine Productivity
One useful approach is comparing expected production with actual production.
Suppose:
Planned production = 1,000 units
Actual production = 900 units
The production gap is:
1,000 − 900 = 100 units
The important question is not simply why 100 units were missed, but what caused the gap.
Machine productivity monitoring can help break down the production loss into areas such as:
Downtime
Idle time
Slow cycles
Changeovers
Material shortages
Quality-related losses
This makes production analysis more actionable.
Using Machine Productivity Monitoring Across Shifts
Shift-level analysis is particularly useful in continuous manufacturing operations.
Managers can compare:
Output per shift
Runtime per shift
Downtime per shift
Average cycle time
Machine utilization
Production target achievement
However, shift comparisons should account for differences in products, orders, machine availability, staffing, maintenance schedules, and planned production requirements.
A lower output number does not automatically mean that a shift performed poorly if its production conditions were different.
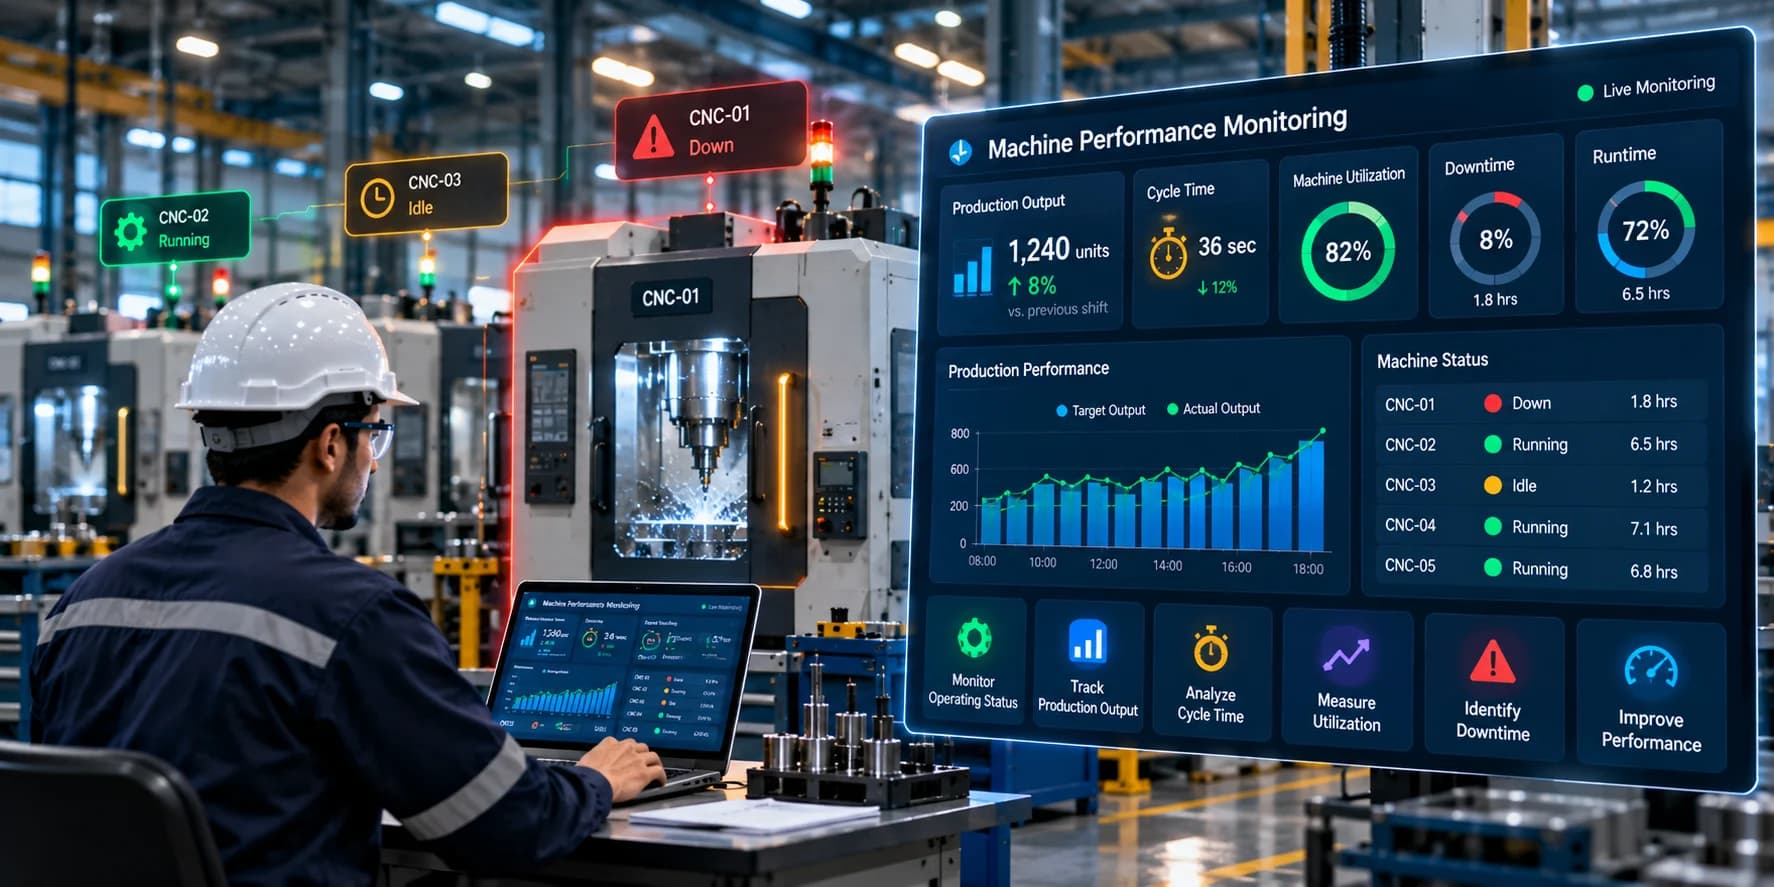
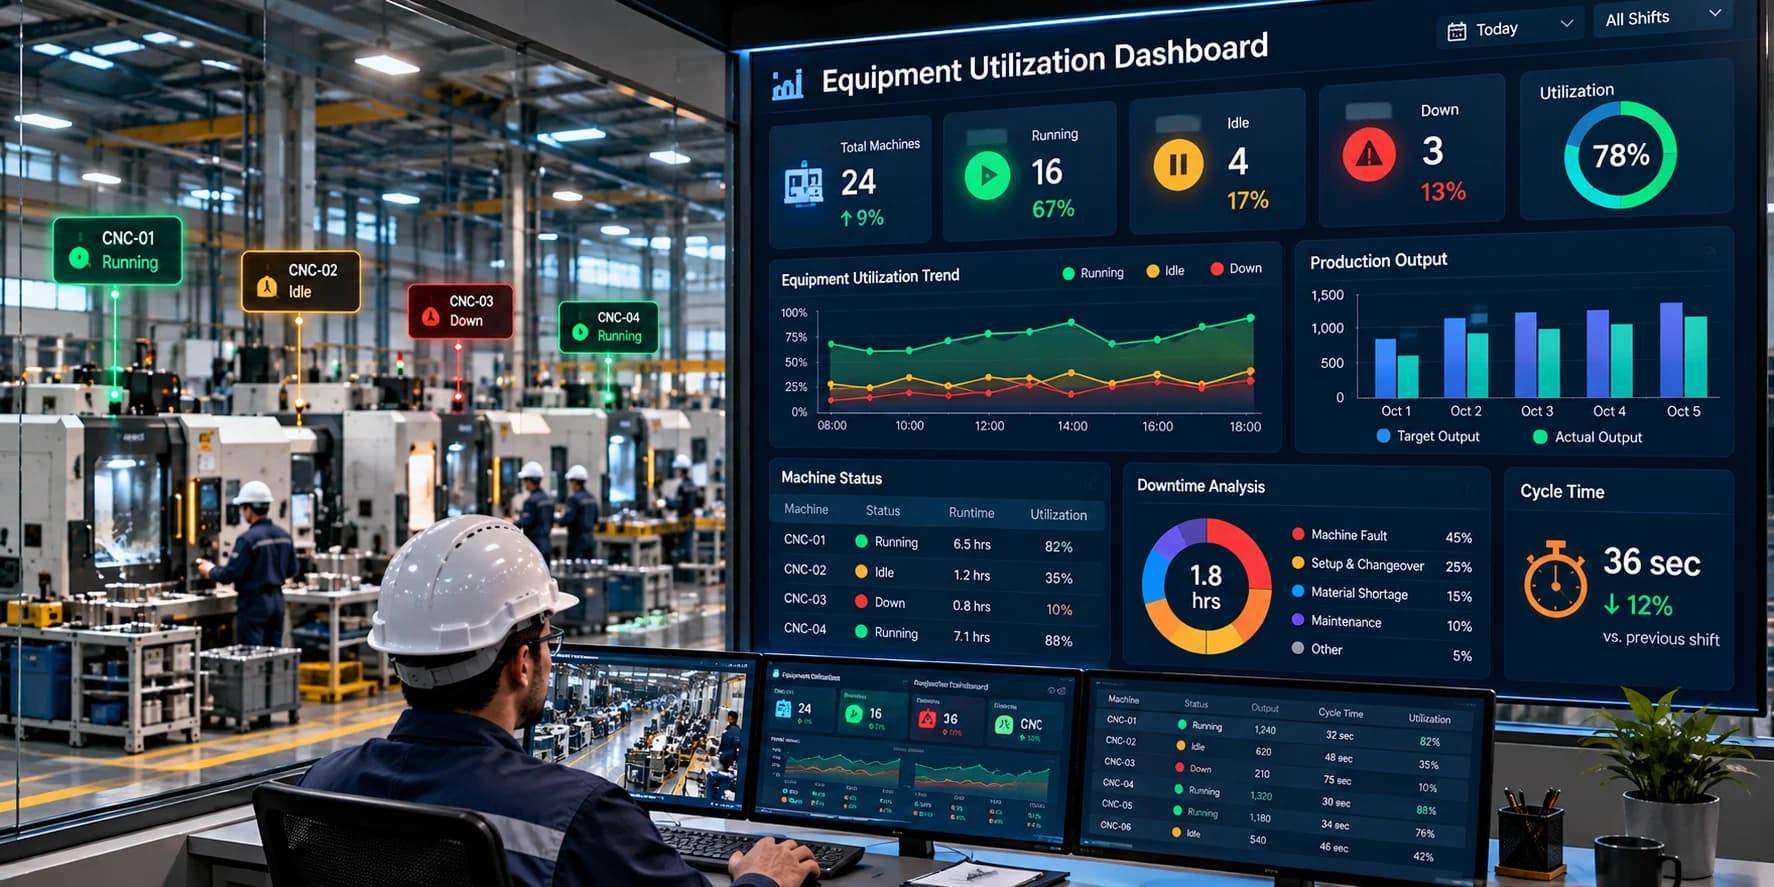
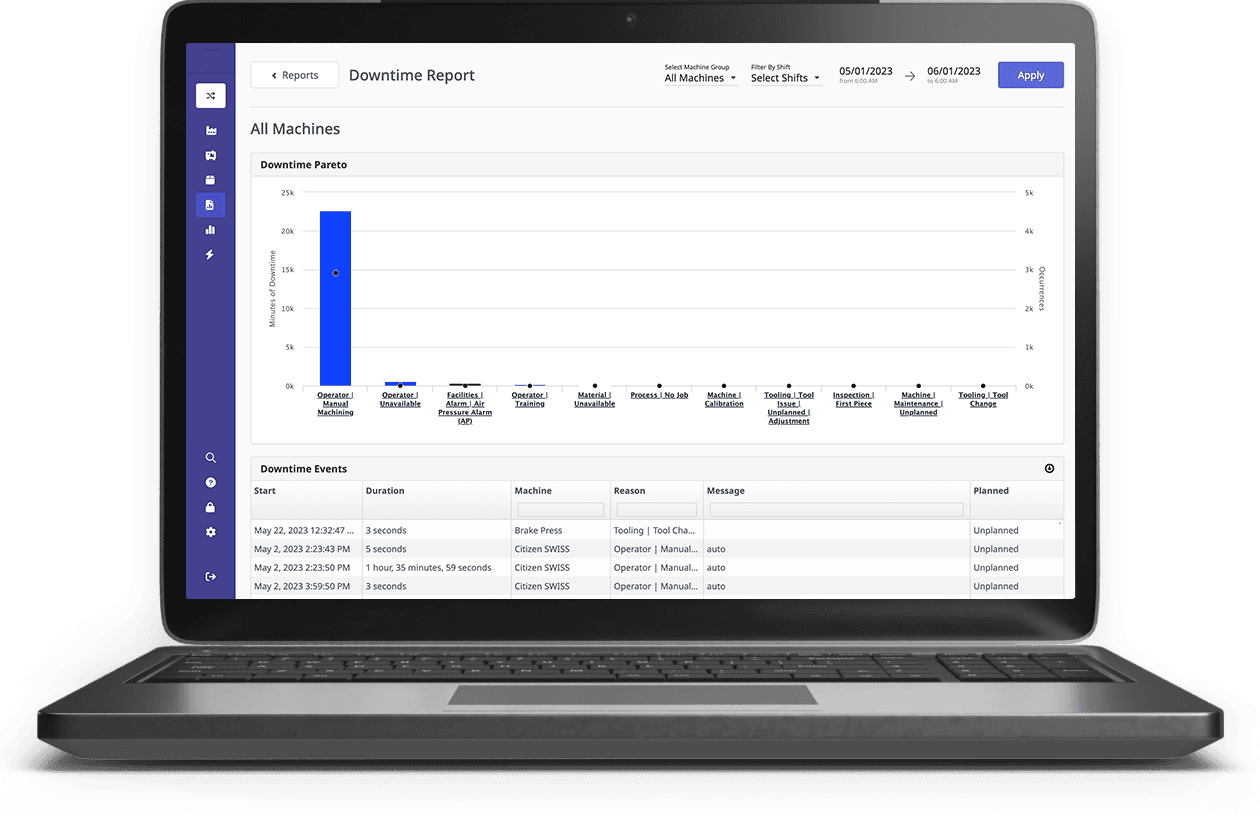
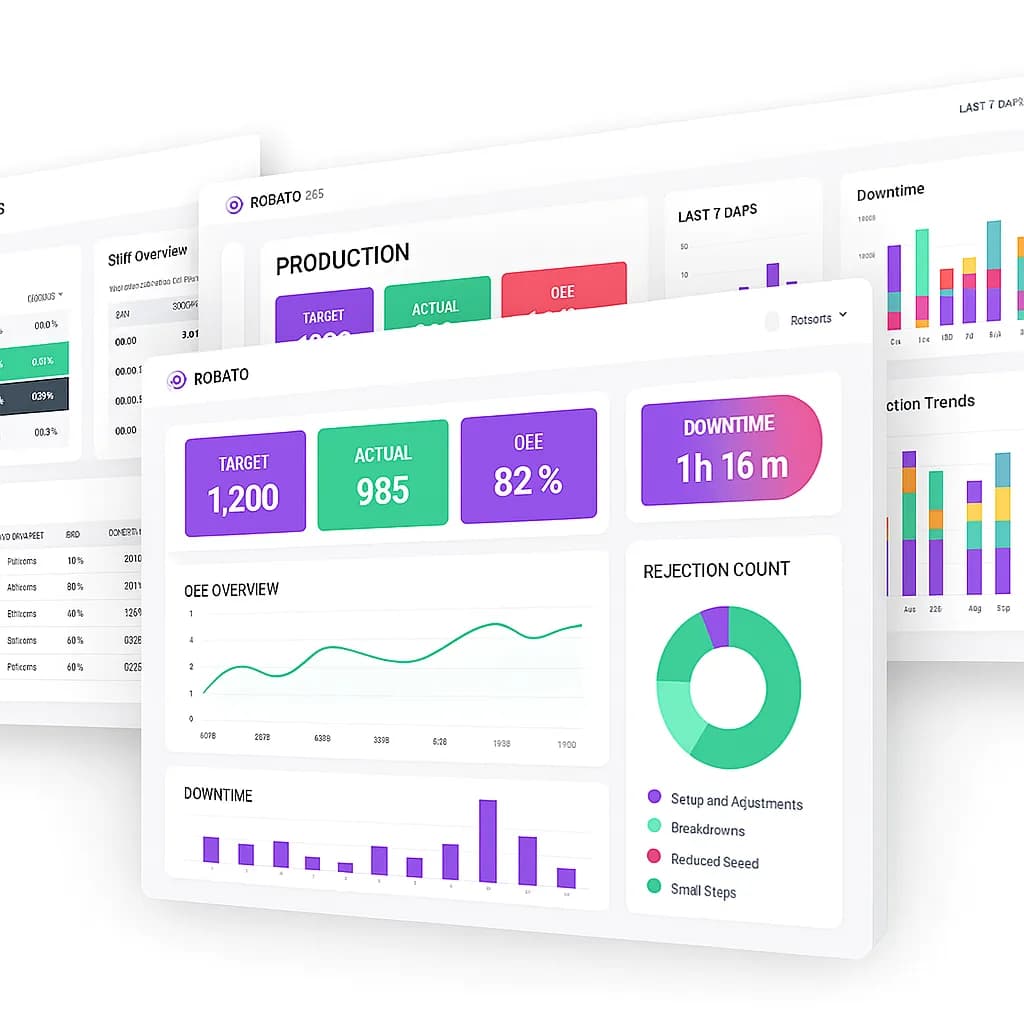
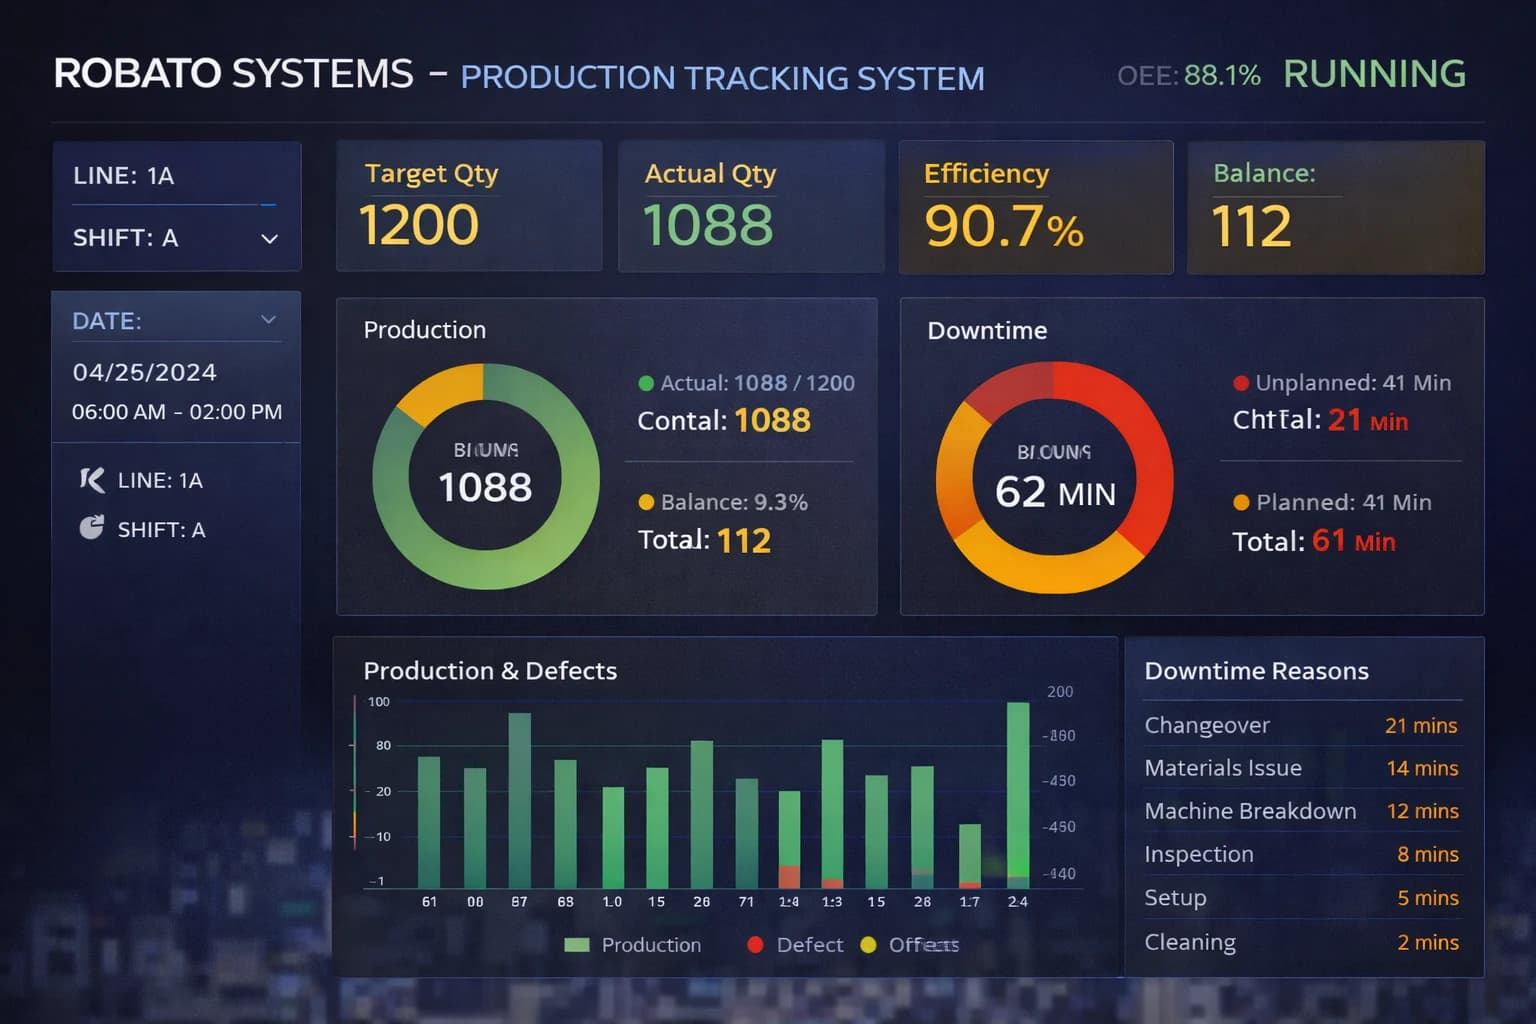
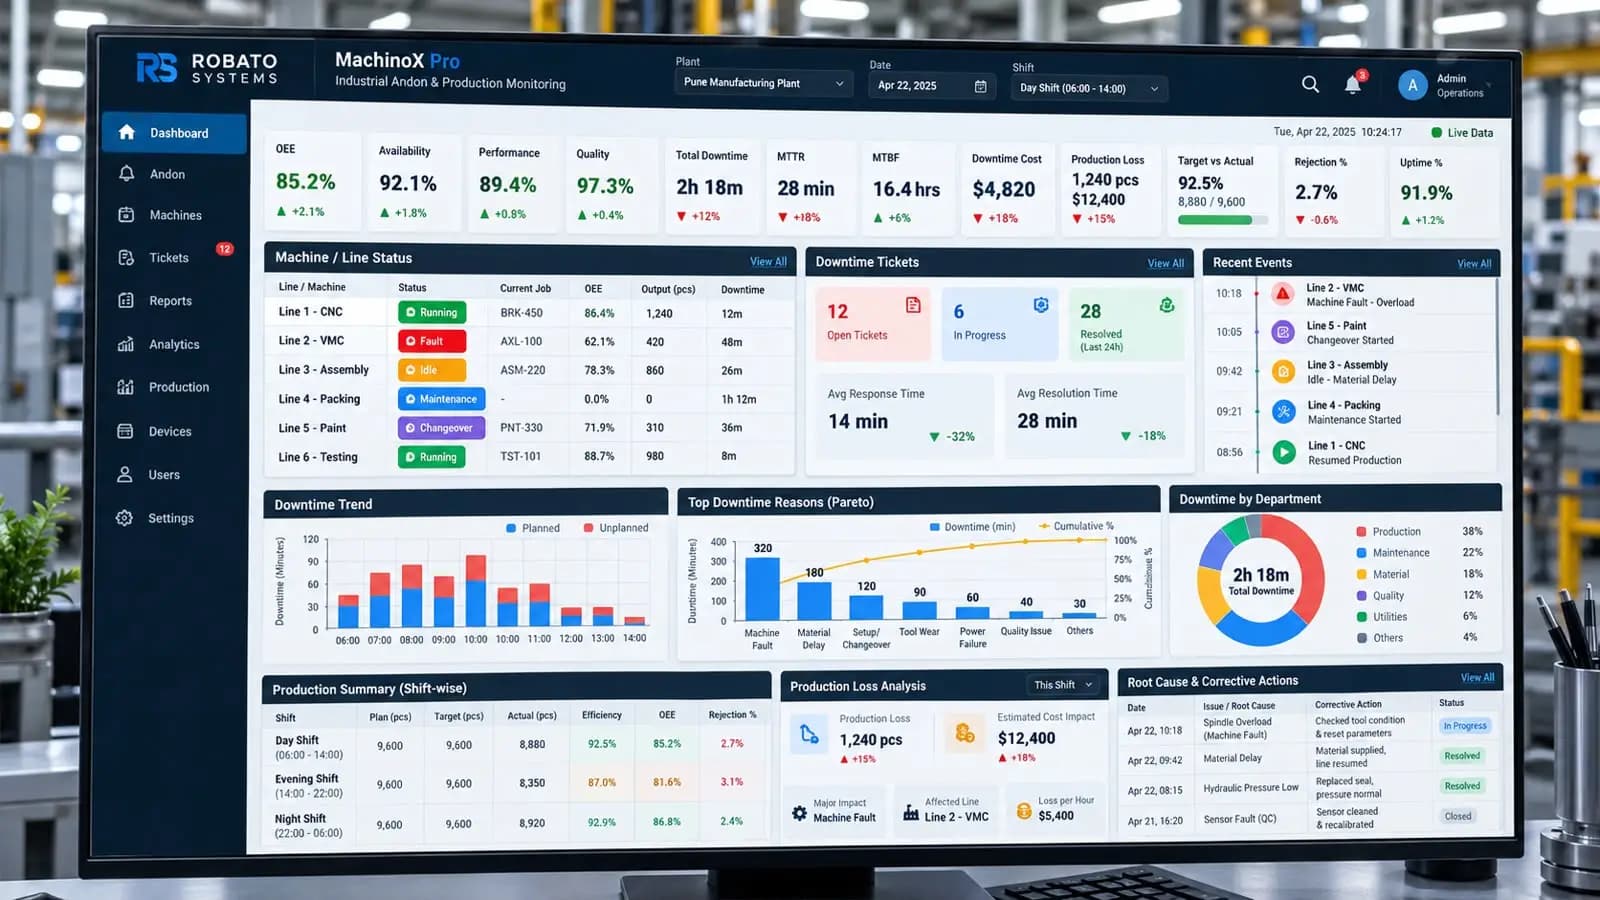
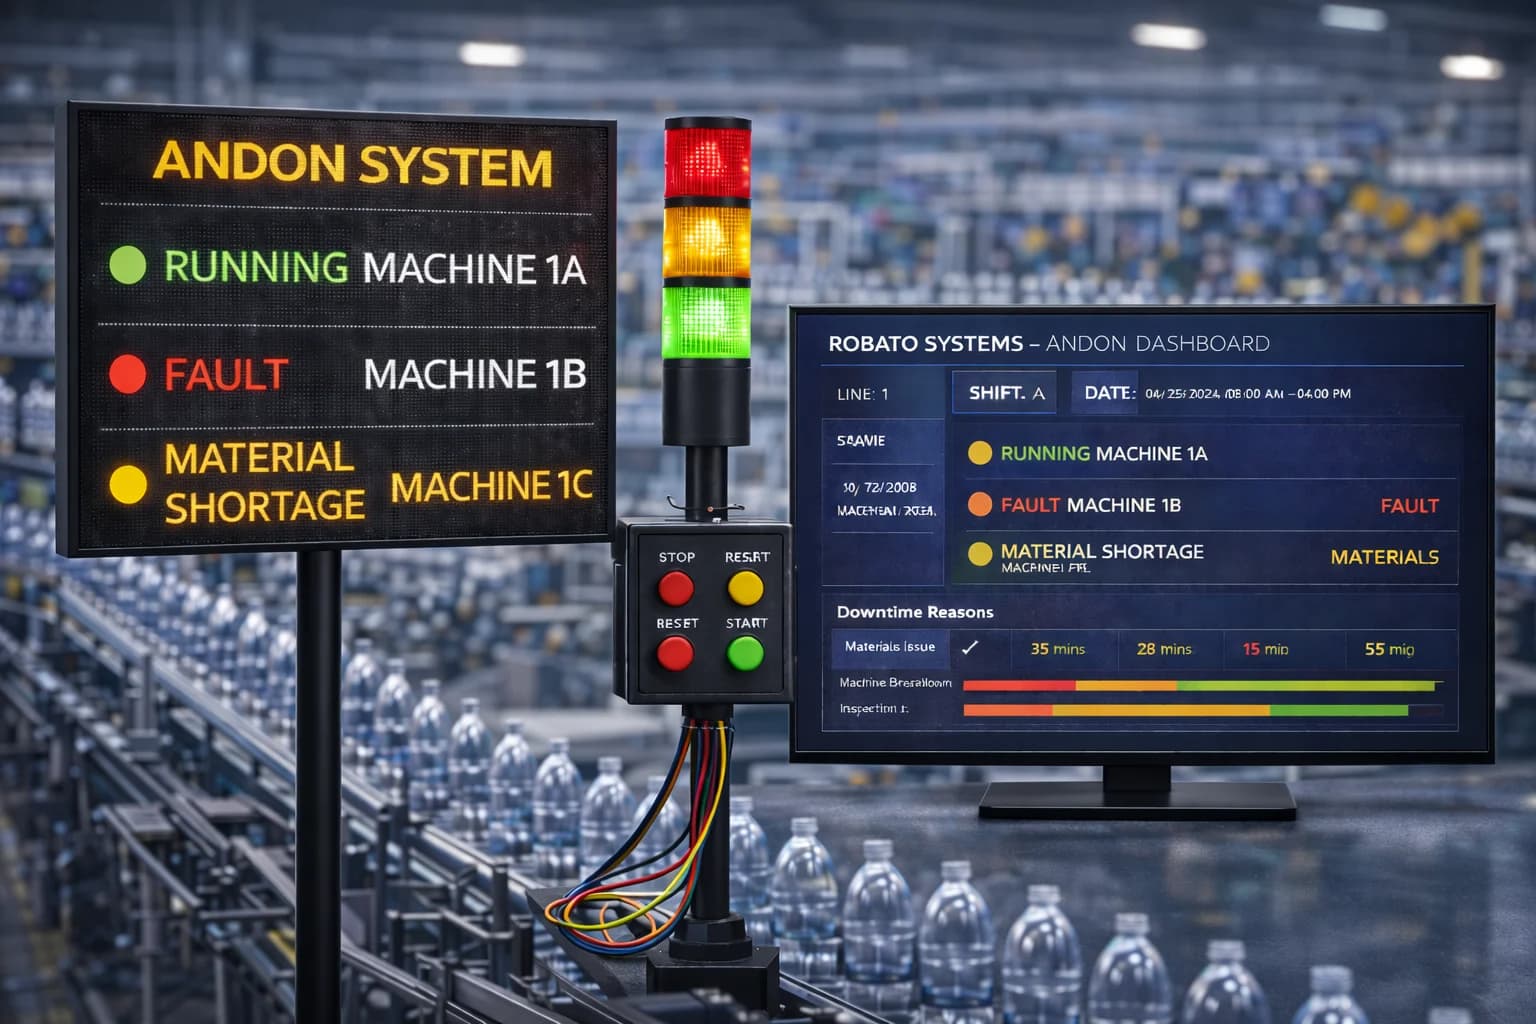
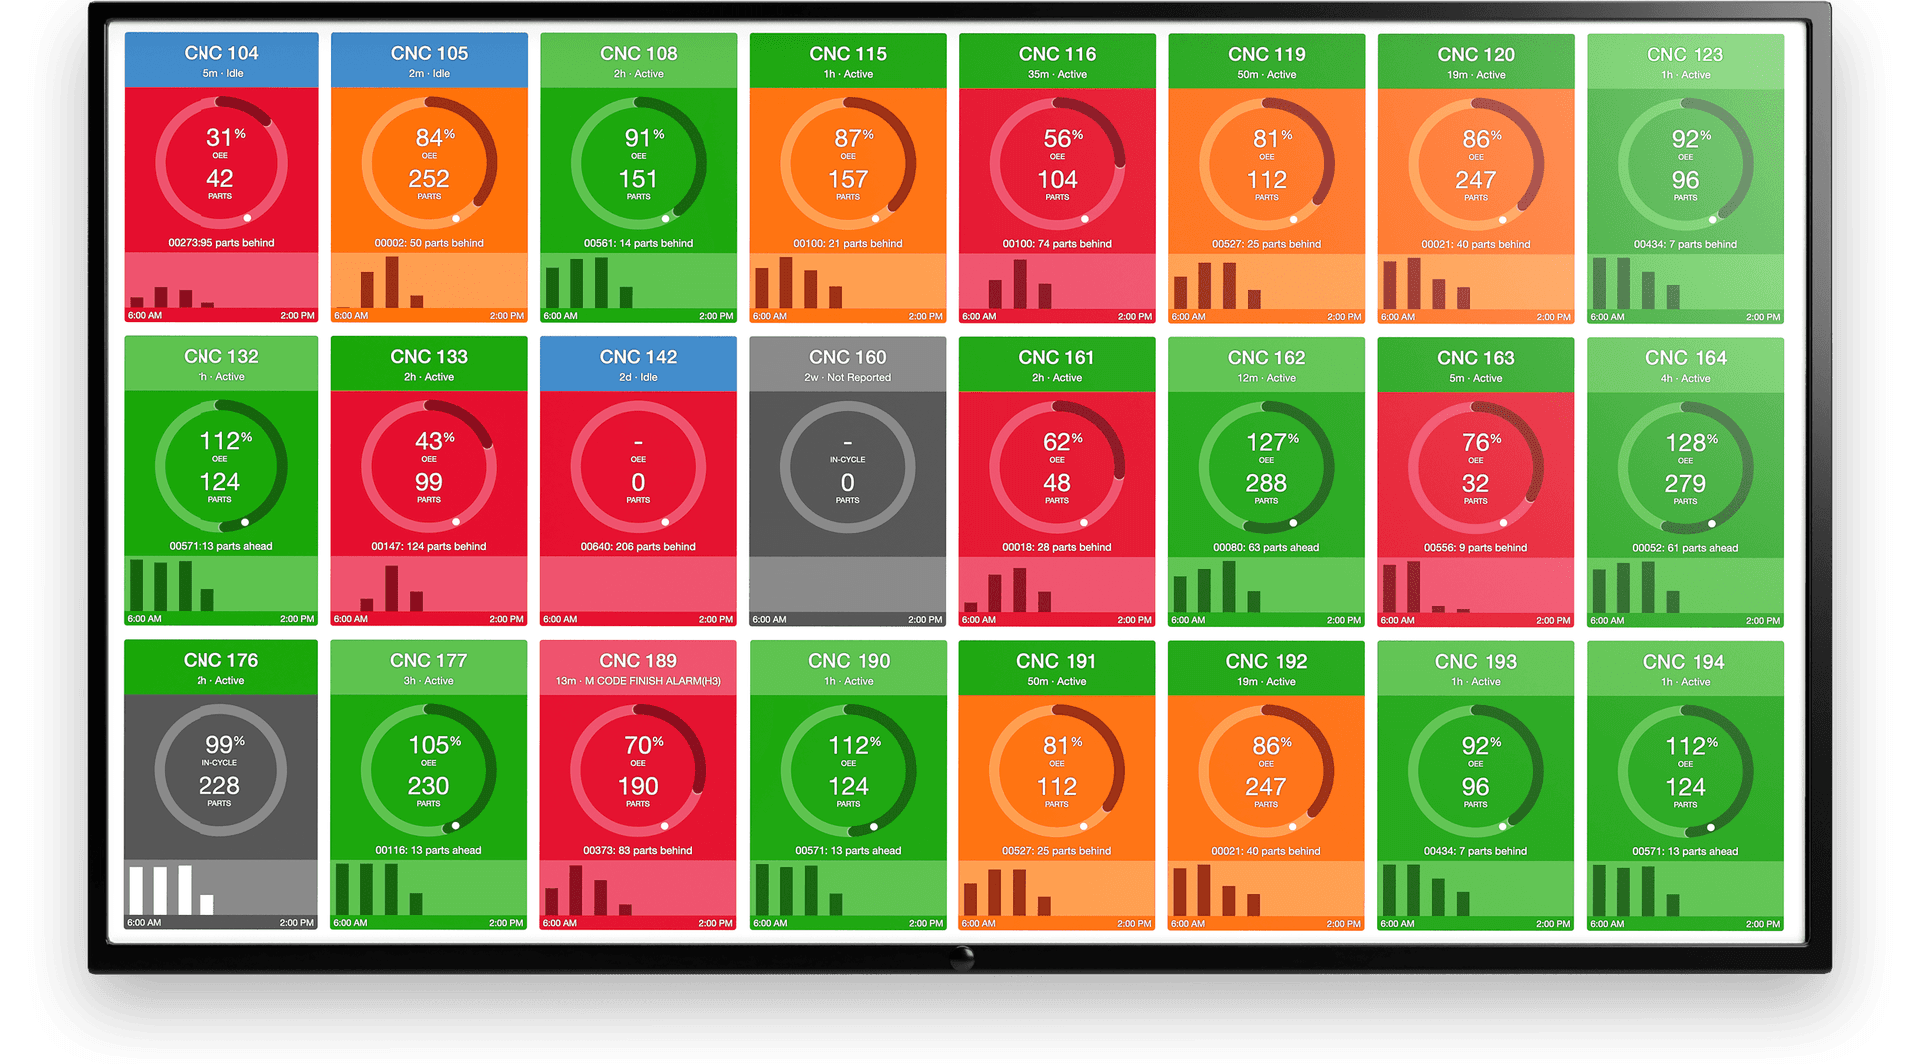
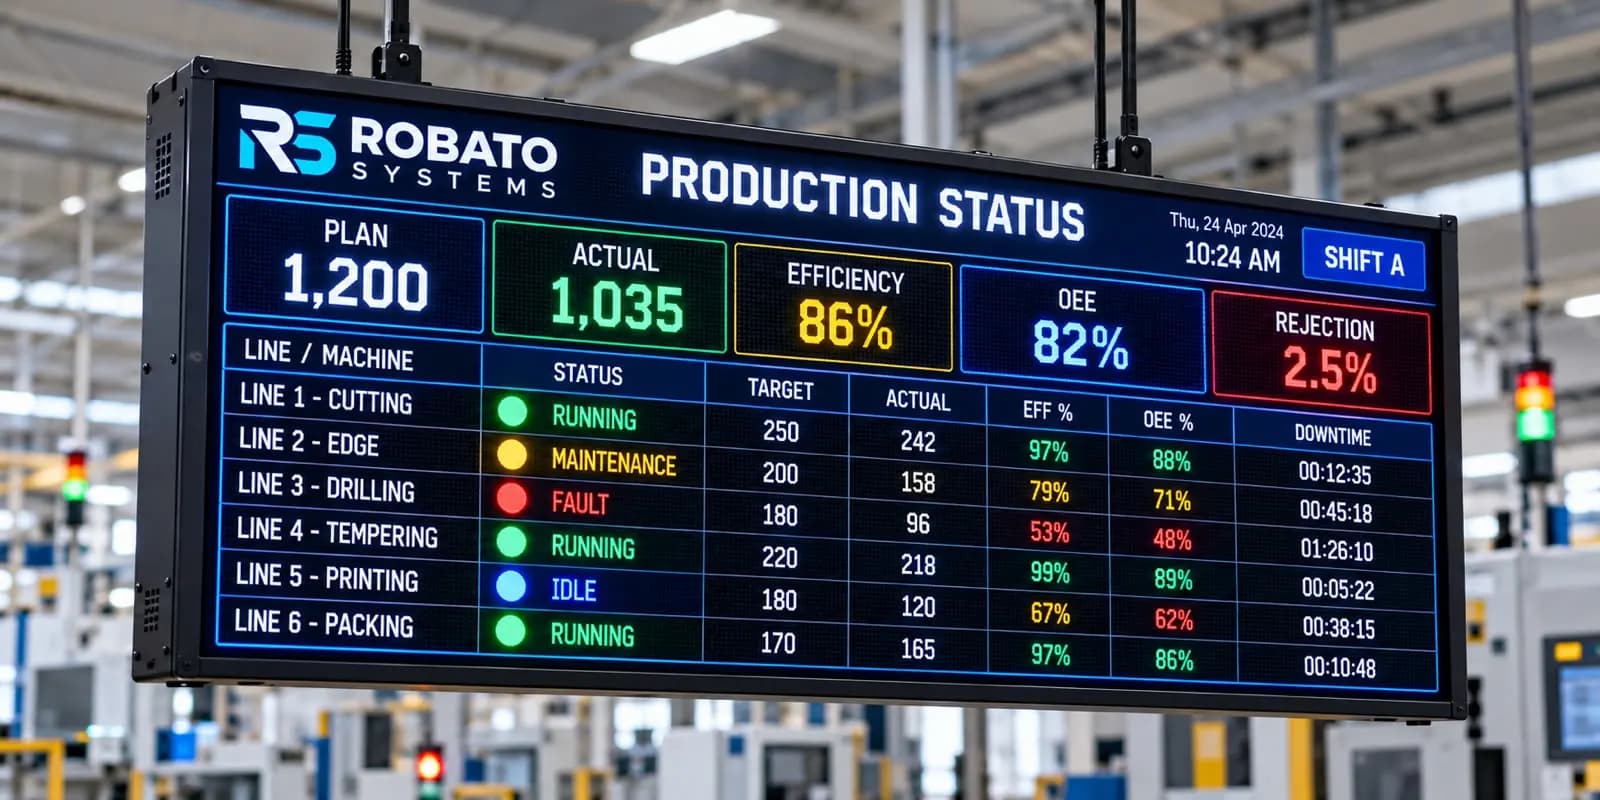
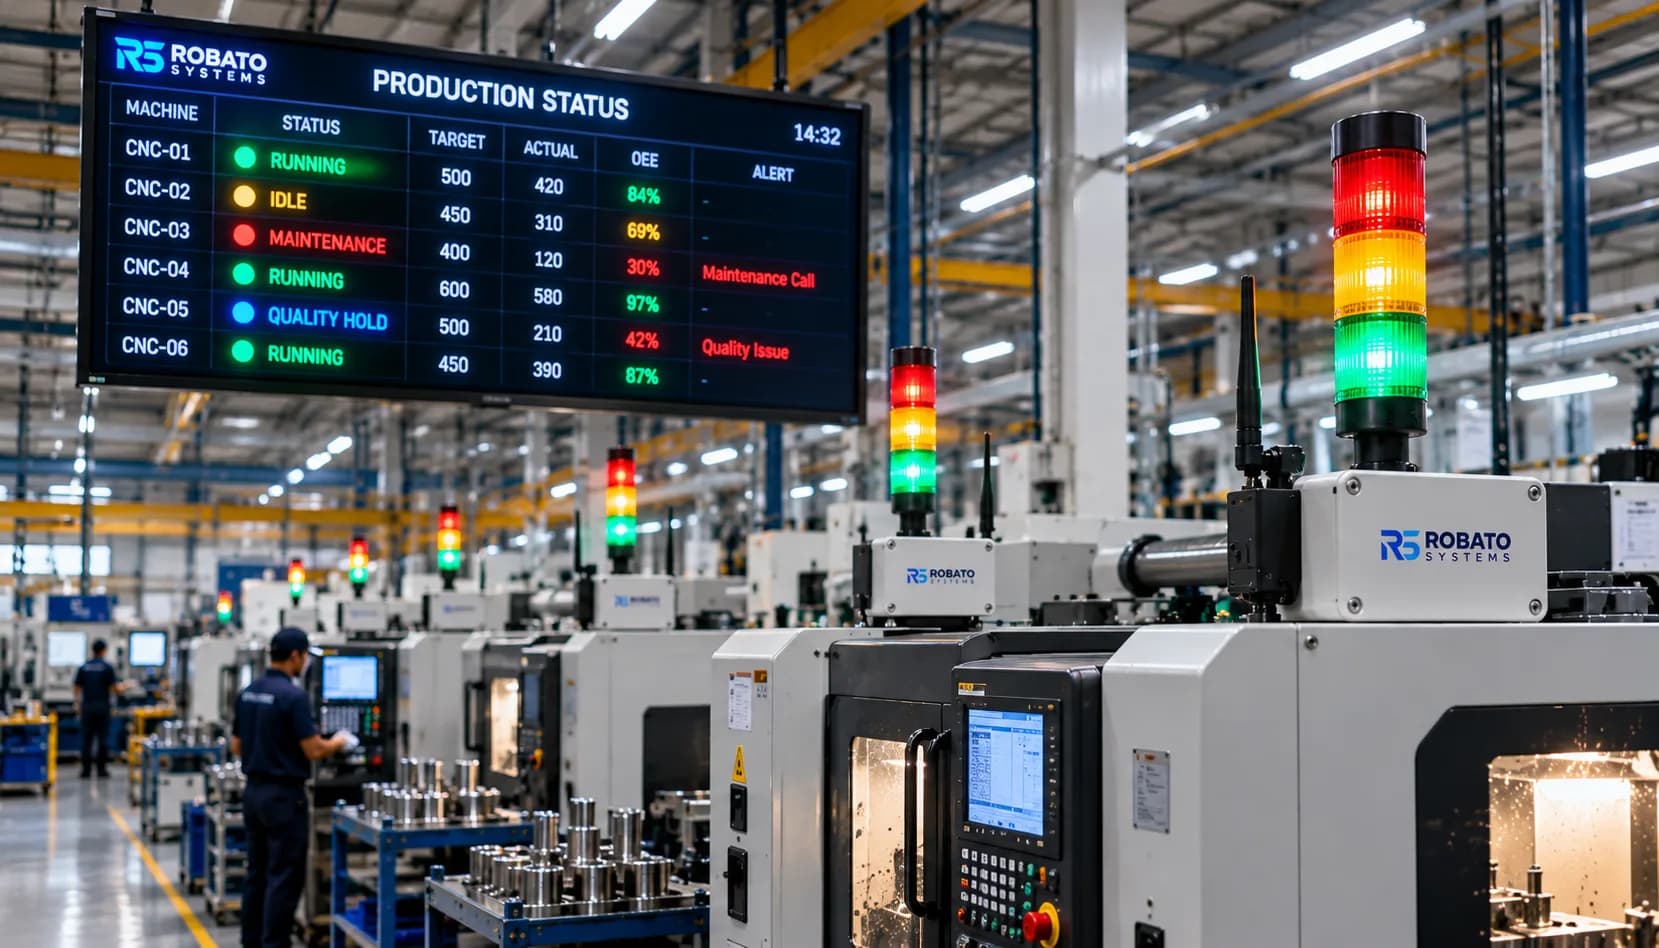
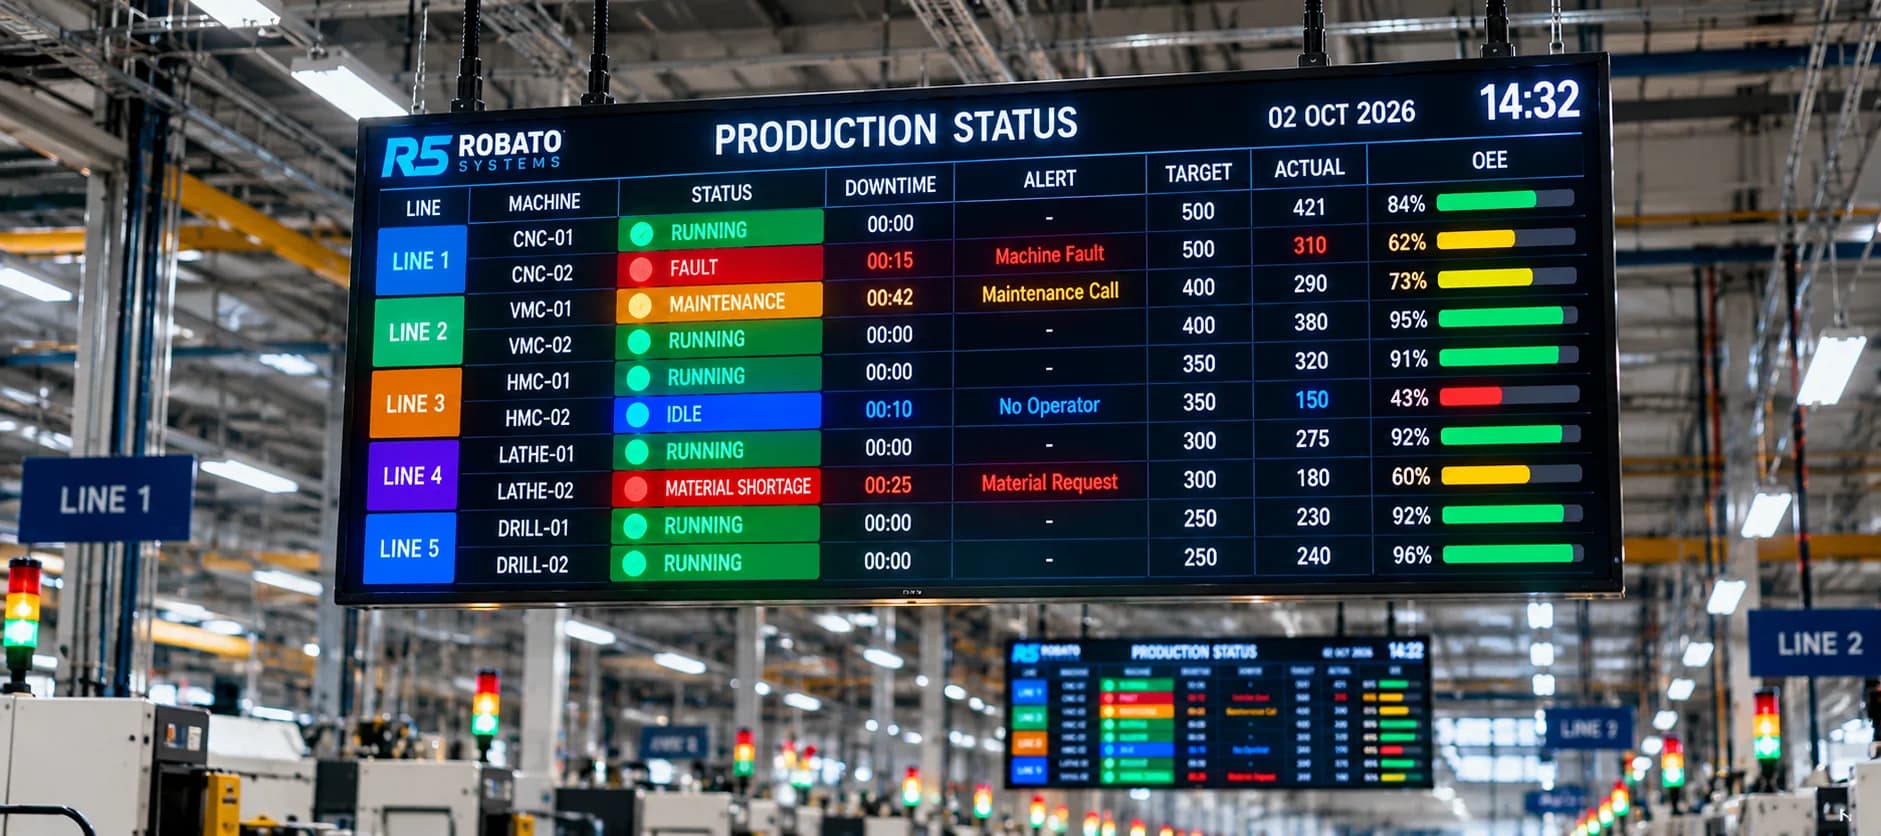
Machine Productivity Monitoring Dashboard
A useful dashboard should present the information required for operational decisions without overwhelming users.
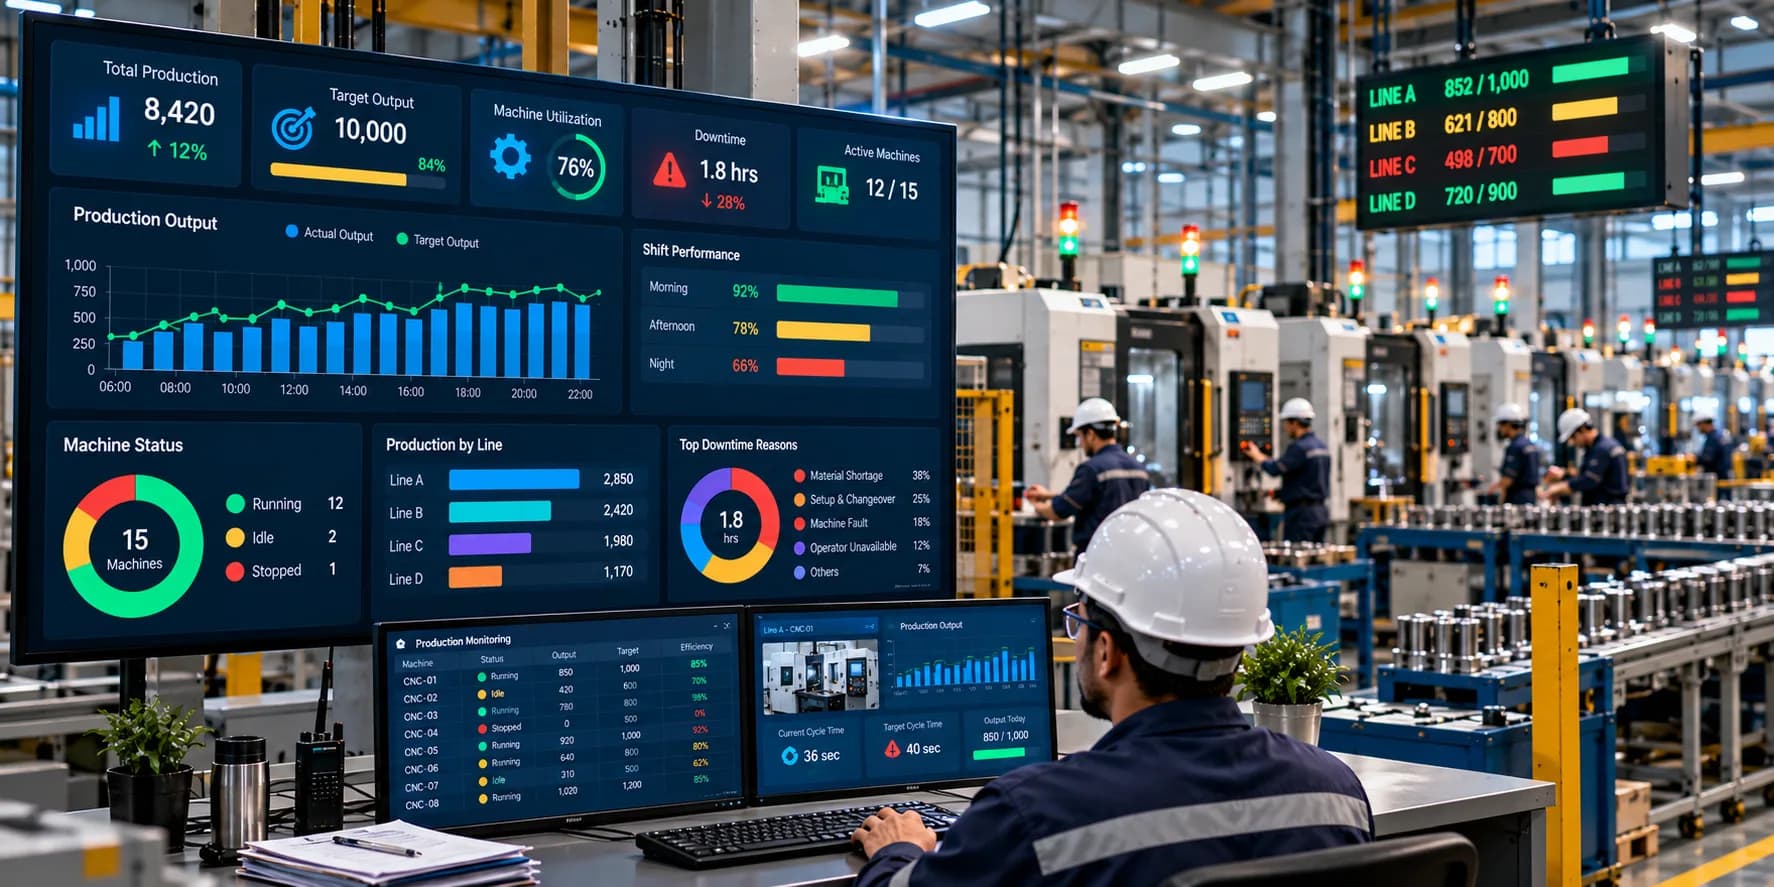
A production dashboard can include:
Machine Status
Current operating condition of each machine.
Production Output
Actual units produced during the selected period.
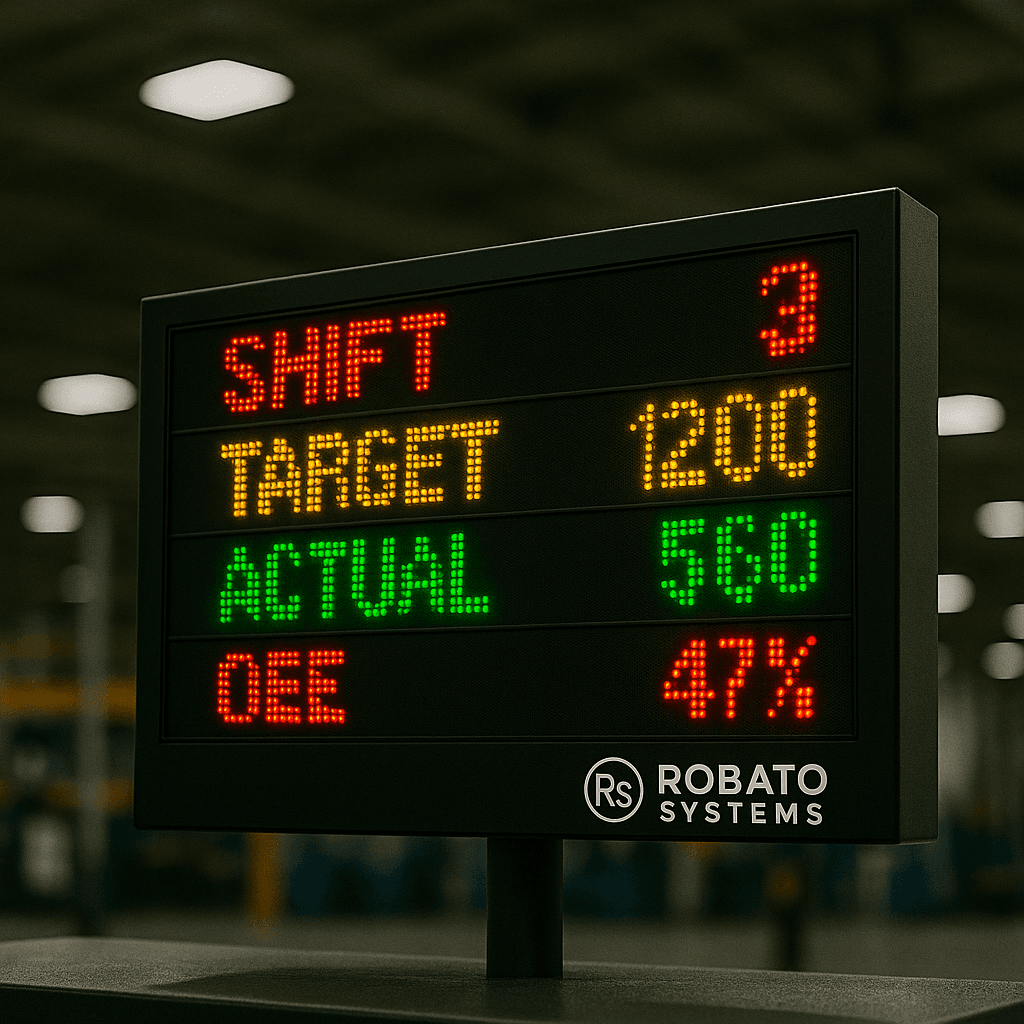
Target Achievement
Comparison between planned and actual production.
Runtime
Total machine operating time.
Downtime
Total stopped time and downtime trends.
Cycle Time
Actual cycle time compared with expected cycle time.
Productivity Trend
Productivity over hourly, shift, daily, or weekly periods.
Machine Comparison
Comparison of productivity across machines or production lines.
Alerts
Notifications for significant production interruptions or predefined productivity conditions.
How to Implement Machine Productivity Monitoring
Step 1: Define the Production Objective
Determine what you want to improve.
For example:
Increase output
Reduce downtime
Improve cycle performance
Identify underperforming machines
Improve shift productivity
Step 2: Define Production Standards
Establish realistic production targets and expected cycle times.
Targets should reflect the actual product and operating conditions.
Step 3: Identify Available Machine Data
Determine what information can be collected from existing PLCs, controllers, sensors, counters, or production systems.
Step 4: Establish Machine Connectivity
Connect machines to the monitoring platform using appropriate industrial communication methods.
Step 5: Configure Production Logic
Define how the software interprets machine states, production counts, cycles, and downtime.
Step 6: Build Productivity Dashboards
Create dashboards for operators, supervisors, production managers, and management.
Step 7: Establish Baselines
Collect historical information to determine normal productivity levels.
Step 8: Identify Loss Patterns
Look for recurring issues such as:
Repeated short stops
Slow cycles
Long changeovers
Extended idle periods
Frequent downtime
Step 9: Measure Improvement
After implementing corrective actions, compare new performance against the baseline.
Common Challenges
Inconsistent Production Data
Production counts may differ between machine counters, operator records, and ERP or MES systems.
Data sources should be validated before being used for performance decisions.
Different Products
Machines may produce different products with different cycle times.
Product-specific standards may therefore be required.
Legacy Equipment
Older machines may require additional sensors or connectivity hardware.
Data Interpretation
Machine signals do not automatically explain why a machine stopped.
Additional reason codes, operator inputs, or system integrations may be necessary.
Too Many Metrics
Tracking every available data point can make dashboards difficult to use.
Focus on metrics that support actual production decisions.
Best Practices for Machine Productivity Monitoring
Set Product-Specific Targets
Different products may require different production rates and cycle times.
Separate Planned and Unplanned Downtime
This provides a more accurate view of production losses.
Monitor Short Stops
Small interruptions can accumulate into significant productivity losses.
Combine Output With Machine Time
Production output should be evaluated alongside runtime, downtime, and cycle time.
Use Consistent Definitions
Ensure that production, runtime, downtime, idle time, and other metrics have consistent definitions across the factory.
Review Trends Instead of Isolated Numbers
A single low-output shift may not indicate a long-term issue.
Look for recurring patterns.
Connect Monitoring With Improvement Actions
Monitoring should lead to investigation and action rather than simply generating more reports.
Machine Productivity Monitoring and OEE
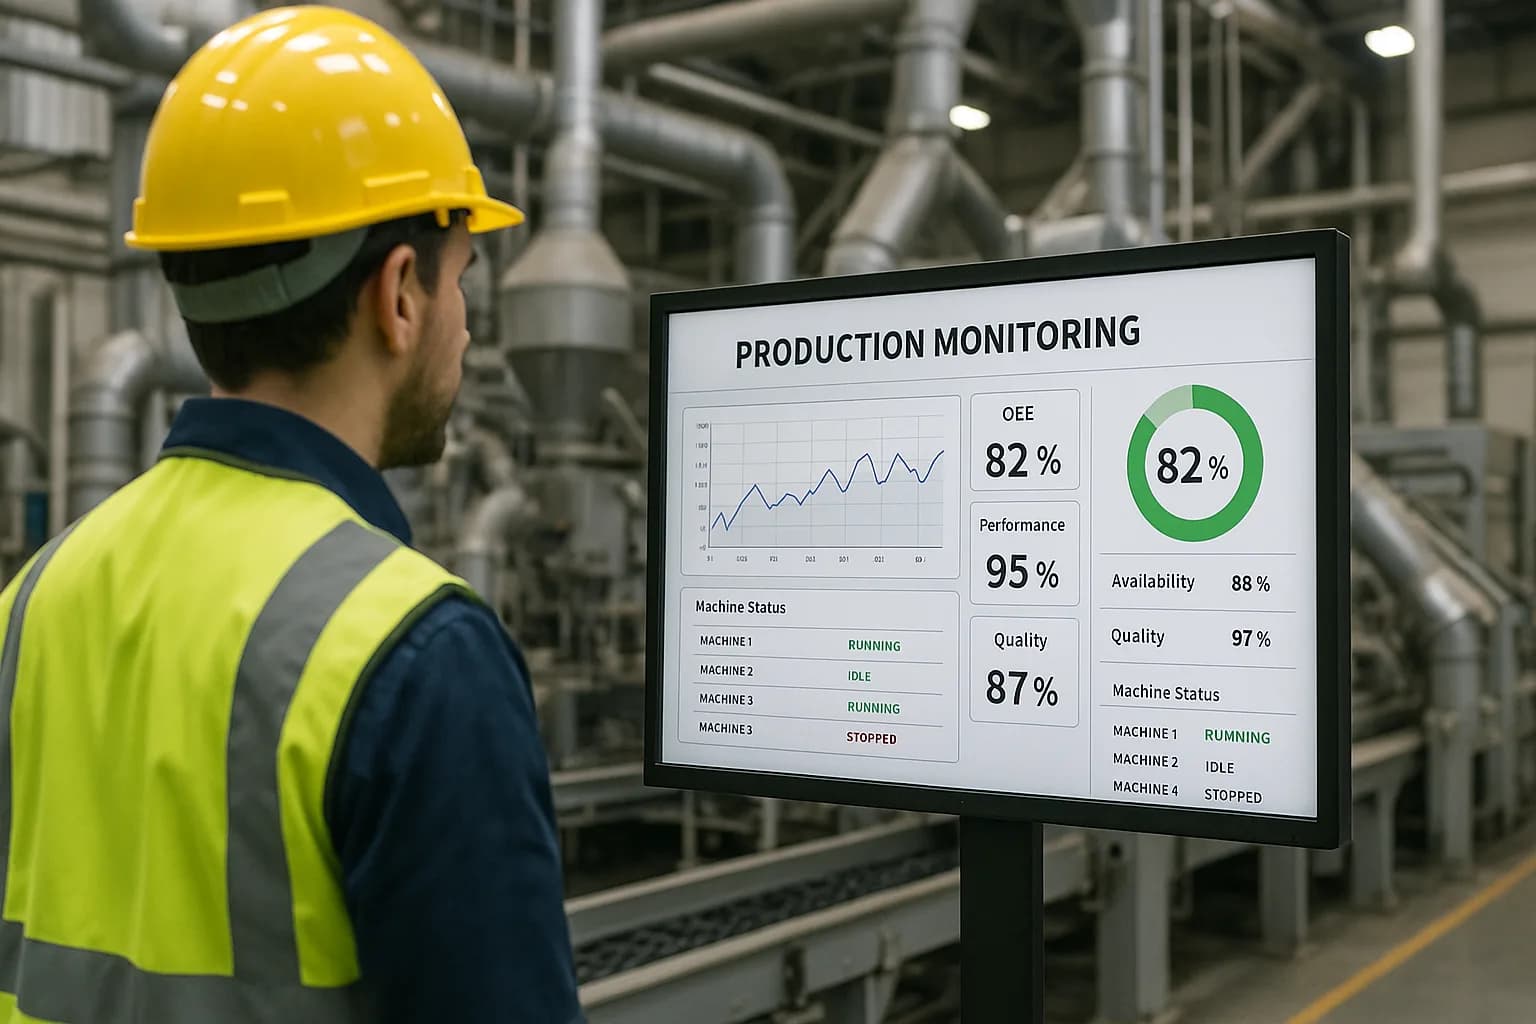
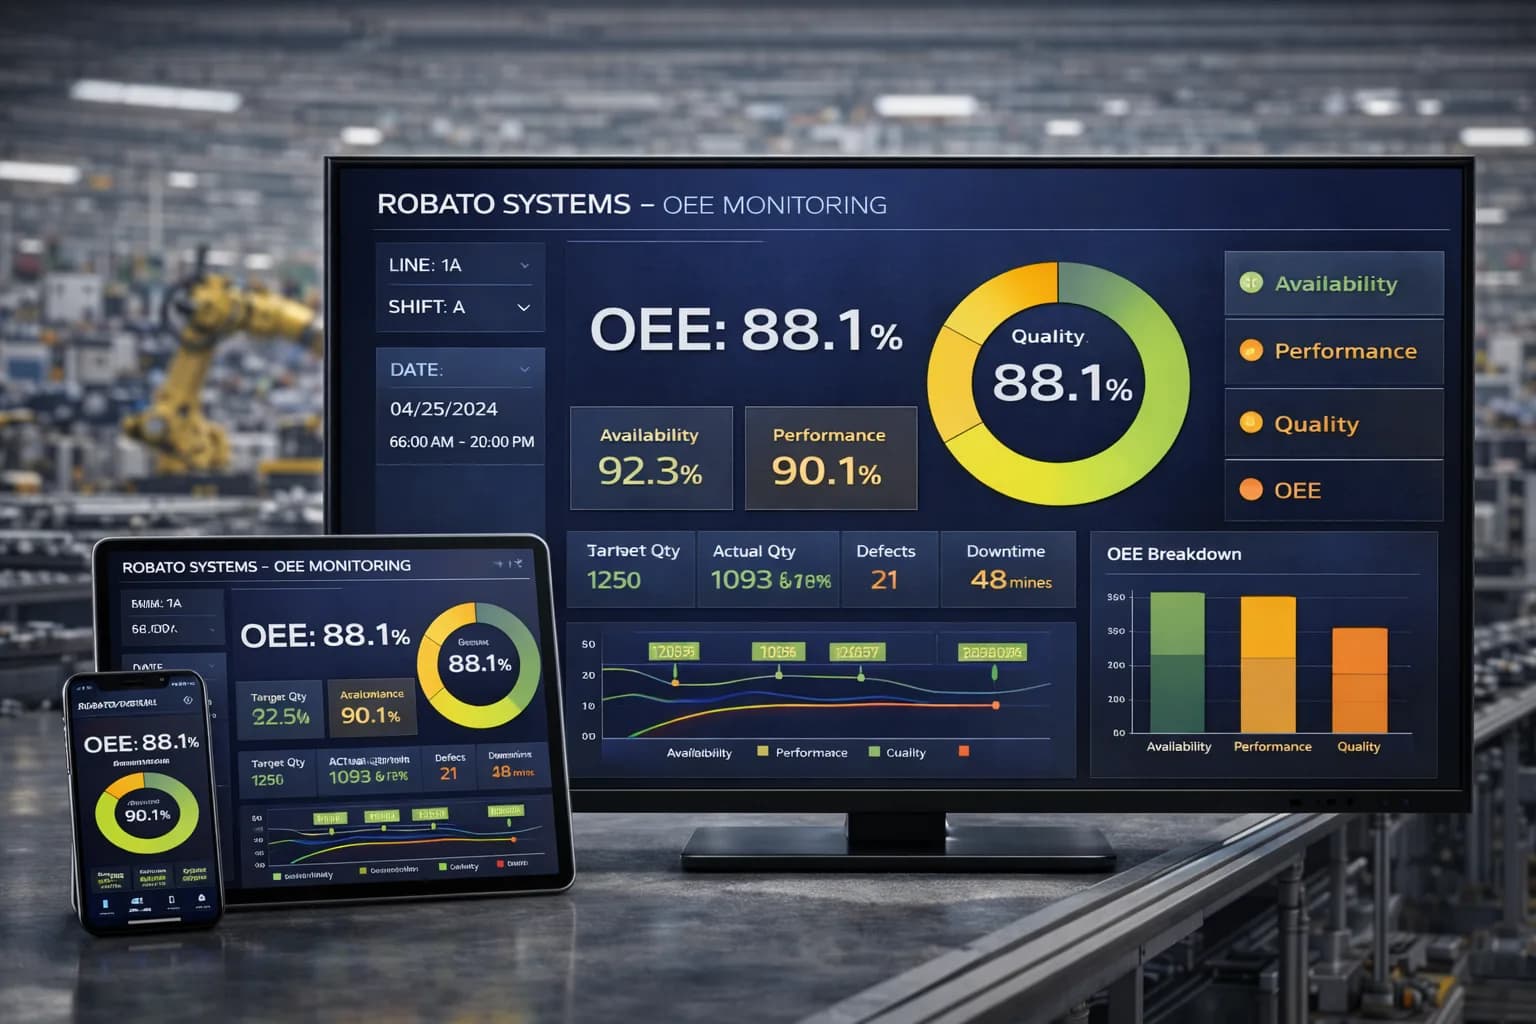
Overall Equipment Effectiveness, commonly known as OEE, combines three major dimensions of equipment performance:
Availability
Performance
Quality
Machine productivity monitoring can provide some of the underlying operational data required to calculate and understand OEE.
For example:
Runtime and downtime contribute to availability analysis.
Cycle time and production rate support performance analysis.
Production and reject information support quality analysis.
However, machine productivity monitoring and OEE should not be treated as identical concepts. Productivity monitoring can be broader or more specific depending on the metrics and objectives used by the organization.
Machine Productivity Monitoring and Industry 4.0
Connected machine monitoring is an important component of modern digital manufacturing.
Industry 4.0 environments increasingly connect machines, sensors, production systems, analytics platforms, and business applications.
Machine productivity data can become part of this connected environment and support:
Industrial IoT
Production analytics
Digital dashboards
Automated reporting
Predictive maintenance initiatives
Capacity planning
Manufacturing intelligence
The value comes from connecting reliable machine data with processes that can act on it.
Frequently Asked Questions
What is machine productivity monitoring?
Machine productivity monitoring is the process of tracking machine output, operating time, cycle performance, downtime, and other production indicators to understand how effectively equipment is producing.
What is the main purpose of machine productivity monitoring?
Its primary purpose is to provide visibility into machine-level production performance and help identify factors that reduce expected output.
How is machine productivity measured?
A simple measurement is actual production output divided by productive operating time. More detailed measurements can include target achievement, cycle time, utilization, downtime, and production rate.
Can machine productivity monitoring work with existing machines?
Yes. Depending on the equipment, data can be collected through PLCs, controllers, sensors, industrial gateways, counters, or other interfaces. Older machines may require additional hardware.
What is the difference between machine productivity and machine utilization?
Productivity focuses more directly on output relative to operating resources or time, while utilization focuses on how much available machine capacity is being used.
Can productivity monitoring identify the reason for low production?
It can provide evidence about when and where productivity losses occurred. Identifying the exact root cause may require additional data, operator input, maintenance information, or process analysis.
Is real-time monitoring necessary?
Not always. Real-time monitoring is useful for immediate operational response, while historical monitoring is valuable for trend analysis and continuous improvement.
Can machine productivity monitoring support multiple factories?
Yes. A scalable monitoring platform can consolidate information from multiple production lines, facilities, or plants when appropriate connectivity and system architecture are available.
Conclusion
Machine Productivity Monitoring gives manufacturers a measurable way to understand how effectively production equipment is converting available operating time into output.
By tracking production quantities, machine runtime, downtime, cycle time, utilization, and target performance, production teams can identify where productivity is being lost and investigate the operational conditions behind those losses.
The most useful monitoring systems do not focus on generating large volumes of data. They focus on delivering reliable, understandable information that production teams can turn into action.
When machine productivity data becomes part of the daily production review process, manufacturers can establish performance baselines, identify recurring losses, measure improvement initiatives, and make better-informed decisions about production capacity and equipment utilization.