Manufacturing plants generate a large amount of information every day. Machines produce products, operators manage production activities, maintenance teams handle machine problems, and quality teams monitor defects and rejected products.
The challenge for manufacturers is not only collecting this information. The real challenge is understanding production performance quickly and using that information to make better decisions.
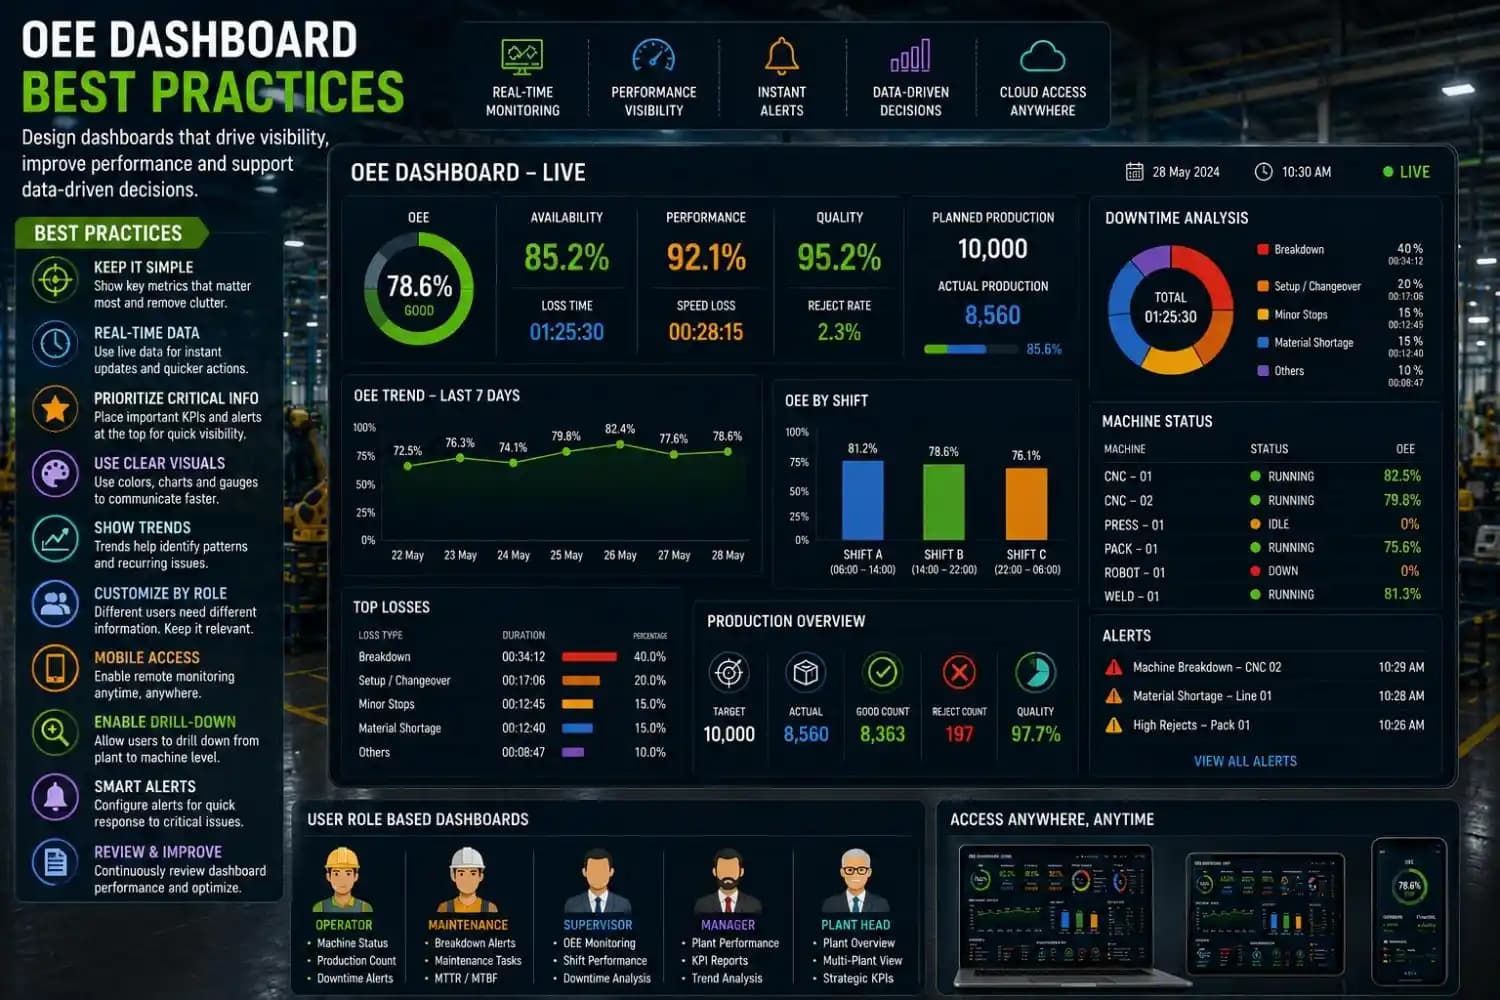
A Manufacturing KPI Dashboard helps solve this problem by bringing important production information into one place.
Instead of depending on manual reports and spreadsheets, production teams can use a dashboard to monitor production output, machine performance, downtime, quality, and other important manufacturing metrics.
For modern factories, a Manufacturing KPI Dashboard can become an important part of production monitoring and Industry 4.0 initiatives.
What is a Manufacturing KPI Dashboard?
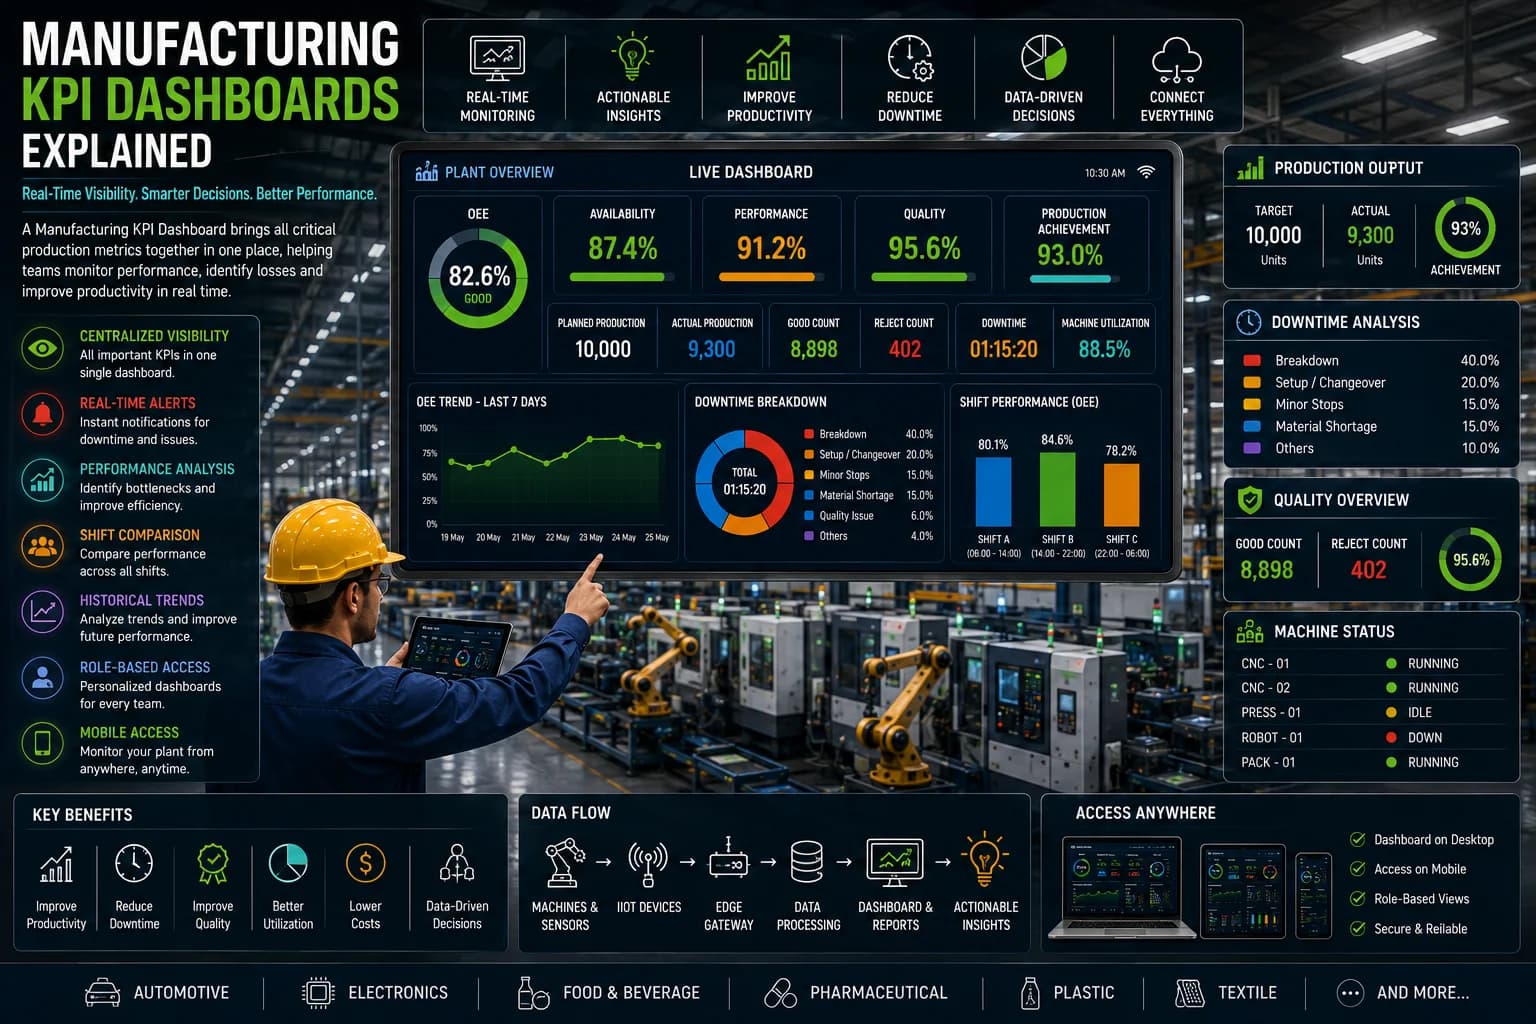
A Manufacturing KPI Dashboard is a digital interface that displays important Key Performance Indicators related to manufacturing operations.
It can collect information from machines, PLCs, sensors, production counters, Industrial IoT devices, and manufacturing software.
The collected information is presented in a simple format so that production teams can quickly understand what is happening on the shop floor.
Common manufacturing KPIs include:
- OEE
- Production output
- Machine utilization
- Downtime
- Quality
- Production efficiency
- Cycle time
- Rejection rate
- Target production
- Actual production
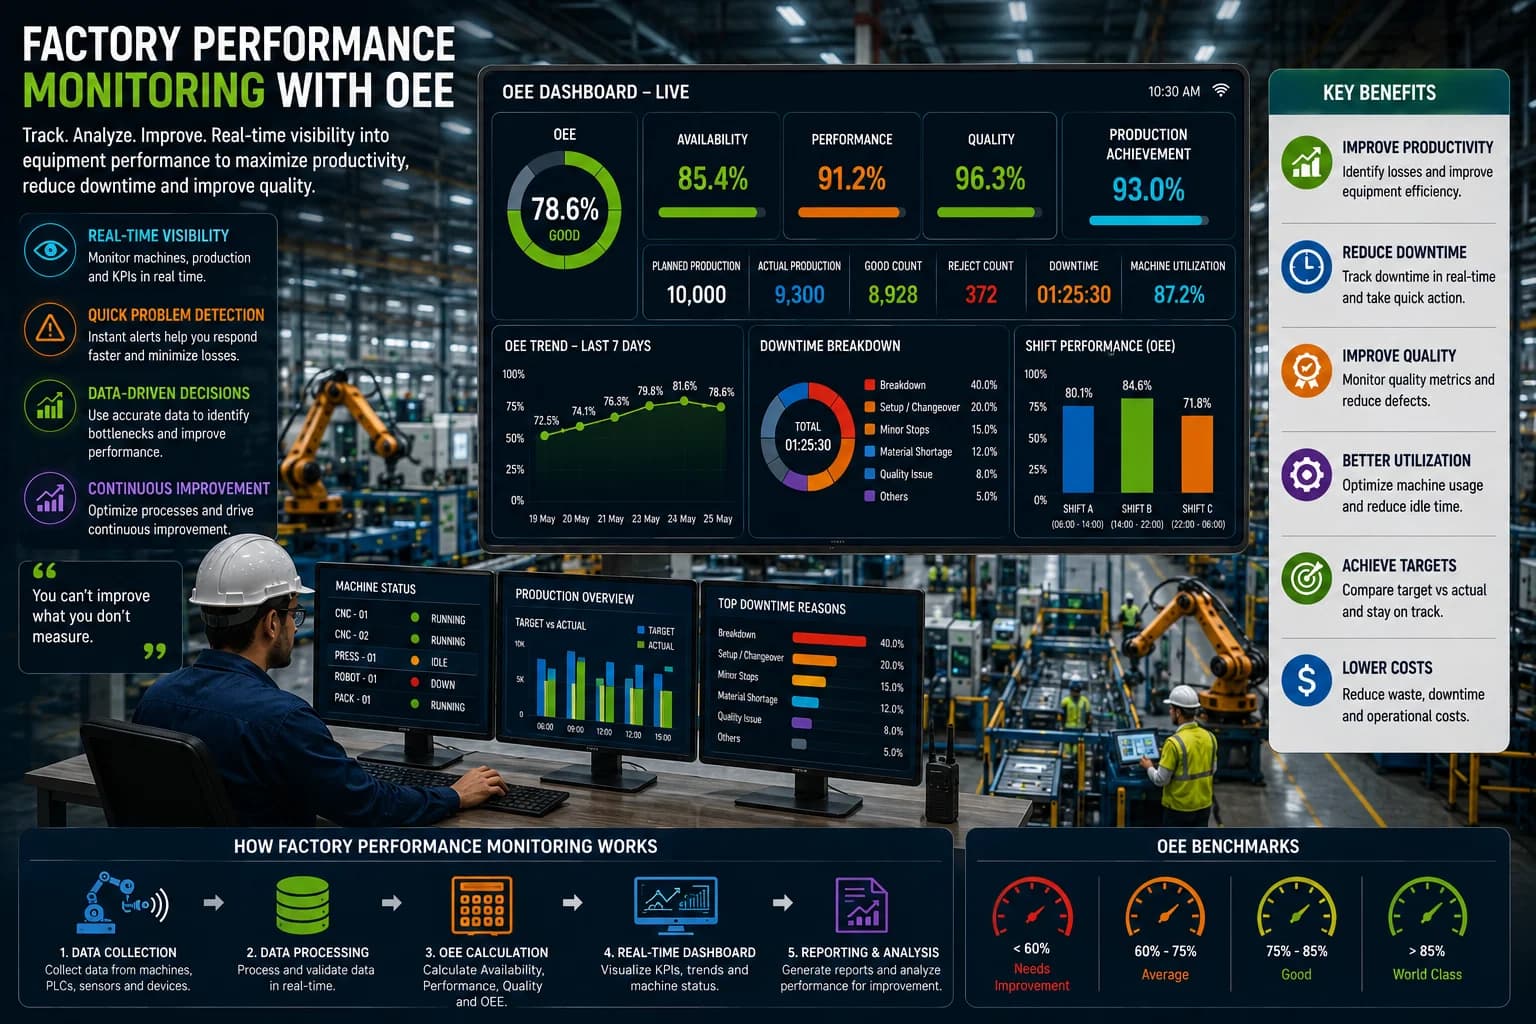
The main purpose of a Manufacturing KPI Dashboard is to provide clear production visibility and help teams identify areas that need attention.
Why Manufacturing KPI Dashboards are Important
Traditional manufacturing reporting often depends on manual data collection.
Operators may record production information on paper or spreadsheets, and supervisors may review the information later.
This can create a delay between a production problem and the management response.
A real-time dashboard provides production information while manufacturing is taking place.
Production teams can identify:
- Machine downtime
- Production delays
- Low machine utilization
- Production target gaps
- Quality problems
- Performance losses
- Repeated production issues
This allows teams to respond faster and reduce the impact of production problems.
Important Manufacturing KPIs
Different factories have different production requirements. However, several KPIs are commonly used to understand manufacturing performance.
OEE
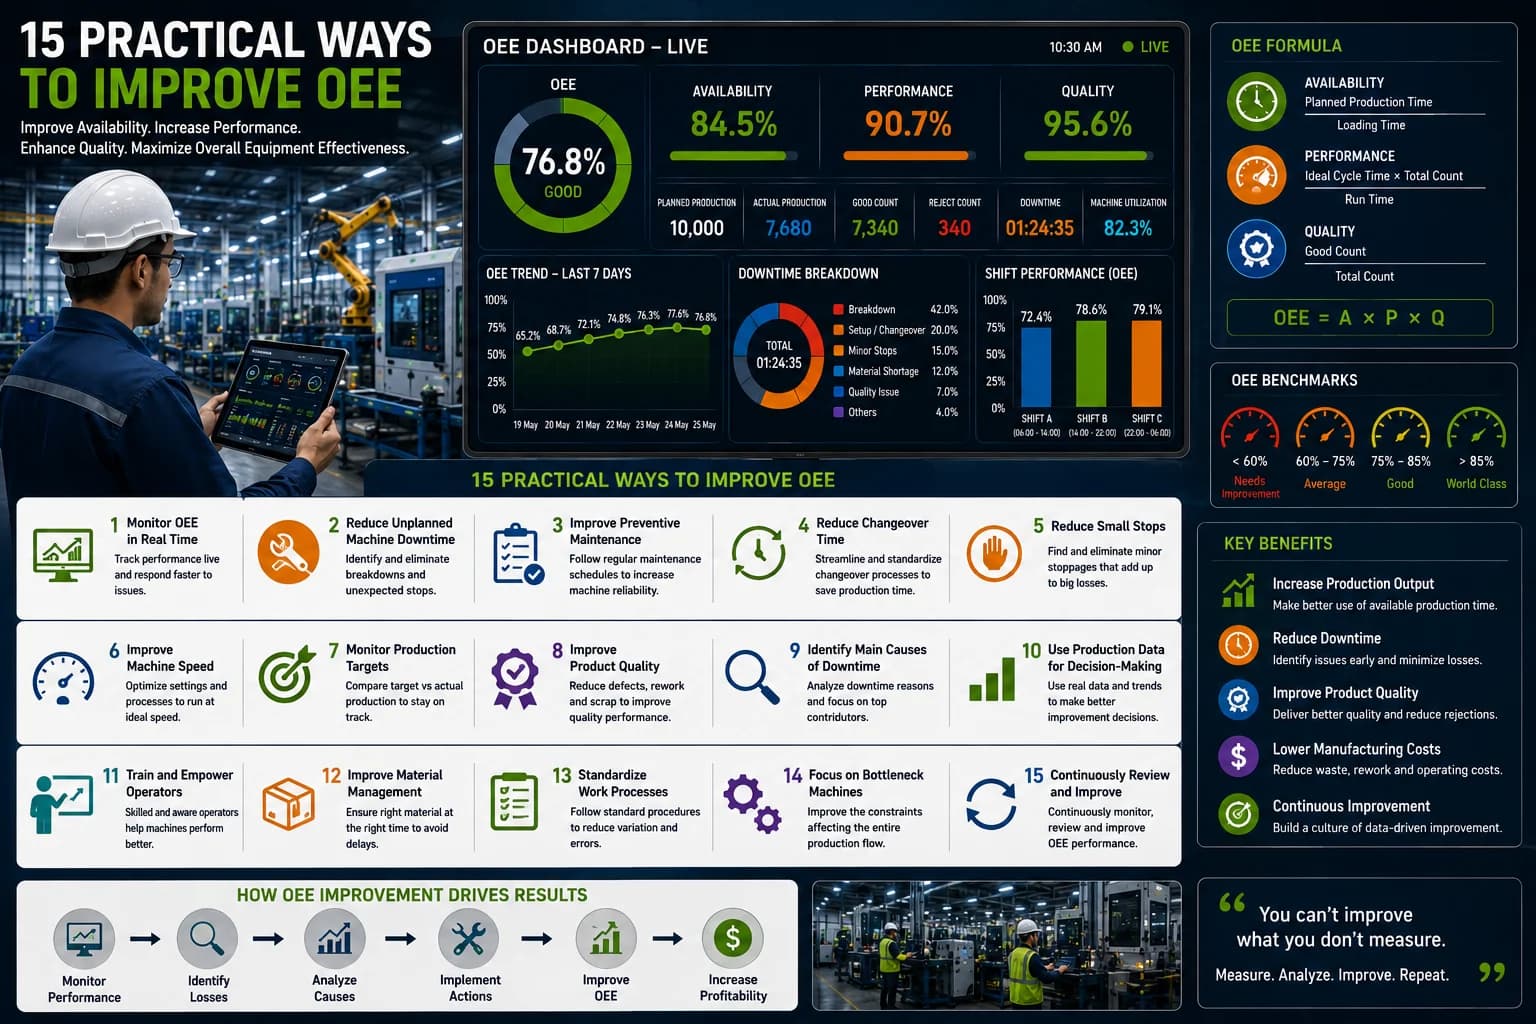
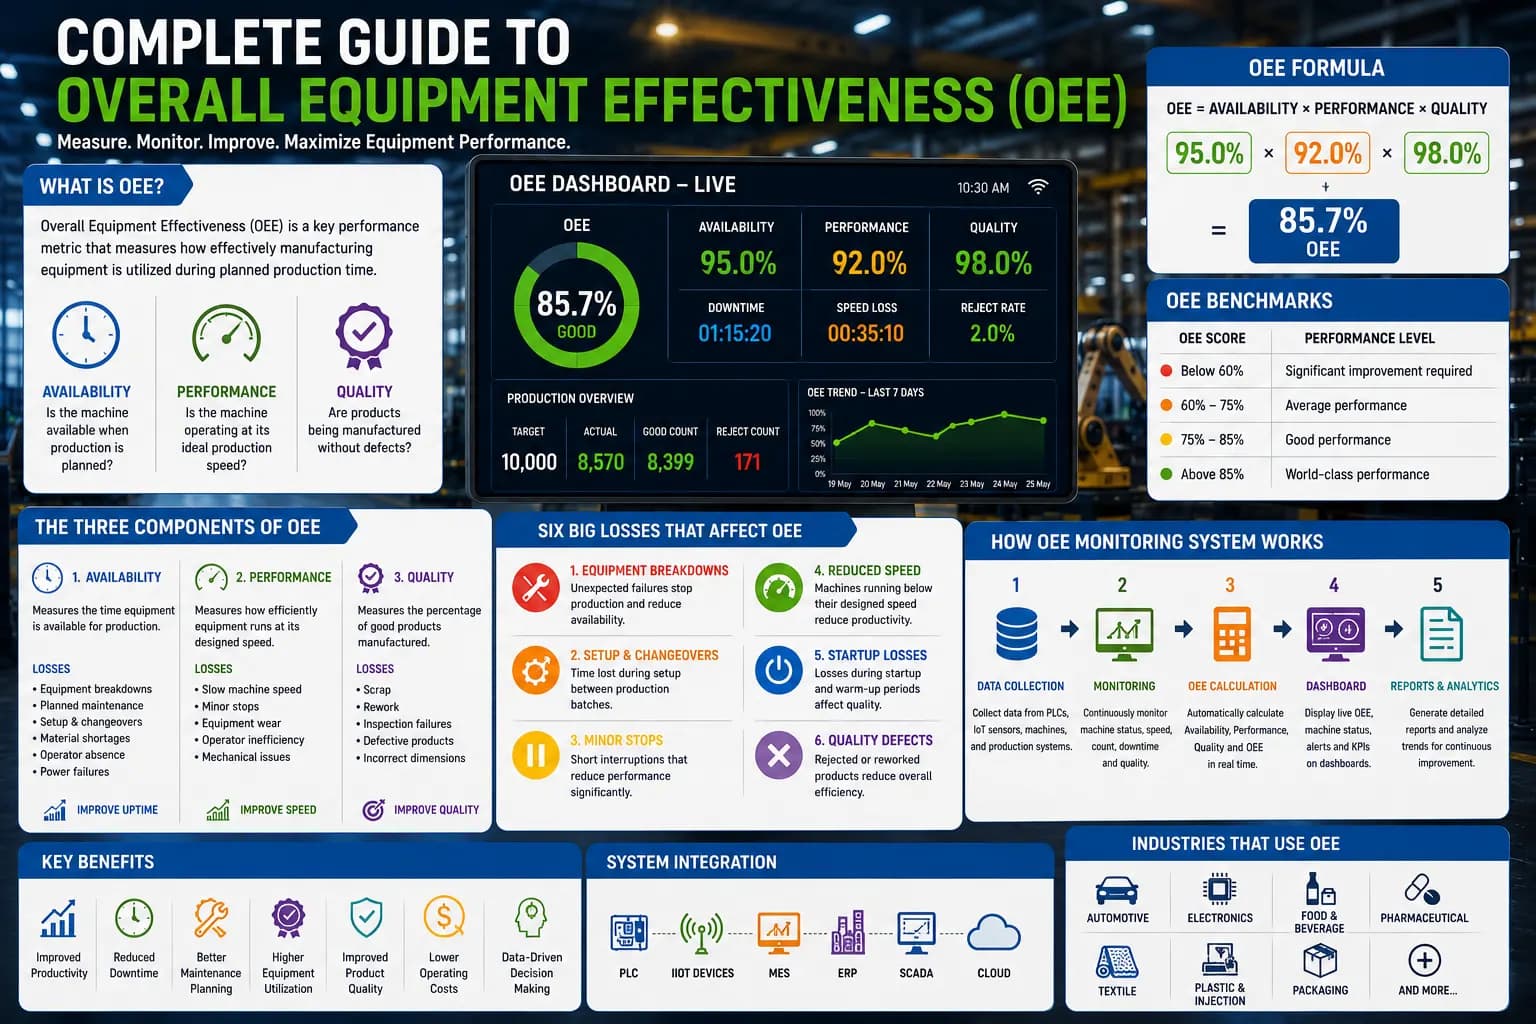
Overall Equipment Effectiveness, commonly known as OEE, is one of the most important manufacturing performance indicators.
OEE considers three major factors:
- Availability
- Performance
- Quality
Monitoring OEE helps manufacturers understand how effectively production equipment is being used.
Production Output
Production output represents the number of products manufactured during a specific period.
A dashboard can display:
- Total production
- Good production
- Rejected production
- Hourly production
- Shift production
- Daily production
Production output helps managers determine whether production is meeting planned requirements.
Target Versus Actual Production
Target versus actual production compares planned production with actual production.
For example, if the target for a shift is 5000 units and the factory produces 4600 units, the dashboard can show the production gap.
The production team can then investigate possible causes such as:
- Machine breakdown
- Material shortage
- Slow production speed
- Quality problems
- Changeover delays
This helps managers take corrective action during the production shift.
Machine Utilization
Machine utilization shows how effectively production equipment is being used.
Important information can include:
- Machine running time
- Idle time
- Downtime
- Setup time
- Maintenance time
- Utilization percentage
Low machine utilization can indicate problems with production planning, machine availability, material supply, or equipment performance.
Downtime
Downtime represents the time when a machine or production line is not producing.
A dashboard can monitor:
- Total downtime
- Planned downtime
- Unplanned downtime
- Breakdown duration
- Number of breakdowns
- Downtime reasons
Downtime information helps production and maintenance teams understand where production time is being lost.
Quality
Quality is another important manufacturing KPI.
A dashboard can monitor:
- Good quantity
- Rejected quantity
- Scrap
- Rework
- Defect rate
- Quality percentage
Monitoring quality together with production output helps manufacturers understand whether production is meeting quality requirements.
Cycle Time
Cycle time represents the time required to produce one unit.
Monitoring cycle time can help identify:
- Slow machines
- Production speed losses
- Process bottlenecks
- Machine performance issues
- Process variations
Increasing cycle time can be an indication that a production process needs investigation.
Manufacturing KPI Dashboards for Different Teams
Different teams require different production information.
A good dashboard should provide information according to the responsibilities of each user.
Dashboard for Operators
Operators need information about their machines and current production activities.
Important information can include:
- Current machine status
- Production count
- Production target
- Actual production
- Active downtime
- Shift performance
This helps operators understand the current production condition.
Dashboard for Production Managers
Production managers need a broader view of factory performance.
Important KPIs include:
- OEE
- Production achievement
- Target versus actual production
- Machine utilization
- Downtime
- Shift performance
- Production efficiency
This information helps managers identify production problems and coordinate corrective actions.
Dashboard for Maintenance Teams
Maintenance teams need equipment-related information.
A maintenance dashboard can display:
- Machine breakdowns
- Downtime history
- MTBF
- MTTR
- Machine reliability
- Maintenance downtime
- Equipment performance
This helps maintenance teams prioritize machines that require attention.
Dashboard for Quality Teams
Quality teams can monitor:
- Rejection rate
- Scrap
- Rework
- Defect trends
- Quality percentage
- Good production
This information helps quality teams identify recurring quality problems.
Dashboard for Plant Management
Plant managers and senior management generally need a high-level view of factory performance.
A management dashboard can include:
- Overall OEE
- Total production
- Production achievement
- Major downtime causes
- Quality performance
- Machine utilization
- Production efficiency
This provides a quick overview of the manufacturing operation.
Real-Time Manufacturing KPI Dashboard
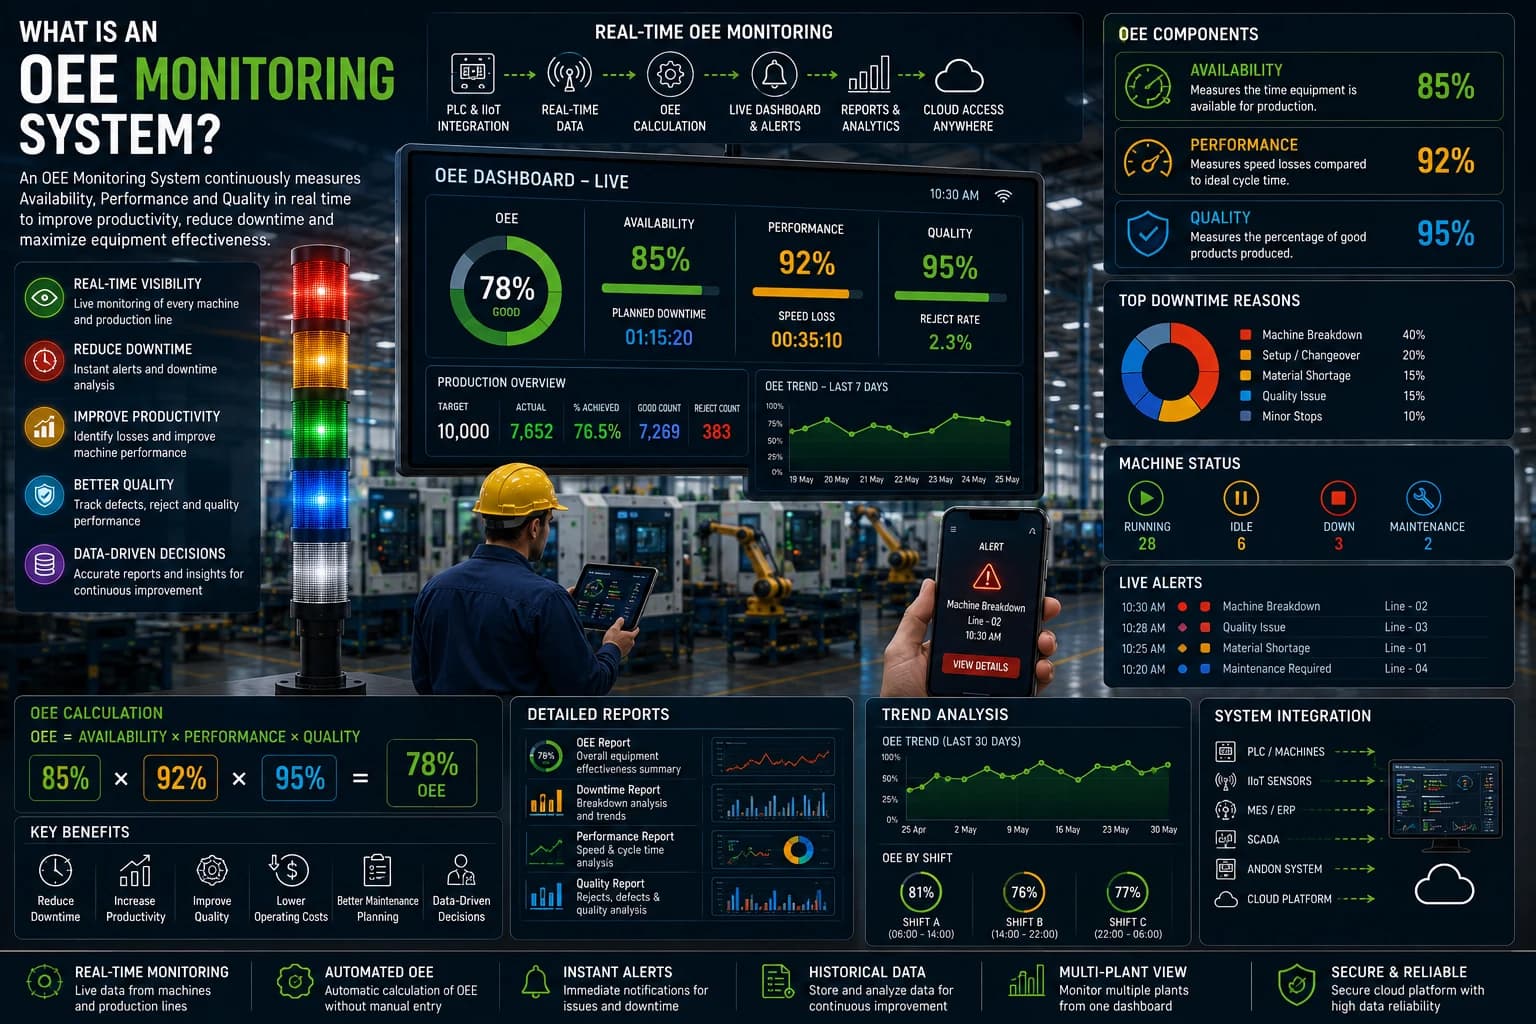
A real-time Manufacturing KPI Dashboard updates production information as manufacturing activities occur.
For example, when a machine stops, the monitoring system can detect the machine event and update the dashboard.
The production team can then see the machine condition and investigate the problem without waiting for a manual report.
Real-time dashboards are particularly useful for factories with:
- Multiple production lines
- Multiple shifts
- Large numbers of machines
- High production volumes
- Continuous production
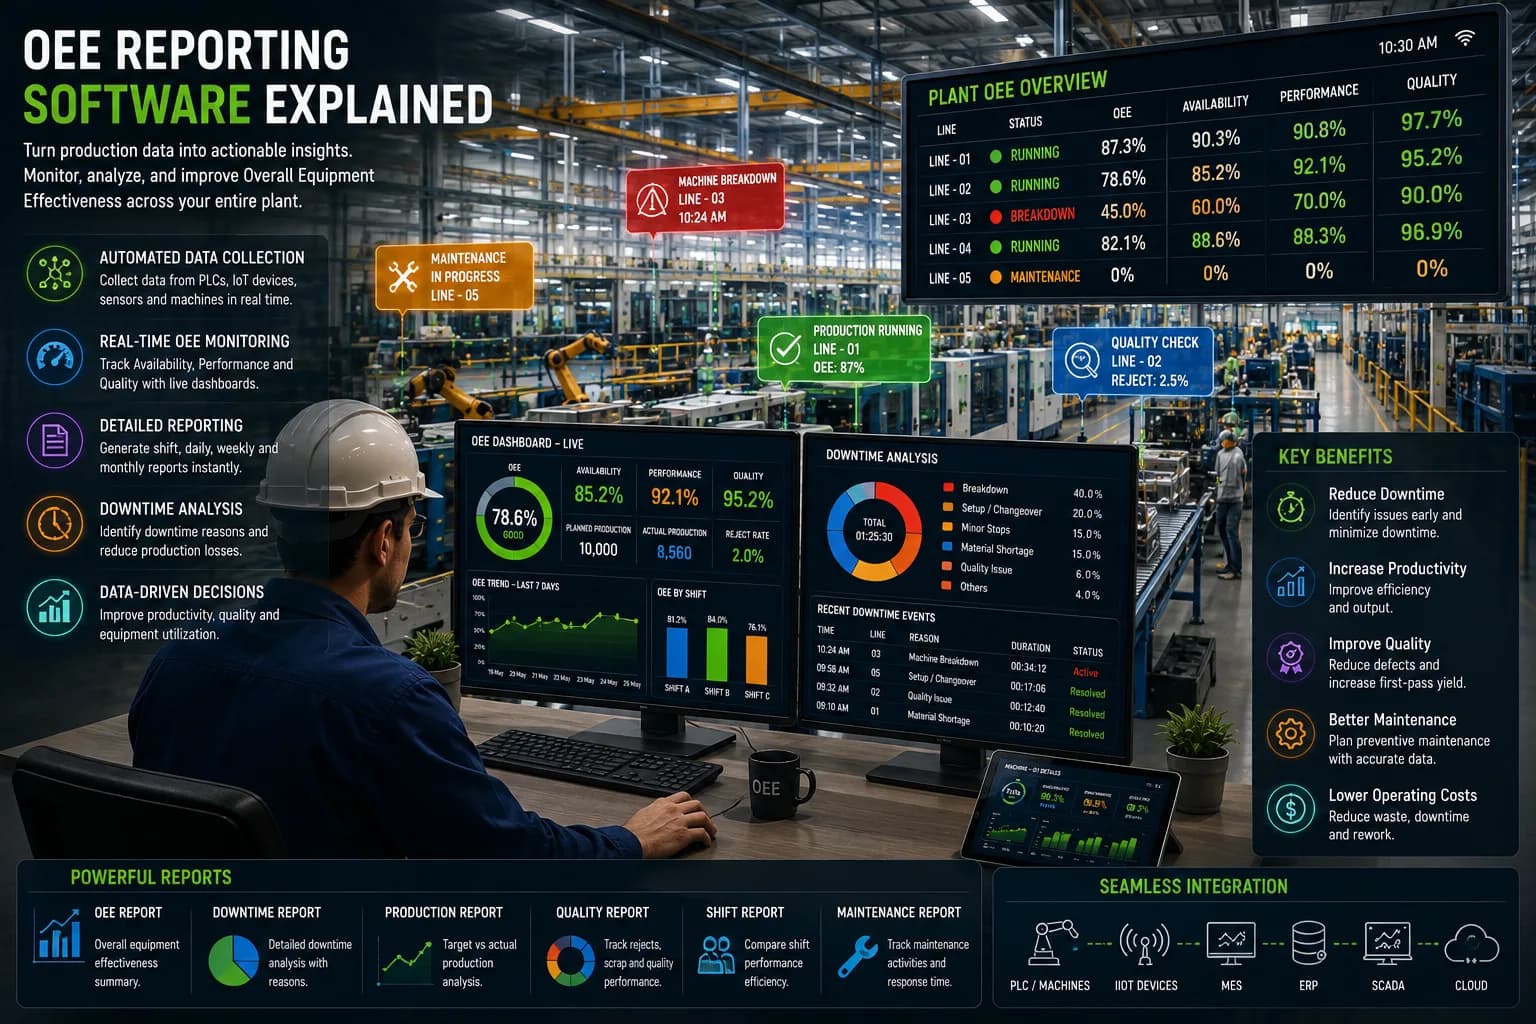
Main Features of a Manufacturing KPI Dashboard
A useful dashboard should make important production information easy to understand.
KPI Summary
The dashboard can display important indicators such as:
- OEE
- Production
- Downtime
- Quality
- Machine utilization
- Production efficiency
This gives managers a quick overview of factory performance.
Machine Status
The dashboard can display the current status of machines.
Common statuses include:
- Running
- Idle
- Breakdown
- Maintenance
- Setup
- Waiting
This helps teams identify machines that need attention.
Production Trends
Production trends can be monitored over different periods.
Examples include:
- Hourly production
- Shift production
- Daily production
- Weekly production
- Monthly production
Historical trends help managers understand changes in production performance.
Downtime Analysis
Downtime analysis helps manufacturers understand where production time is being lost.
The dashboard can show:
- Machine downtime
- Downtime reasons
- Breakdown duration
- Number of breakdowns
- Shift-wise downtime
- Planned downtime
- Unplanned downtime
This information helps teams focus on major production losses.
Shift Performance
Manufacturers can compare different shifts based on:
- Production
- OEE
- Downtime
- Quality
- Machine utilization
Shift comparison can help identify performance differences and recurring problems.
Benefits of Manufacturing KPI Dashboards
Better Production Visibility
A Manufacturing KPI Dashboard provides a centralized view of production information.
Managers can understand factory performance without waiting for manual reports.
Faster Decision-Making
Real-time production information helps teams identify problems and respond faster.
Reduced Downtime
Quick visibility into machine stoppages allows maintenance and production teams to respond sooner.
Improved Machine Utilization
Machine utilization information helps identify equipment that is idle or underused.
Better Quality Monitoring
Quality KPIs help manufacturers identify increasing rejection, scrap, and defect rates.
Reduced Manual Reporting
Automated production data collection can reduce the need for manually prepared spreadsheets and reports.
Better Communication
Operators, production managers, maintenance teams, quality teams, and management can work with the same production information.
Manufacturing KPI Dashboard and OEE
OEE is often displayed prominently on manufacturing dashboards.
However, OEE should not be viewed alone.
If OEE decreases, production teams need to understand the reason behind the change.
The dashboard should help users investigate:
- Downtime
- Reduced availability
- Lower production speed
- Quality losses
- Changeover time
- Machine stoppages
This makes the dashboard more useful for continuous improvement.
Manufacturing KPI Dashboard and Machine Monitoring
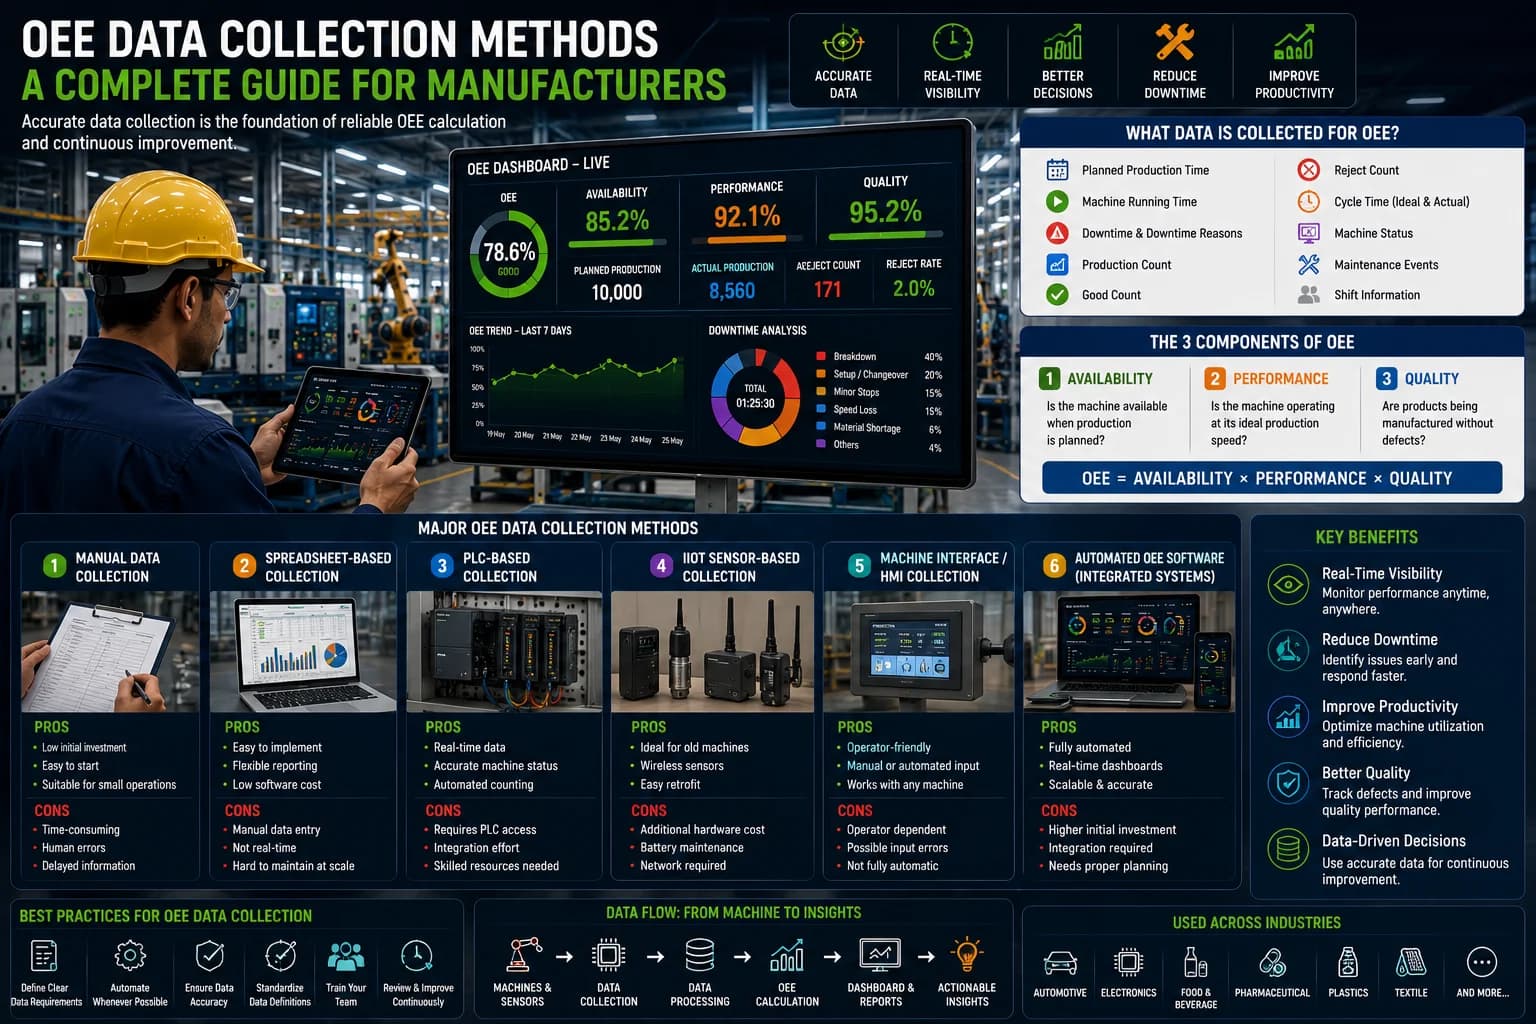
A Manufacturing KPI Dashboard can collect information from machines using technologies such as:
- PLCs
- Sensors
- Industrial IoT devices
- Machine controllers
- Production counters
- Edge devices
This allows production information to be collected automatically.
Older machines can also be connected using suitable sensors and industrial IoT devices.
This makes it possible to monitor both modern and legacy machines.
Manufacturing KPI Dashboard and Industry 4.0
Industry 4.0 focuses on connected and data-driven manufacturing.
Manufacturing KPI dashboards support this transformation by bringing production information into a centralized digital environment.
A dashboard can receive information from:
- Machines
- PLCs
- Industrial IoT devices
- MES
- ERP
- SCADA
- OEE systems
- Andon systems
- Quality systems
- Maintenance systems
This provides better visibility across manufacturing operations.
Best Practices for Manufacturing KPI Dashboards
Keep the Dashboard Simple
A dashboard should not contain every available metric.
Focus on KPIs that are useful for production decisions.
Prioritize Important Information
Critical KPIs should be easy to find.
These may include:
- OEE
- Production target
- Actual production
- Downtime
- Quality
- Machine utilization
Use Real-Time Data
Connect the dashboard with machines and production systems whenever possible.
This improves production visibility and reduces reporting delays.
Use Historical Data
Real-time information shows current performance, while historical information helps identify recurring problems.
Customize Dashboards
Different users require different information.
Create suitable dashboard views for operators, production managers, maintenance teams, quality teams, and plant management.
Make Information Accessible
Dashboards can be displayed on shop floor screens, desktop computers, tablets, and other devices.
This allows production information to be available where it is needed.
How to Implement a Manufacturing KPI Dashboard
Define Production Objectives
First determine what the dashboard should help improve.
Common objectives include:
- Reducing downtime
- Improving OEE
- Increasing production
- Improving quality
- Increasing machine utilization
Select KPIs
Choose KPIs that directly support the production objectives.
Avoid adding unnecessary metrics.
Identify Data Sources
Determine where production information will come from.
Possible sources include:
- Machines
- PLCs
- Sensors
- Production counters
- ERP
- MES
- SCADA
- Quality systems
Automate Data Collection
Connect machines and production systems wherever possible.
Automated collection can reduce manual work and improve data consistency.
Create Dashboard Views
Create suitable views for different users and departments.
Review Performance
Regularly review the dashboard and update the KPIs as production requirements change.
Future of Manufacturing KPI Dashboards
Manufacturing dashboards are becoming more advanced as Industrial IoT, Artificial Intelligence, Machine Learning, and analytics technologies continue to develop.
Future dashboards can support:
- Predictive alerts
- Machine condition monitoring
- Automated analysis
- Production forecasting
- Intelligent recommendations
- Advanced performance analytics
These capabilities can help manufacturers move from reactive production management toward more proactive decision-making.
Why Choose Robato Systems?
Robato Systems provides manufacturing monitoring solutions designed to improve production visibility.
The platform can connect with machines, PLCs, Industrial IoT devices, sensors, production counters, OEE systems, and Andon systems.
Manufacturers can monitor:
- OEE
- Production output
- Target versus actual production
- Machine utilization
- Downtime
- Quality
- Shift performance
- Machine status
- Production trends
Real-time dashboards and automated production information can help manufacturing teams reduce manual reporting and make faster production decisions.
Conclusion
A Manufacturing KPI Dashboard provides manufacturers with a centralized view of important production information.
By monitoring OEE, production output, machine utilization, downtime, quality, and target versus actual production, manufacturers can better understand their factory performance.
The most useful dashboards focus on information that supports real production decisions.
As manufacturing operations become more connected, KPI dashboards can play an important role in improving production visibility, reducing downtime, increasing machine utilization, and supporting Industry 4.0 initiatives.
Frequently Asked Questions
What is a Manufacturing KPI Dashboard?
A Manufacturing KPI Dashboard is a digital interface that displays important manufacturing performance indicators in one place.
Which KPIs should a manufacturing dashboard include?
Common KPIs include OEE, production output, downtime, quality, machine utilization, cycle time, and target versus actual production.
Can a KPI dashboard monitor machines in real time?
Yes. A dashboard can receive information from PLCs, sensors, Industrial IoT devices, machine controllers, and production counters.
Can old machines be connected to a manufacturing dashboard?
Yes. Legacy machines can be connected using suitable sensors, gateways, and Industrial IoT devices.
Who uses Manufacturing KPI Dashboards?
Production operators, production managers, maintenance teams, quality teams, plant managers, and senior management can use manufacturing KPI dashboards.
What is the main benefit of a Manufacturing KPI Dashboard?
The main benefit is improved production visibility. Teams can understand production performance faster and identify problems that require attention.