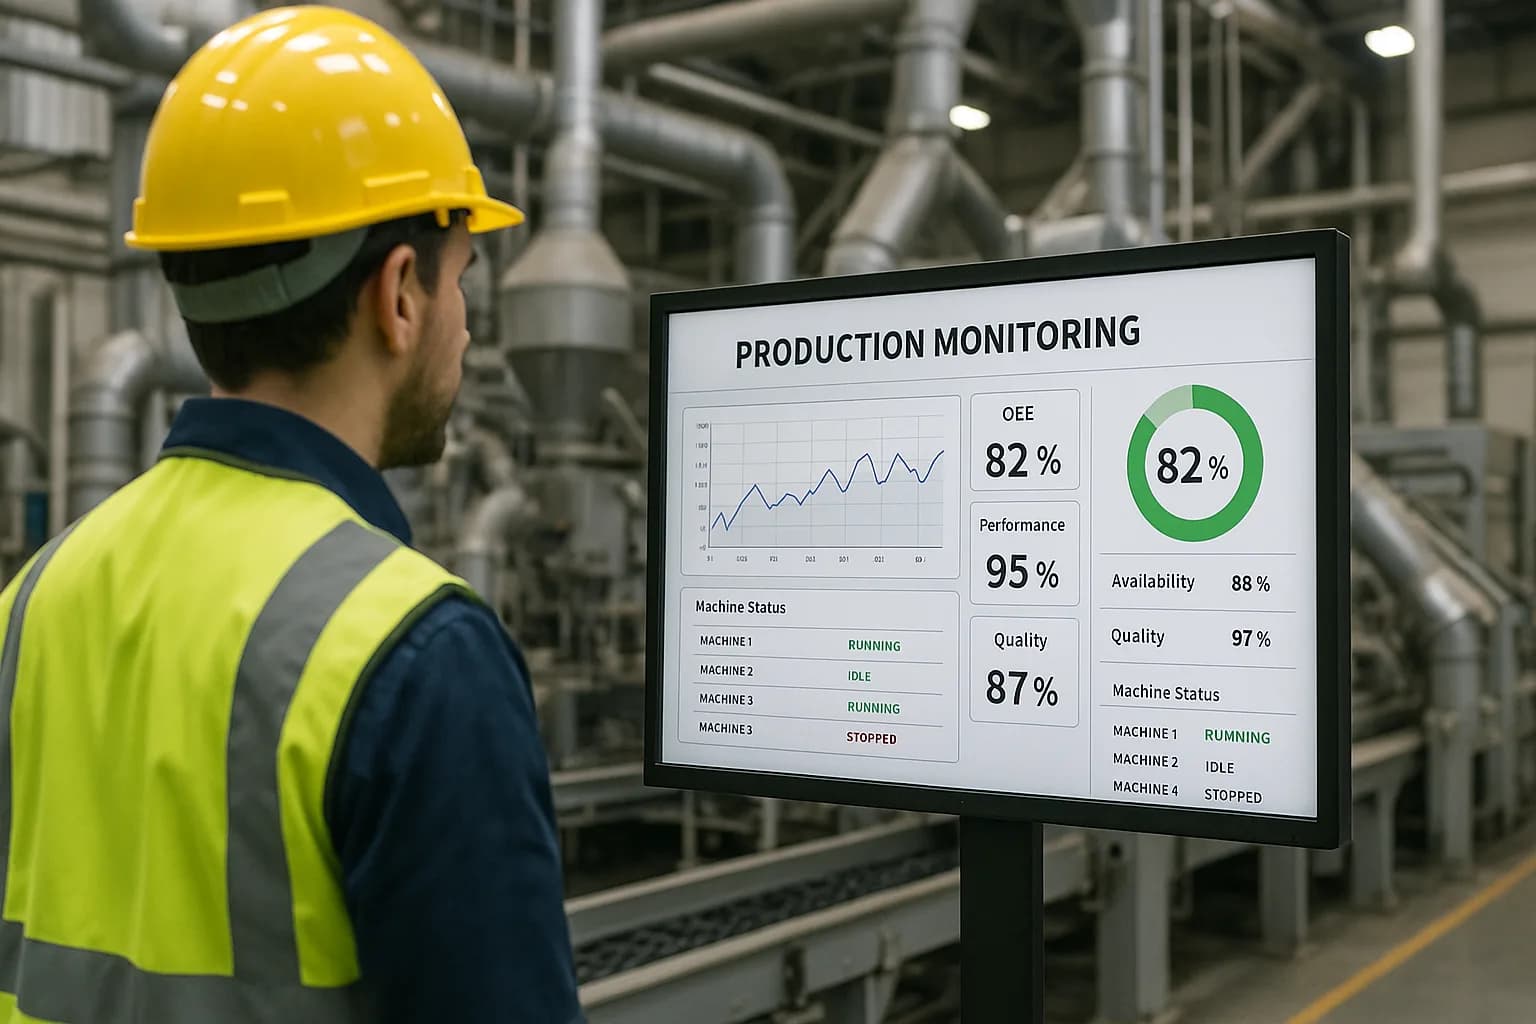
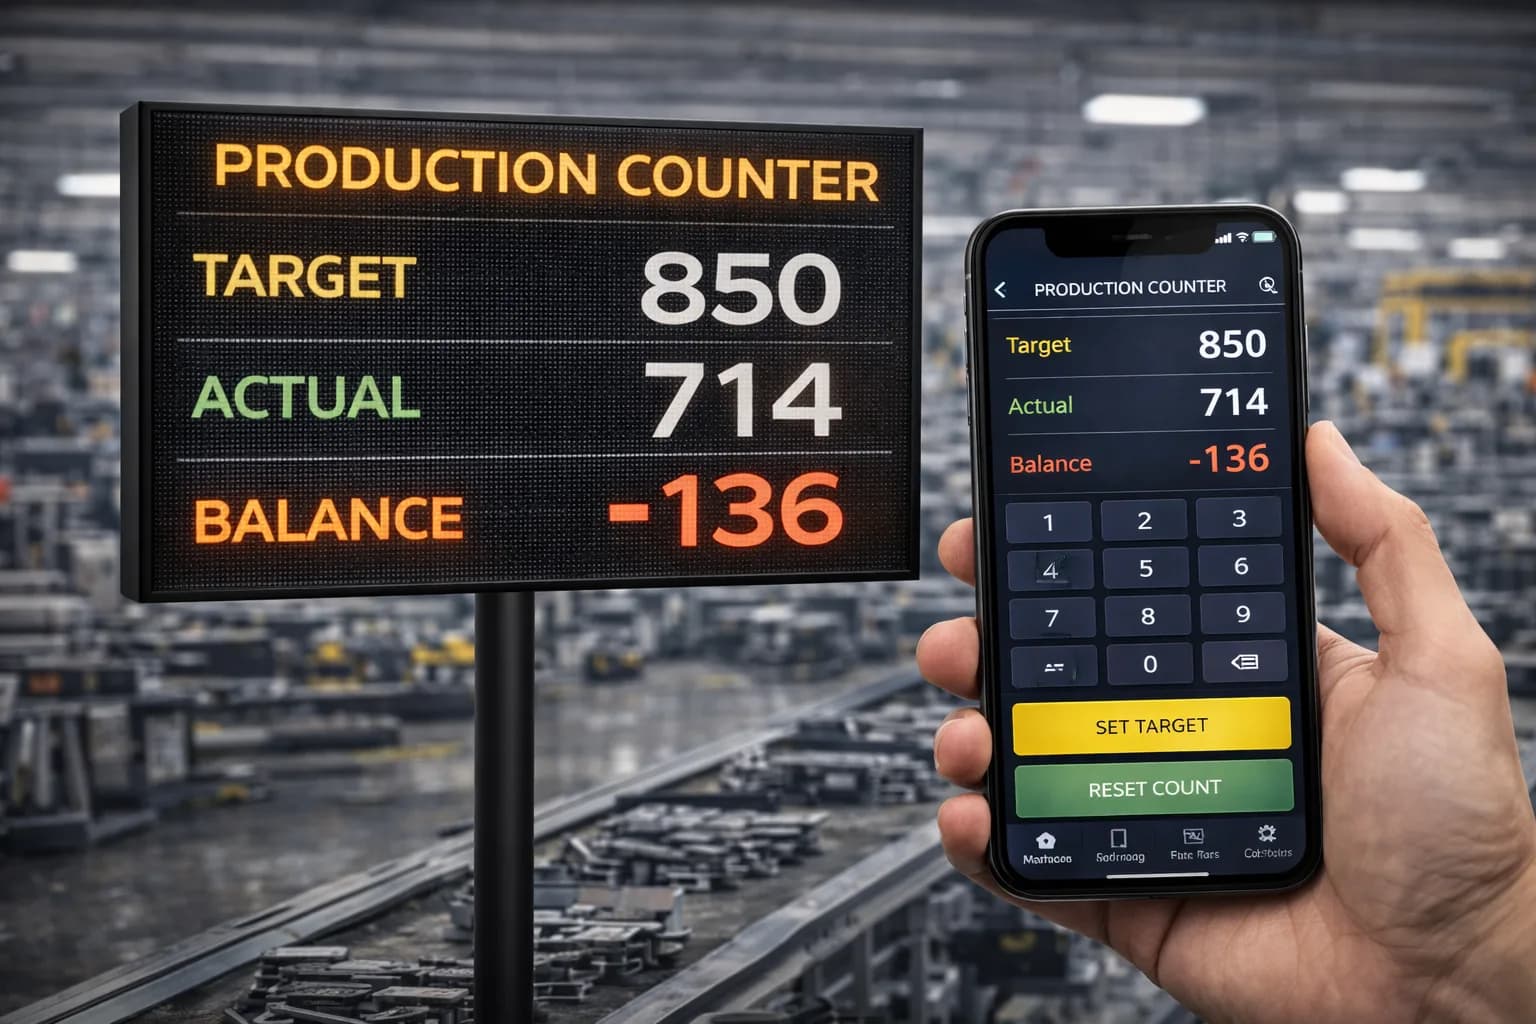
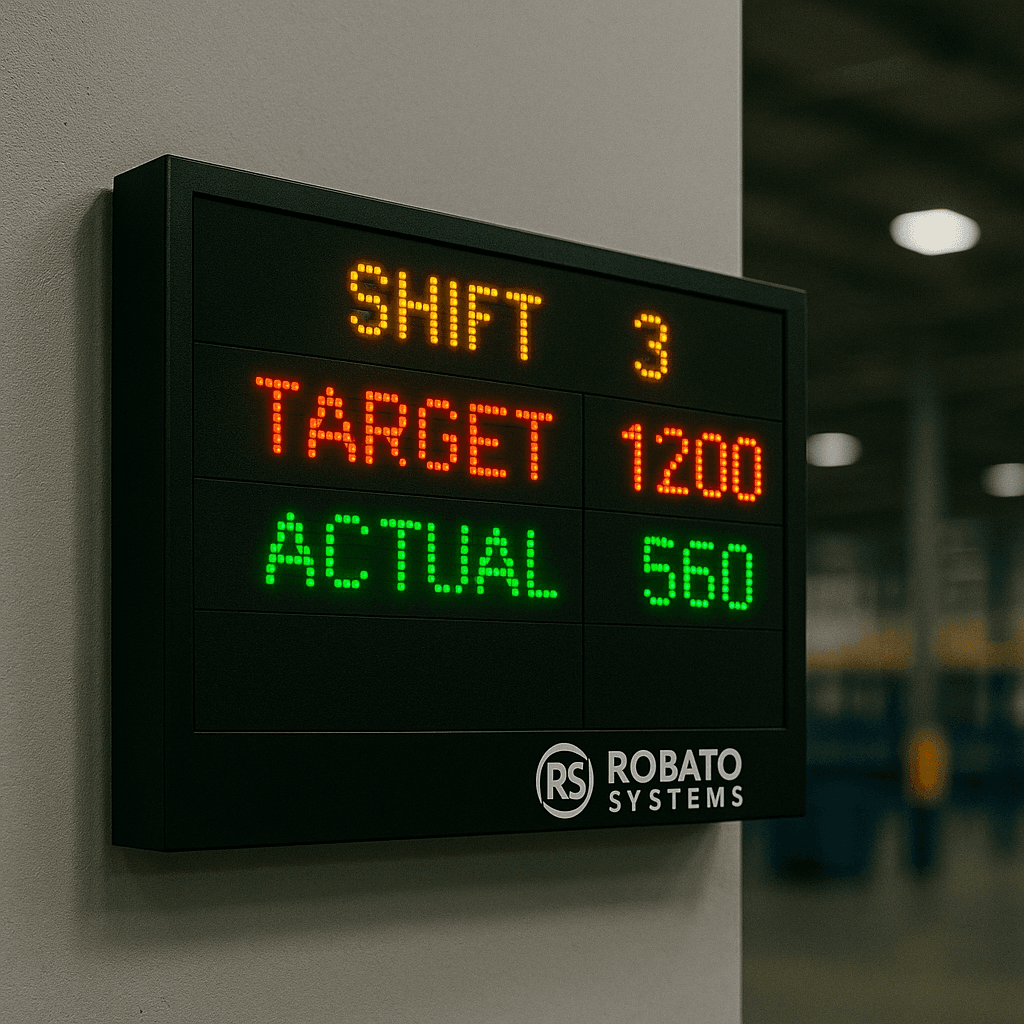
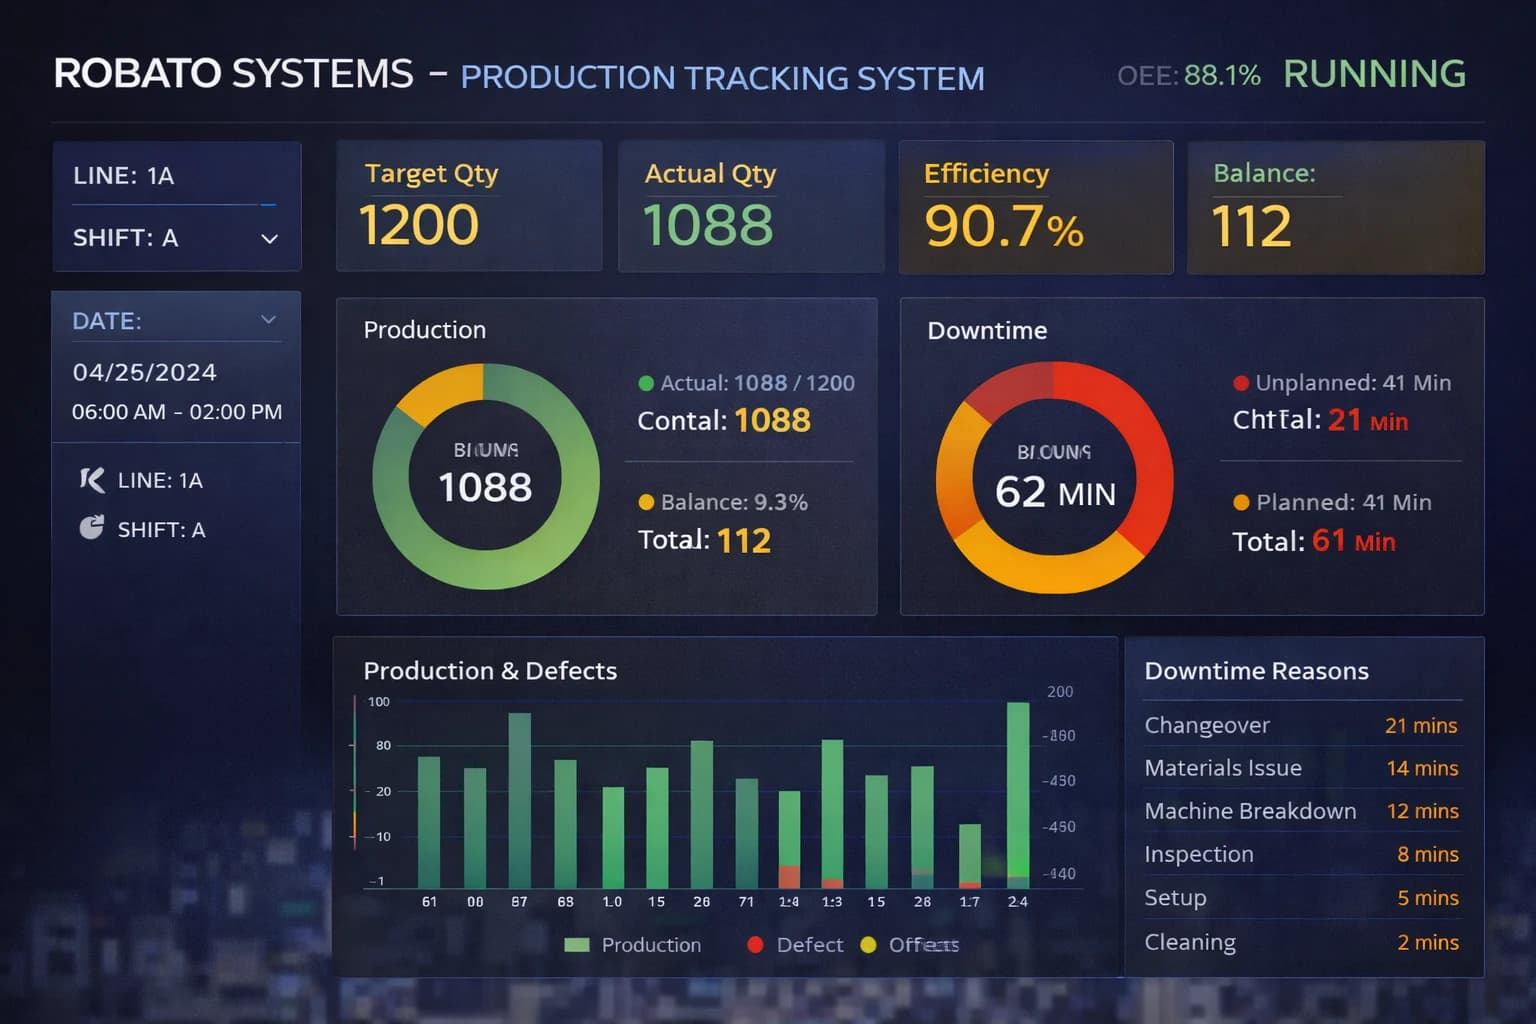
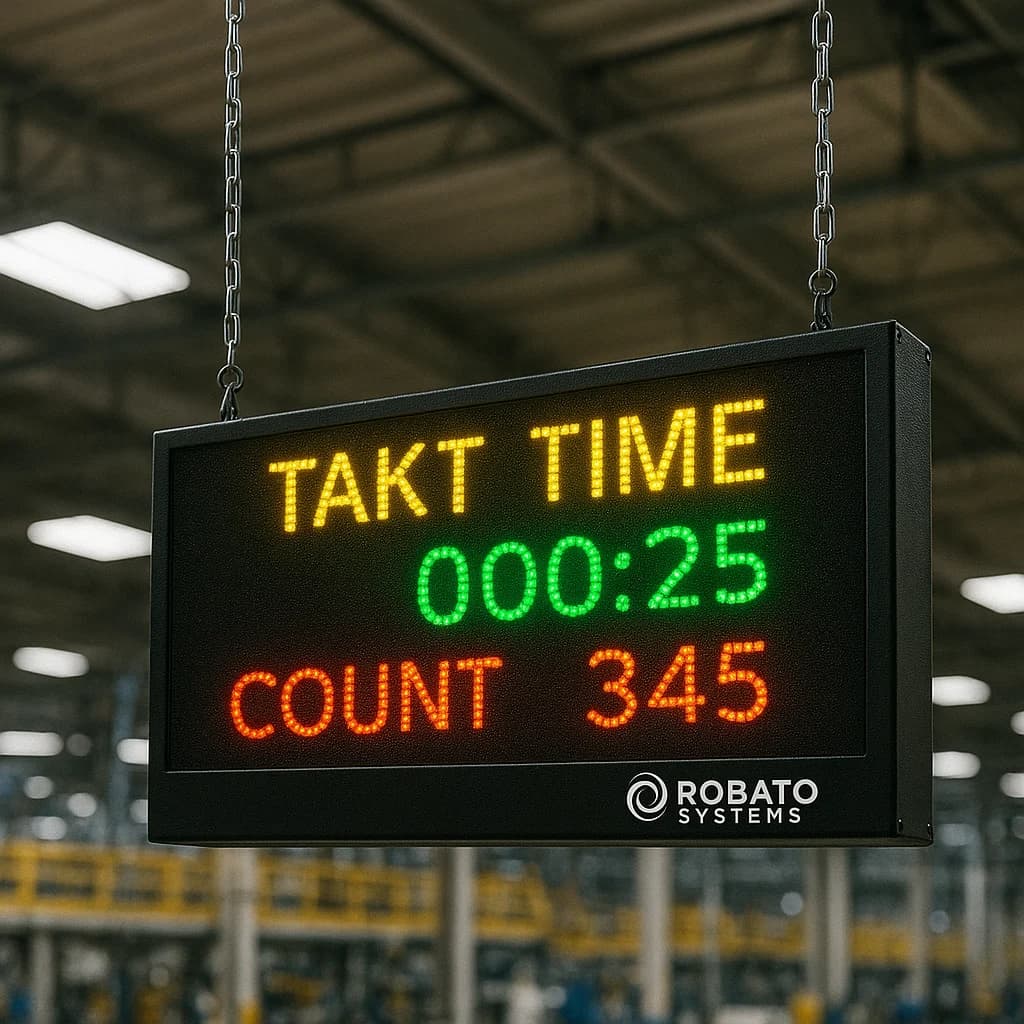
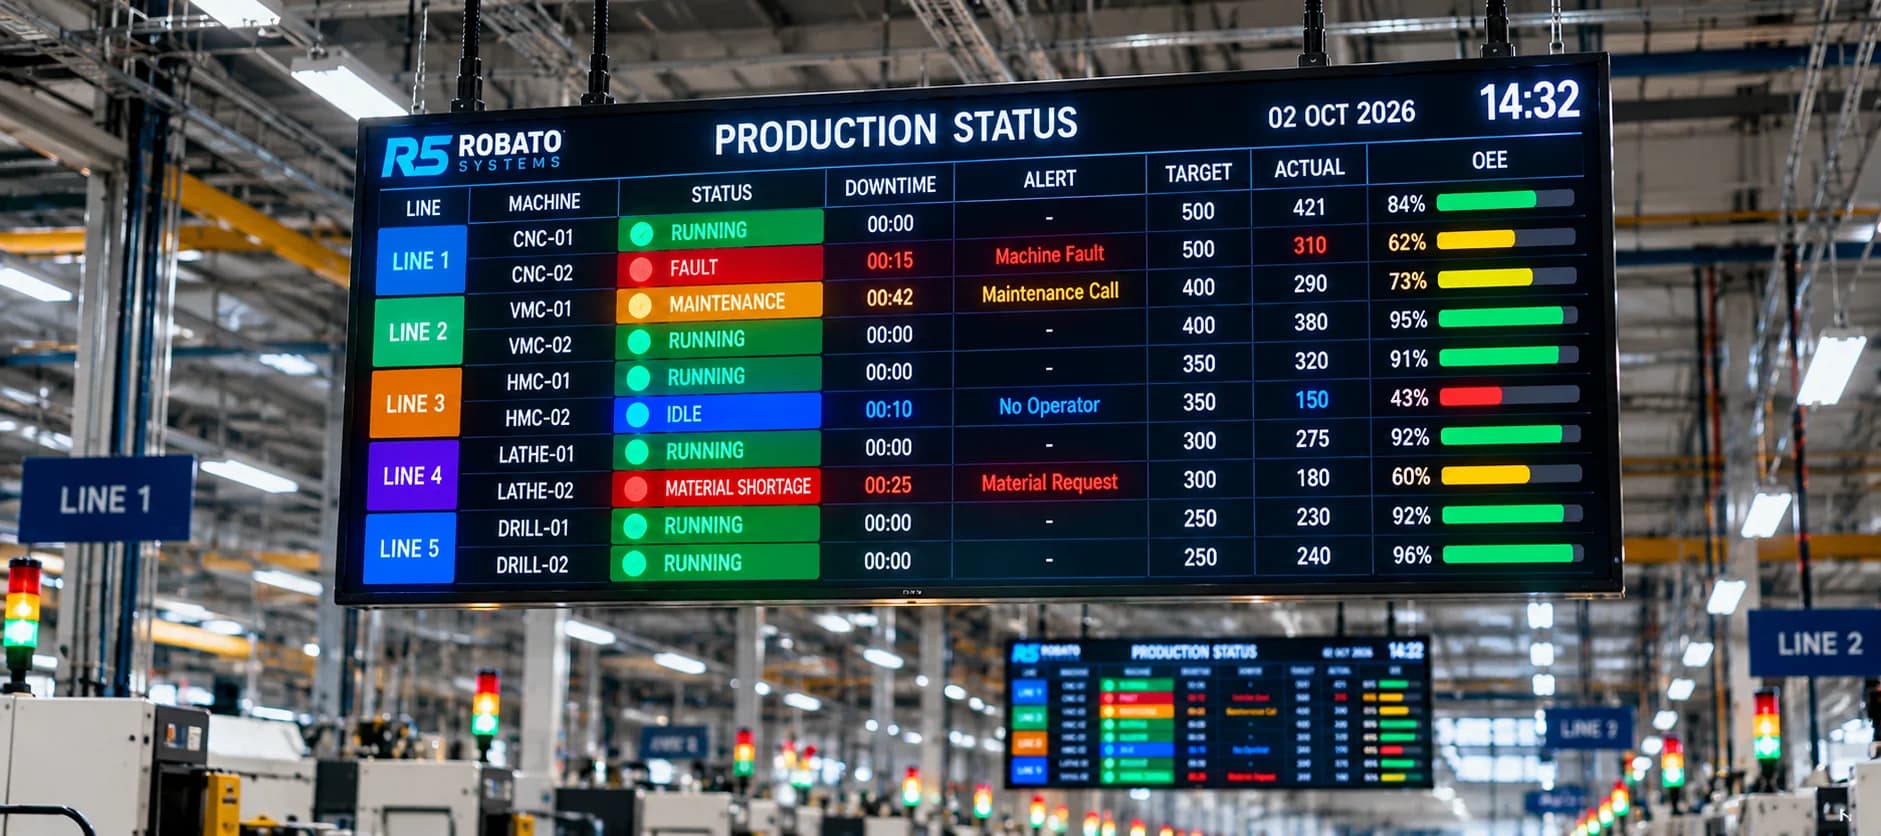
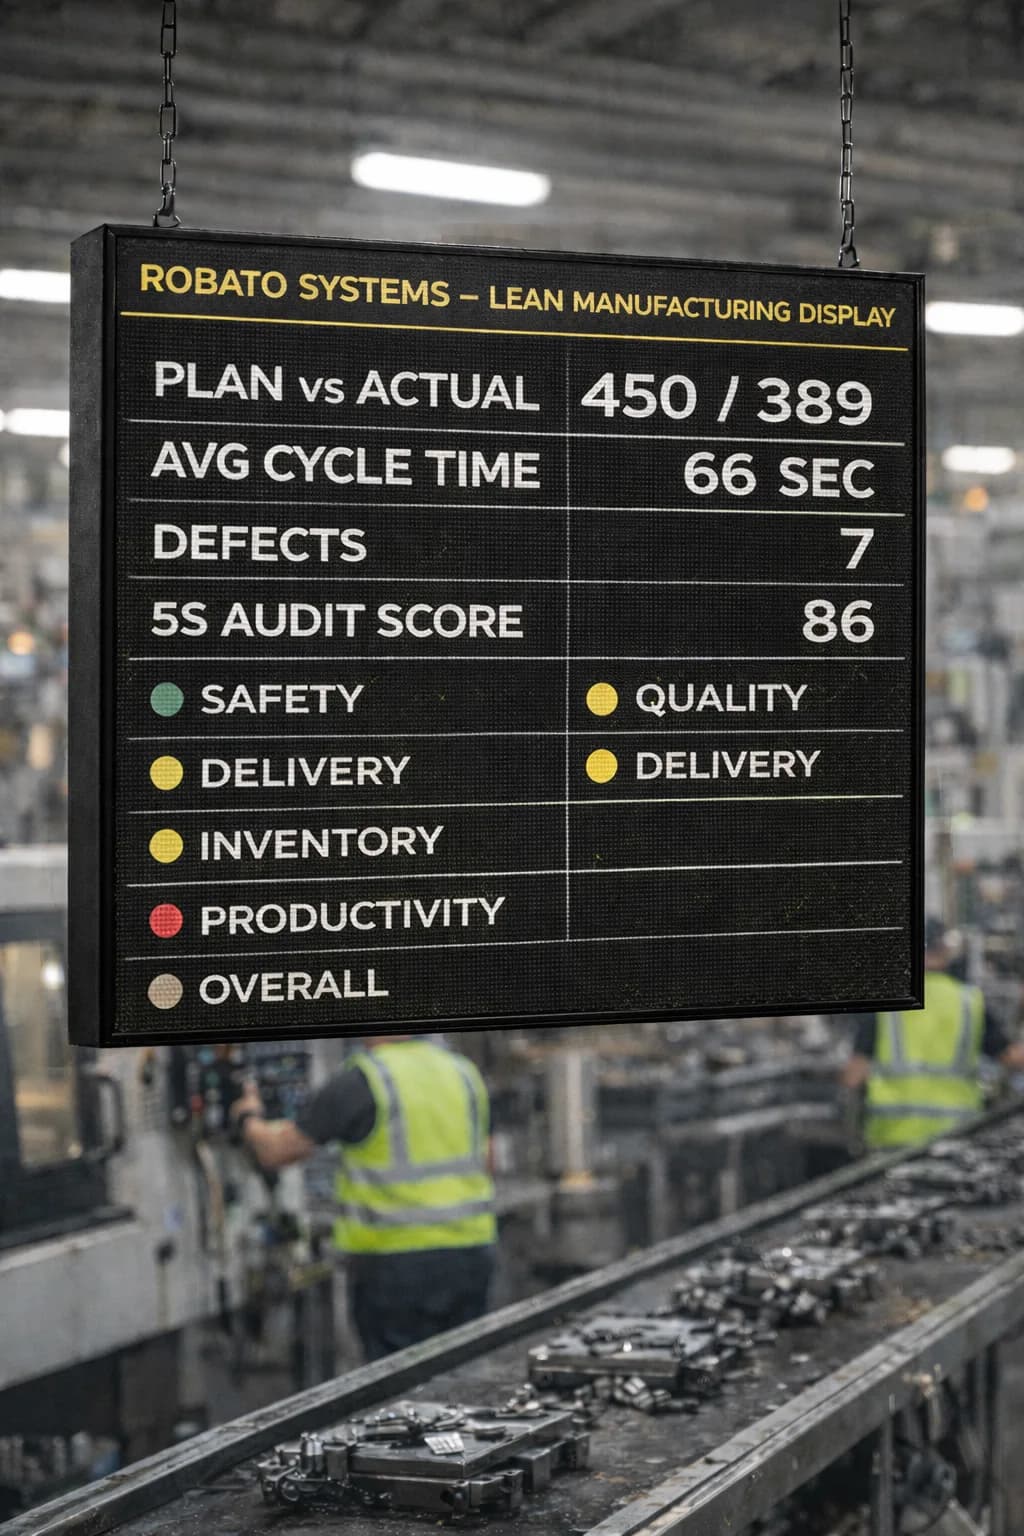
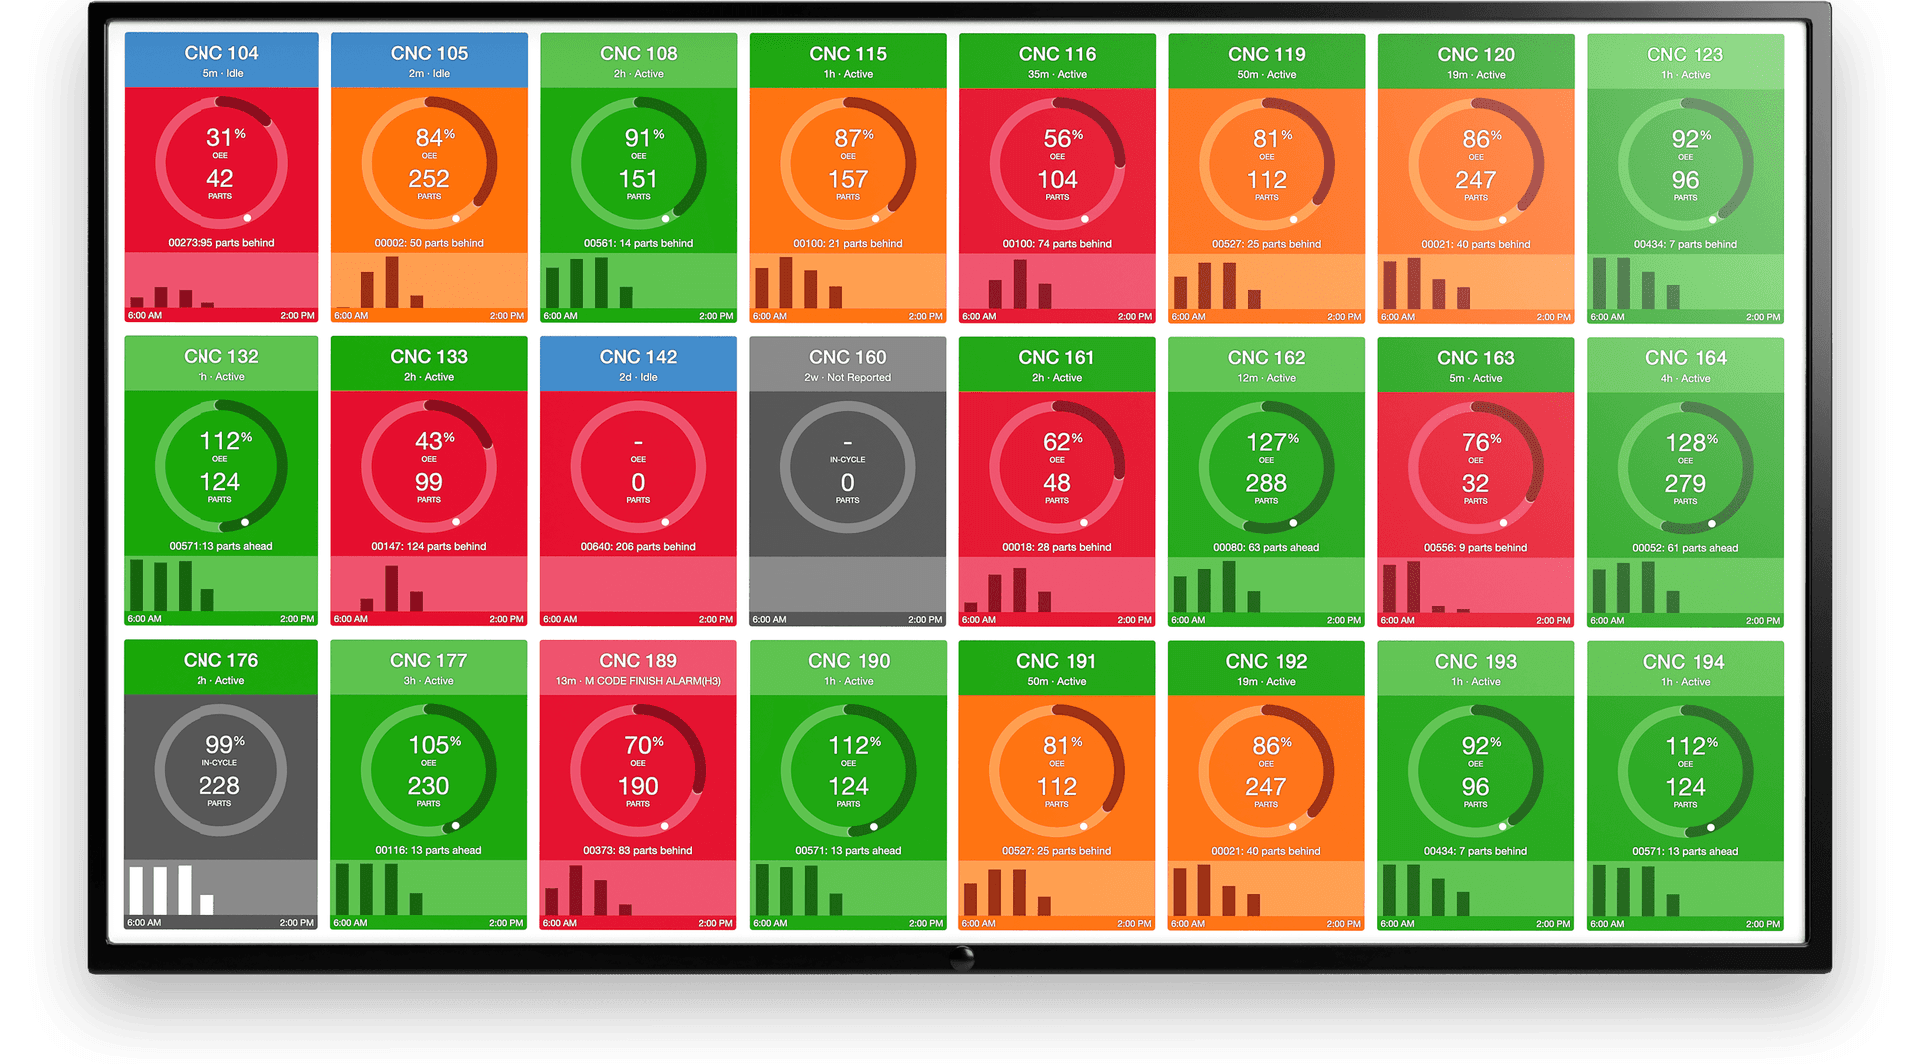
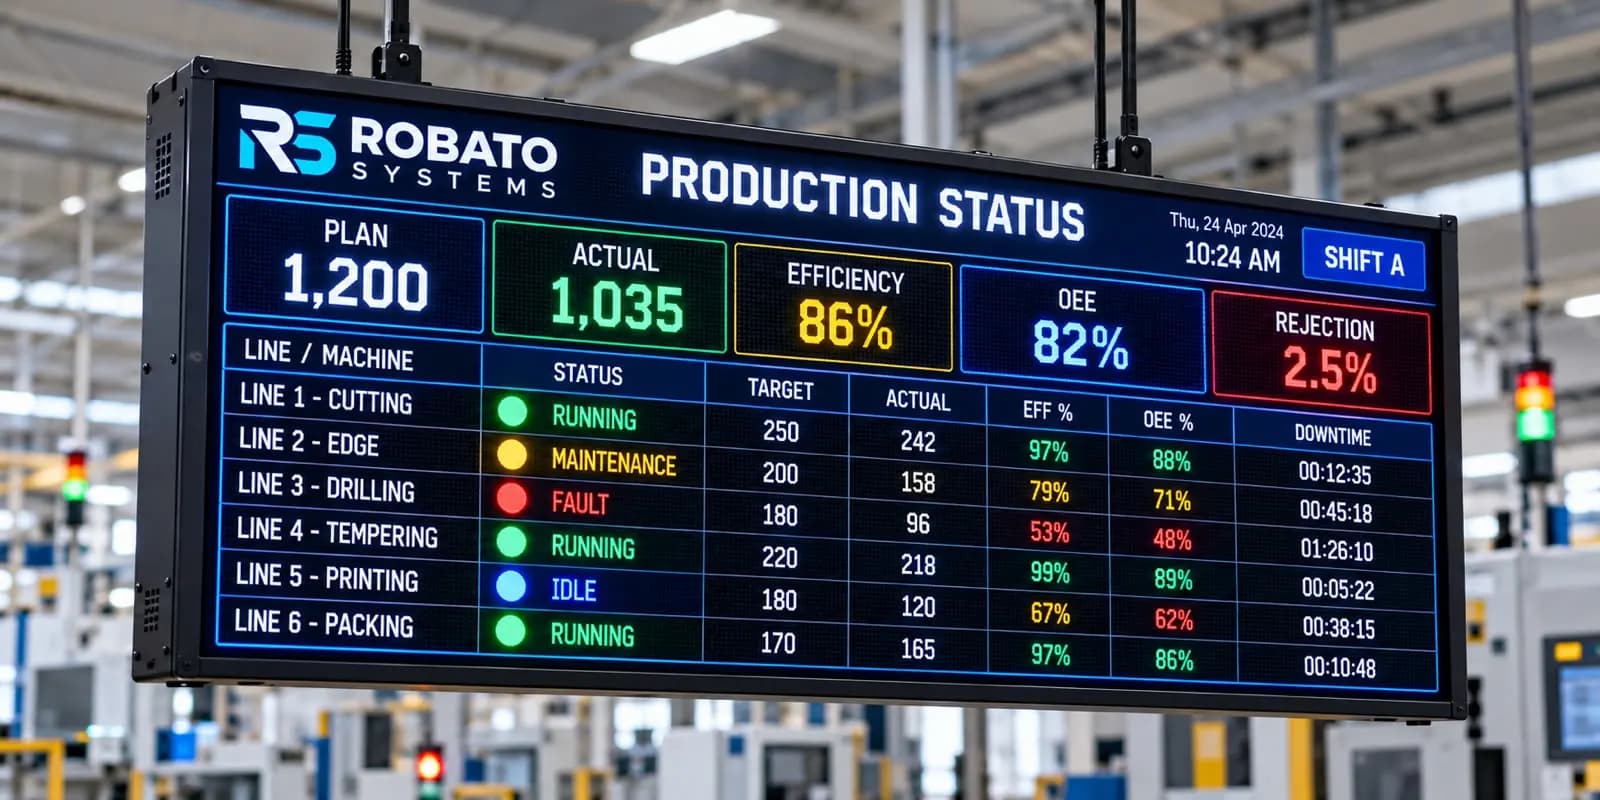
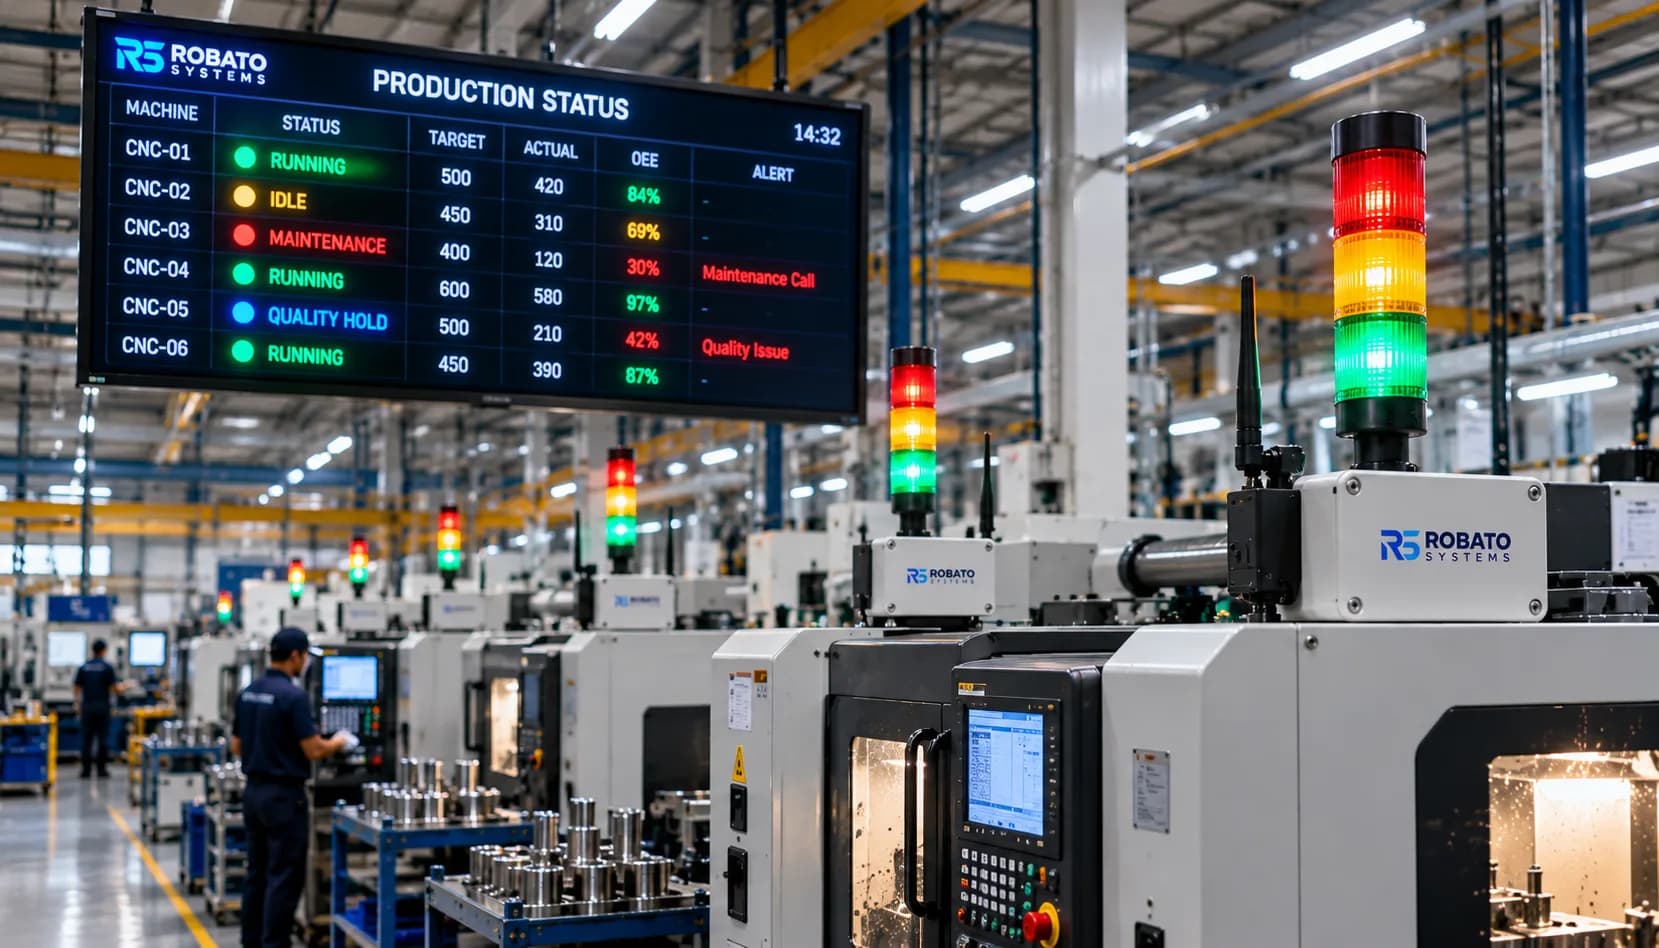
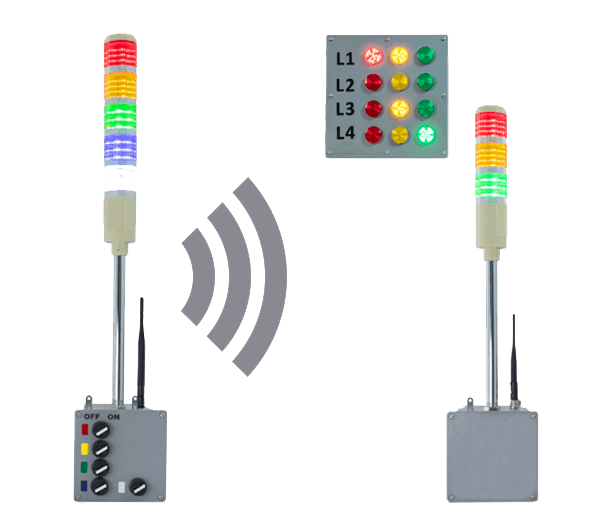
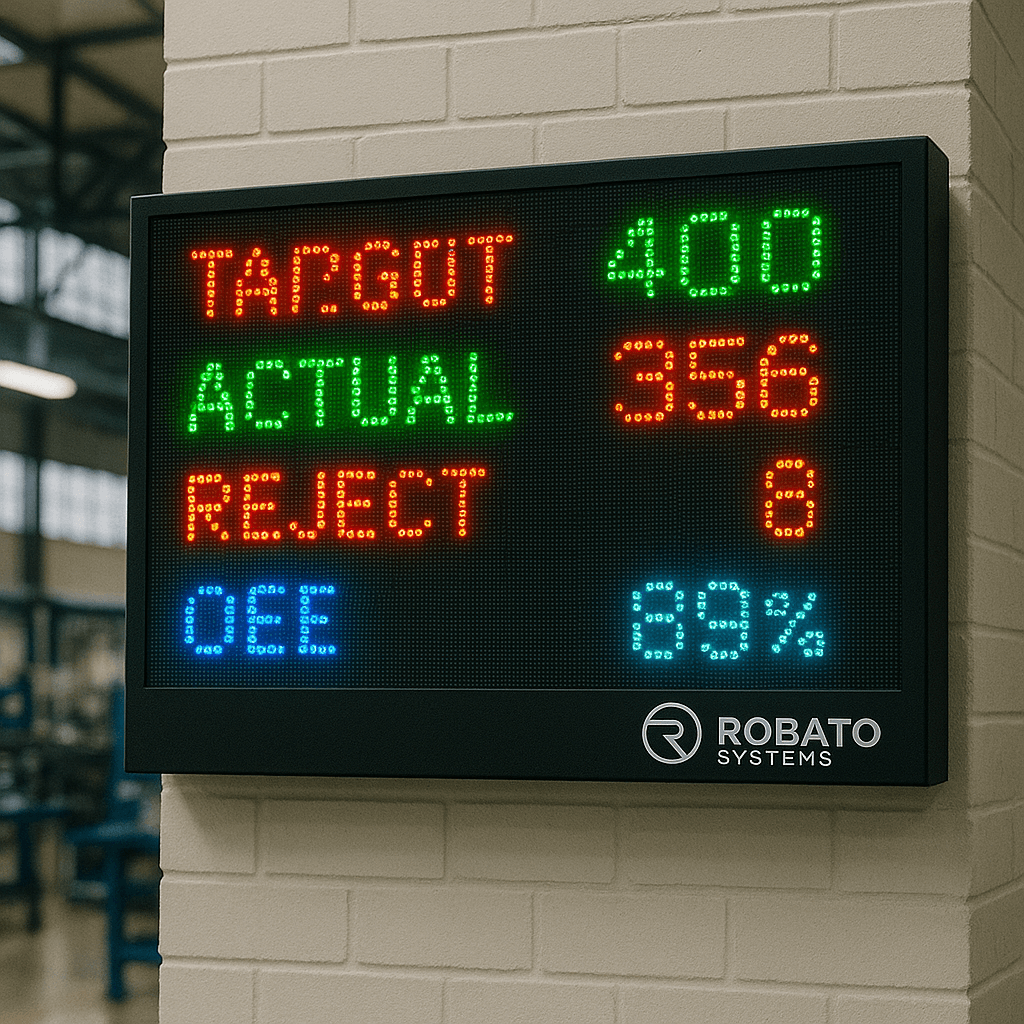
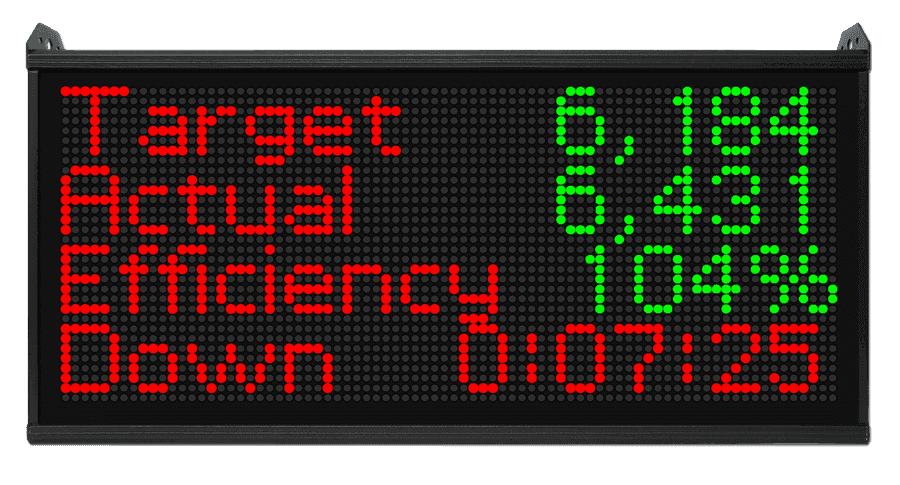
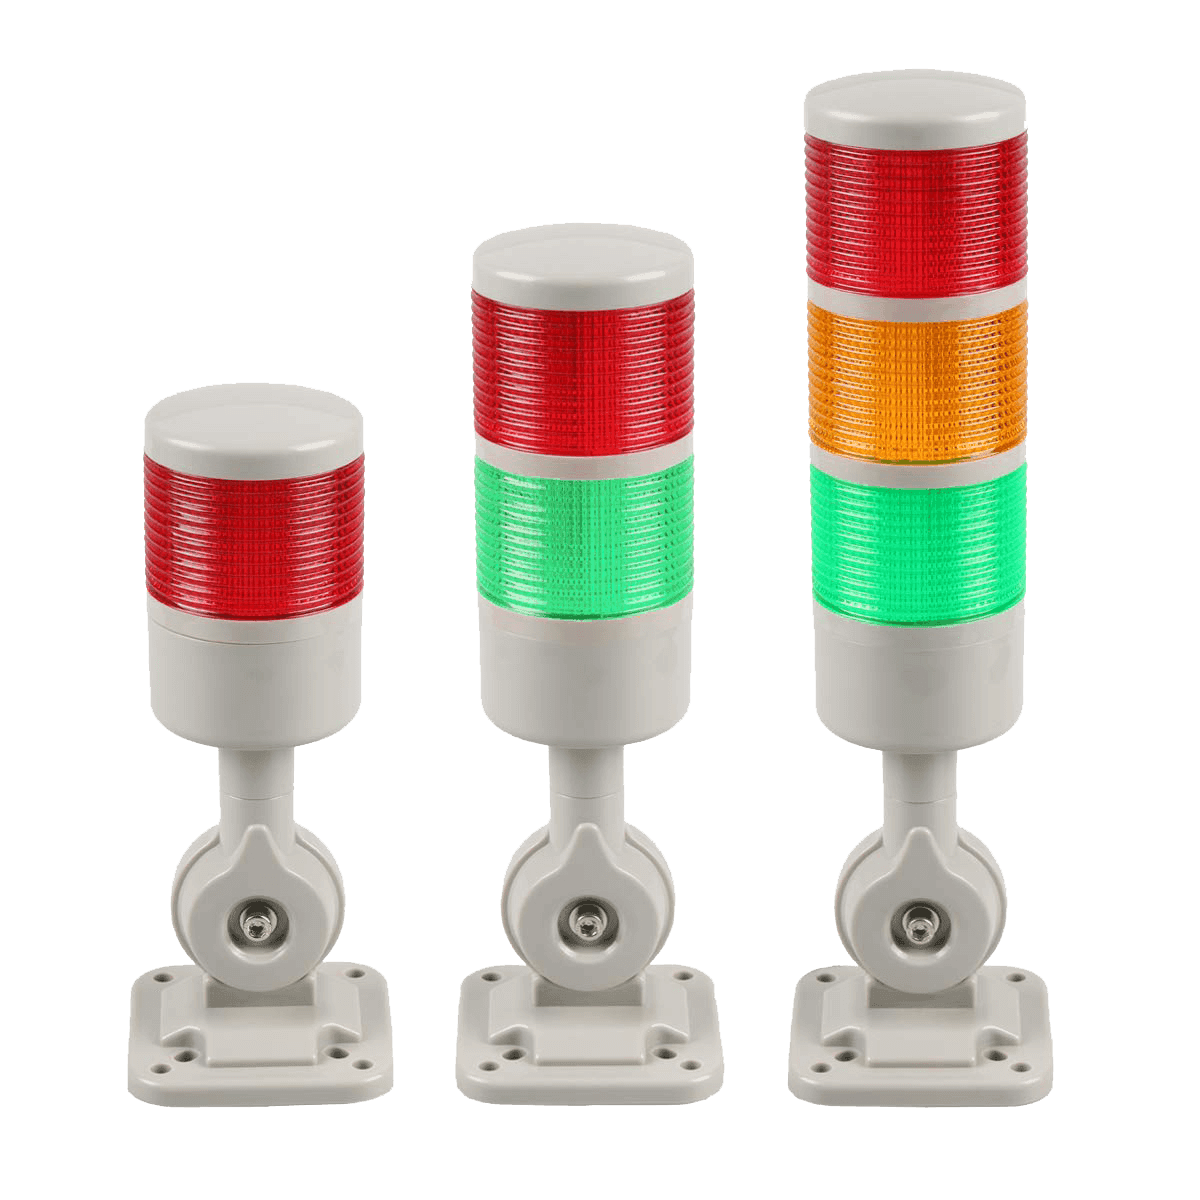
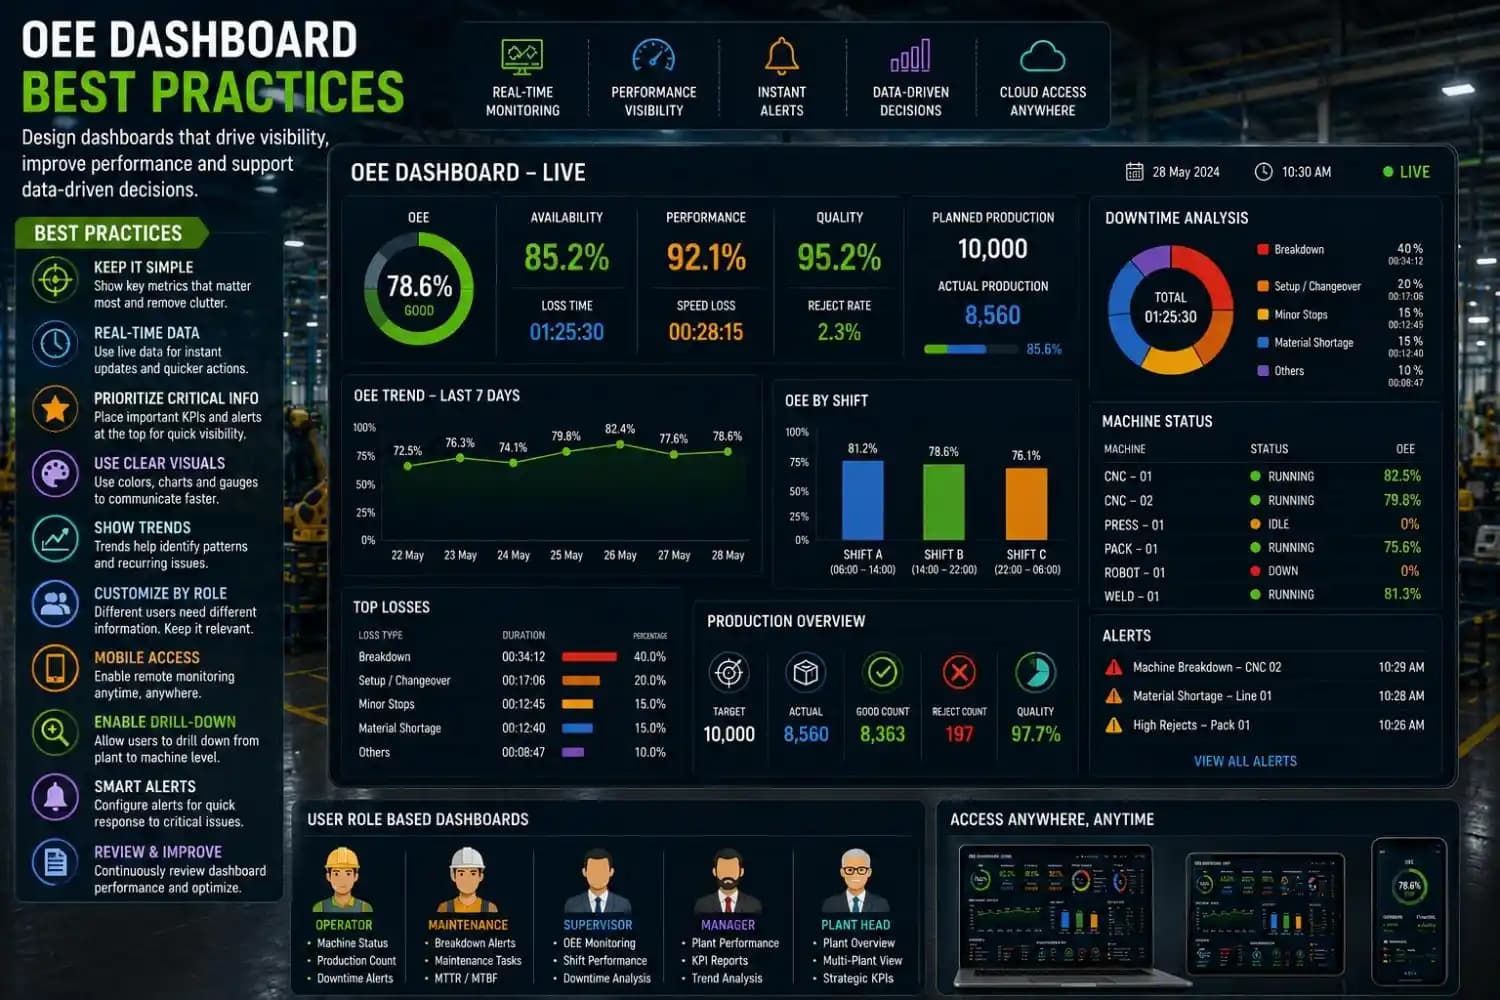
Manufacturing success depends on making the right decisions at the right time. However, making informed decisions is difficult when production data is scattered across spreadsheets, manual reports, and disconnected systems. Production managers, maintenance engineers, supervisors, and plant heads require instant access to accurate manufacturing information to keep production running efficiently. This is where an OEE Dashboard becomes an essential tool.
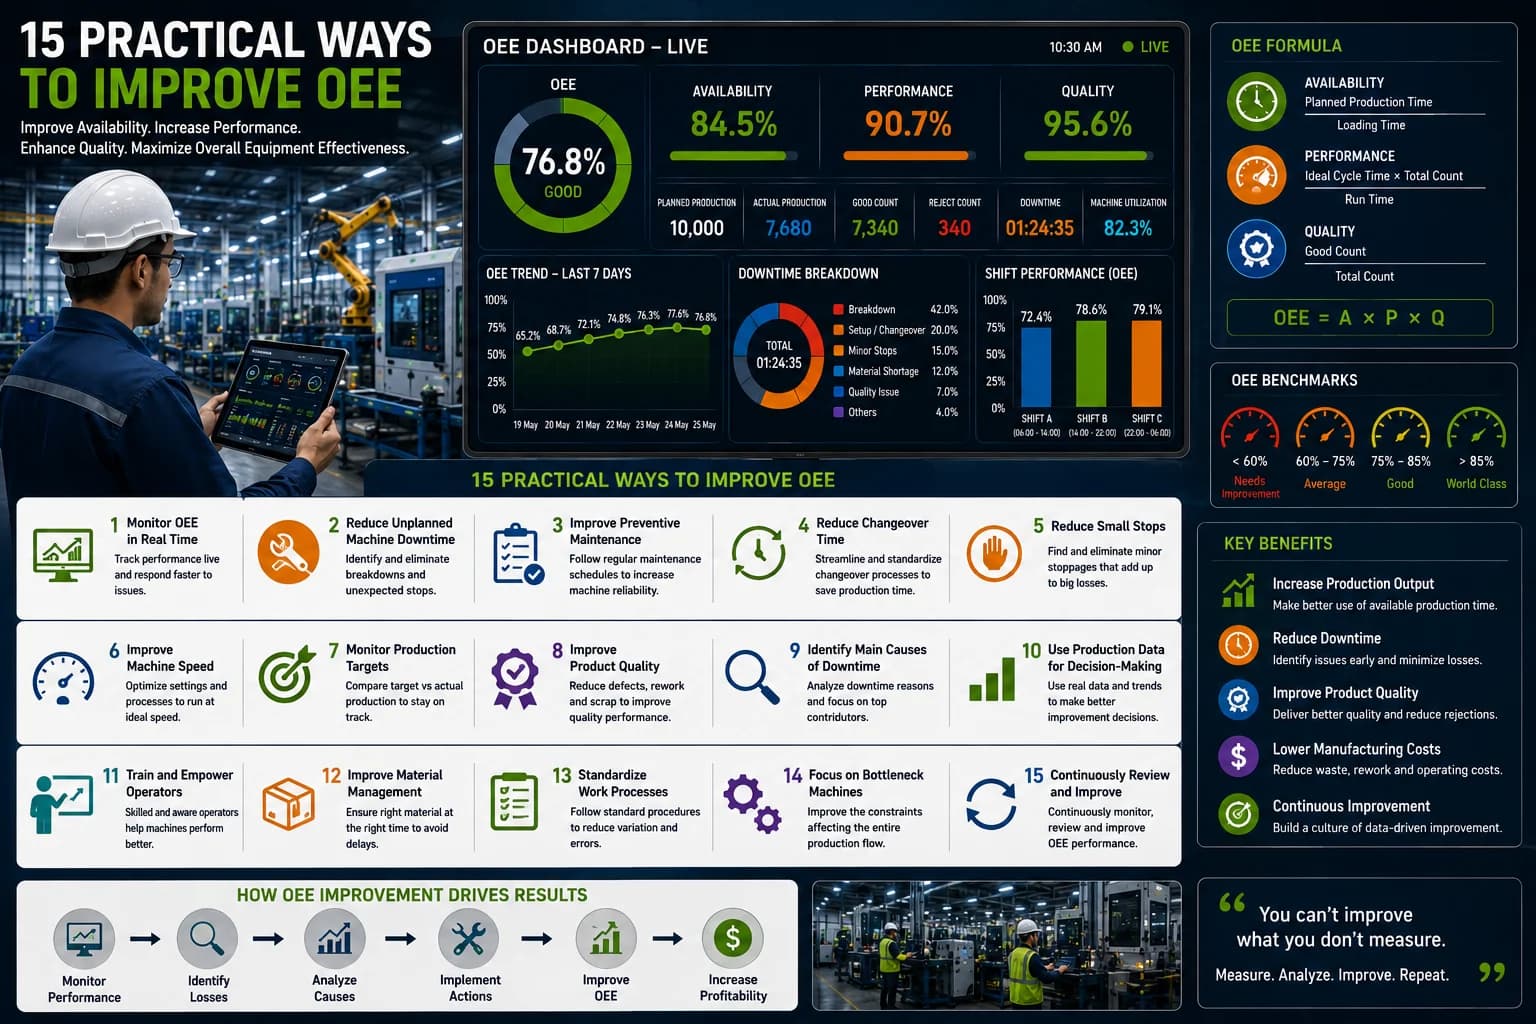
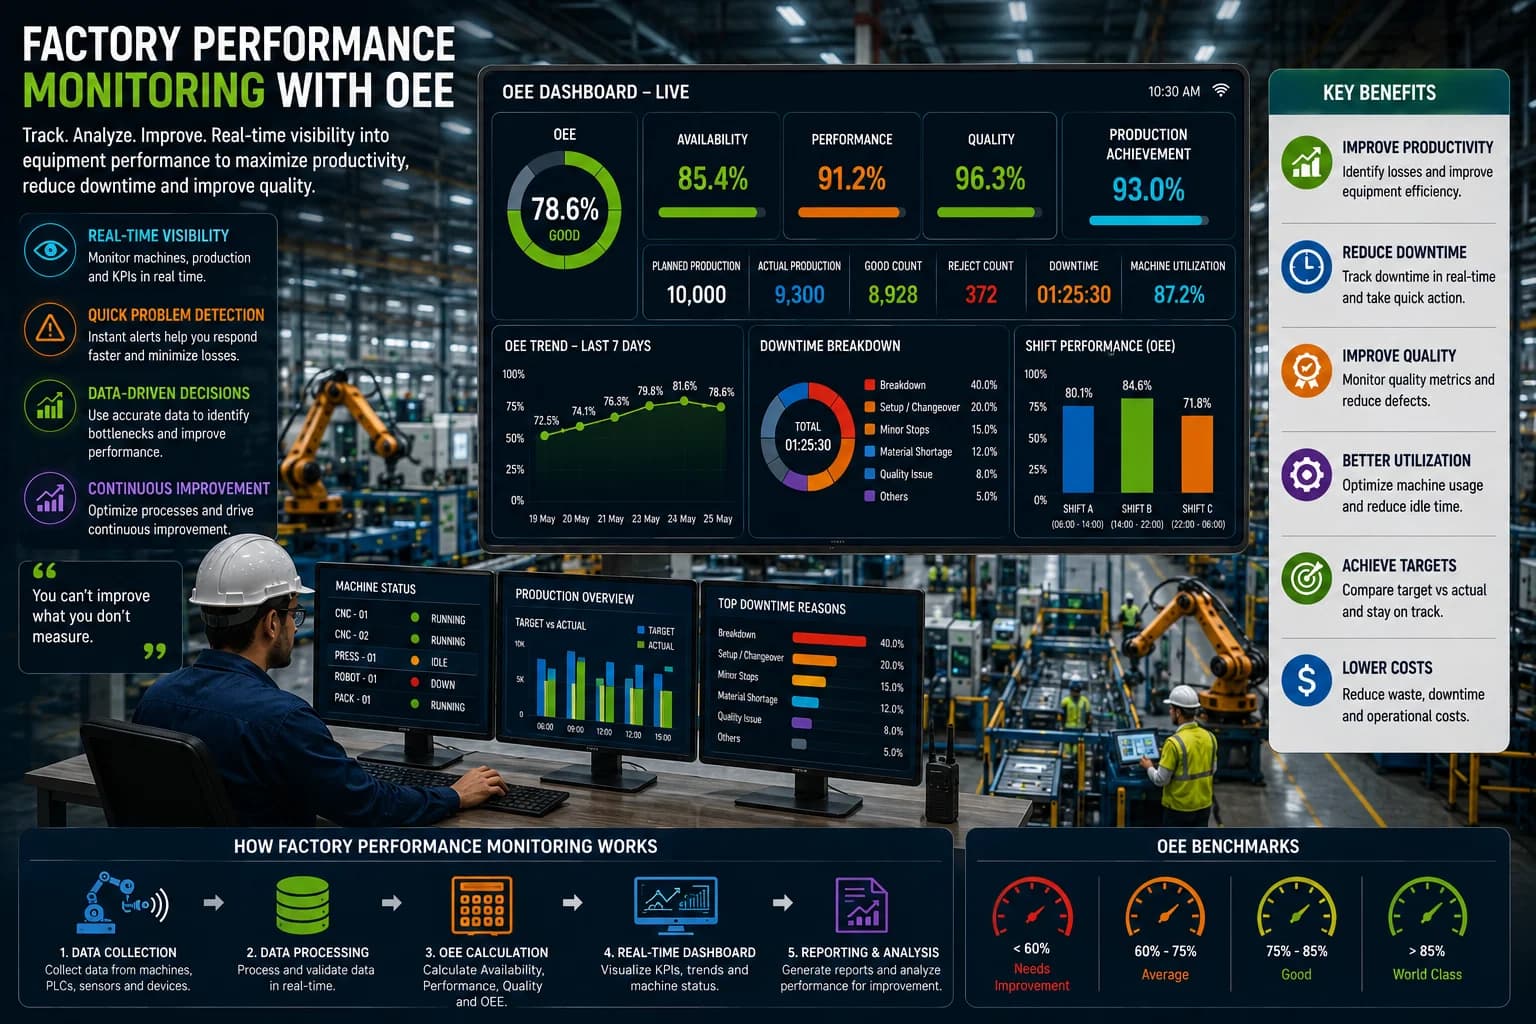
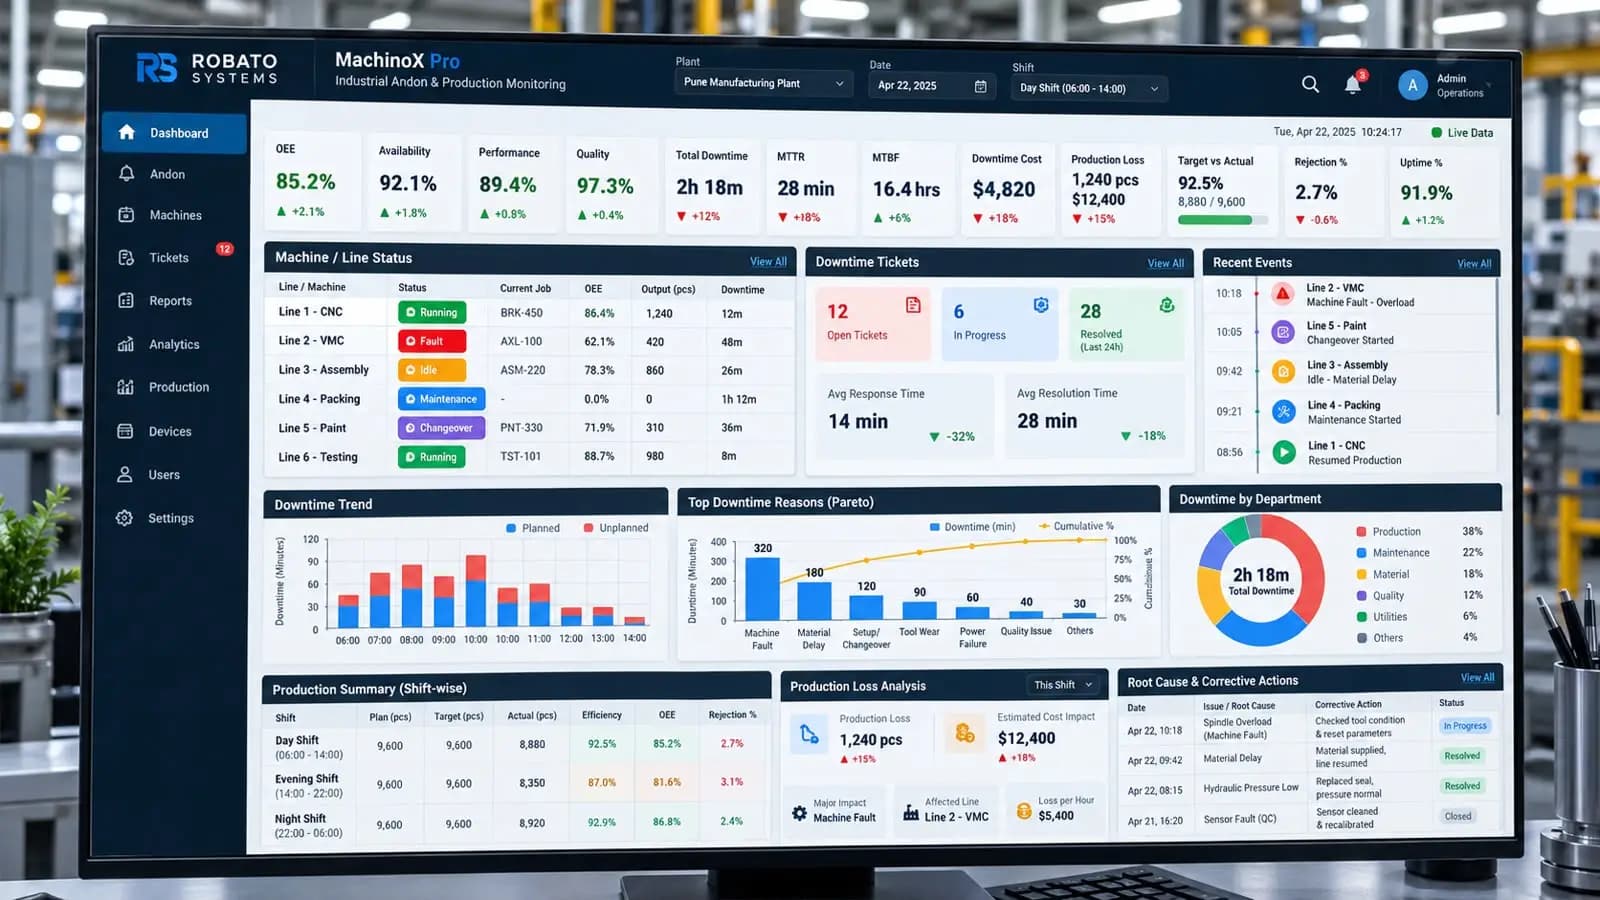
An OEE Dashboard provides a centralized, real-time view of Overall Equipment Effectiveness (OEE) and other critical manufacturing metrics. Instead of waiting until the end of a shift or the end of the day to analyze reports, manufacturers can continuously monitor machine availability, production performance, quality, downtime, and utilization through interactive visual dashboards. This enables faster responses to production issues, reduces equipment downtime, and improves overall operational efficiency.
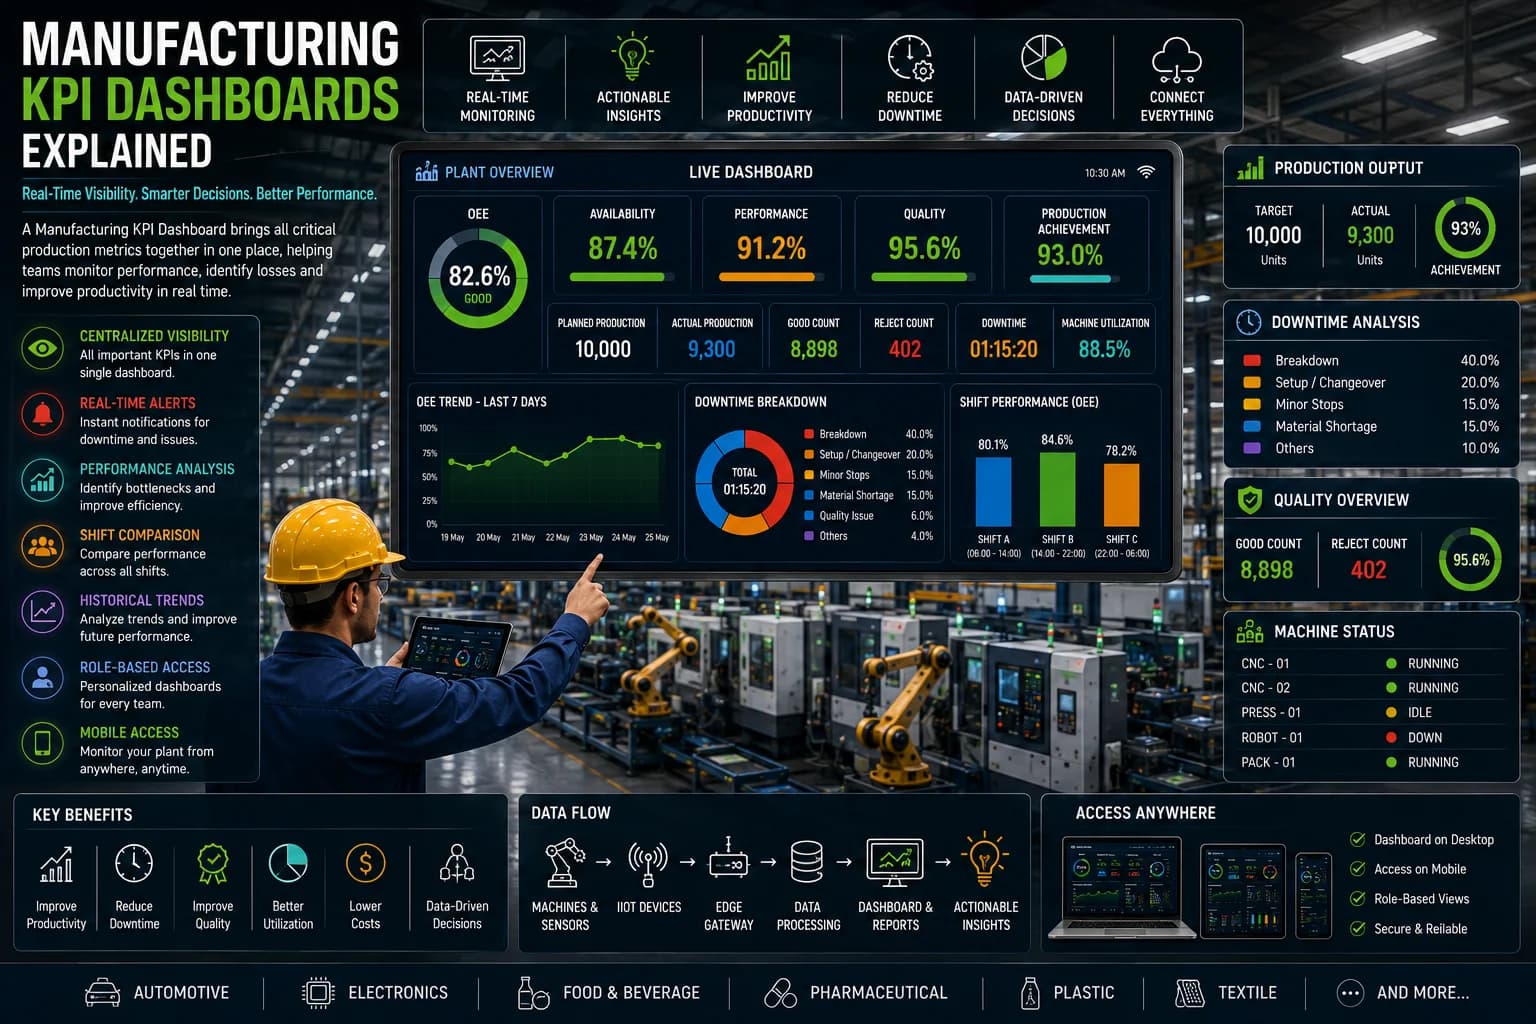
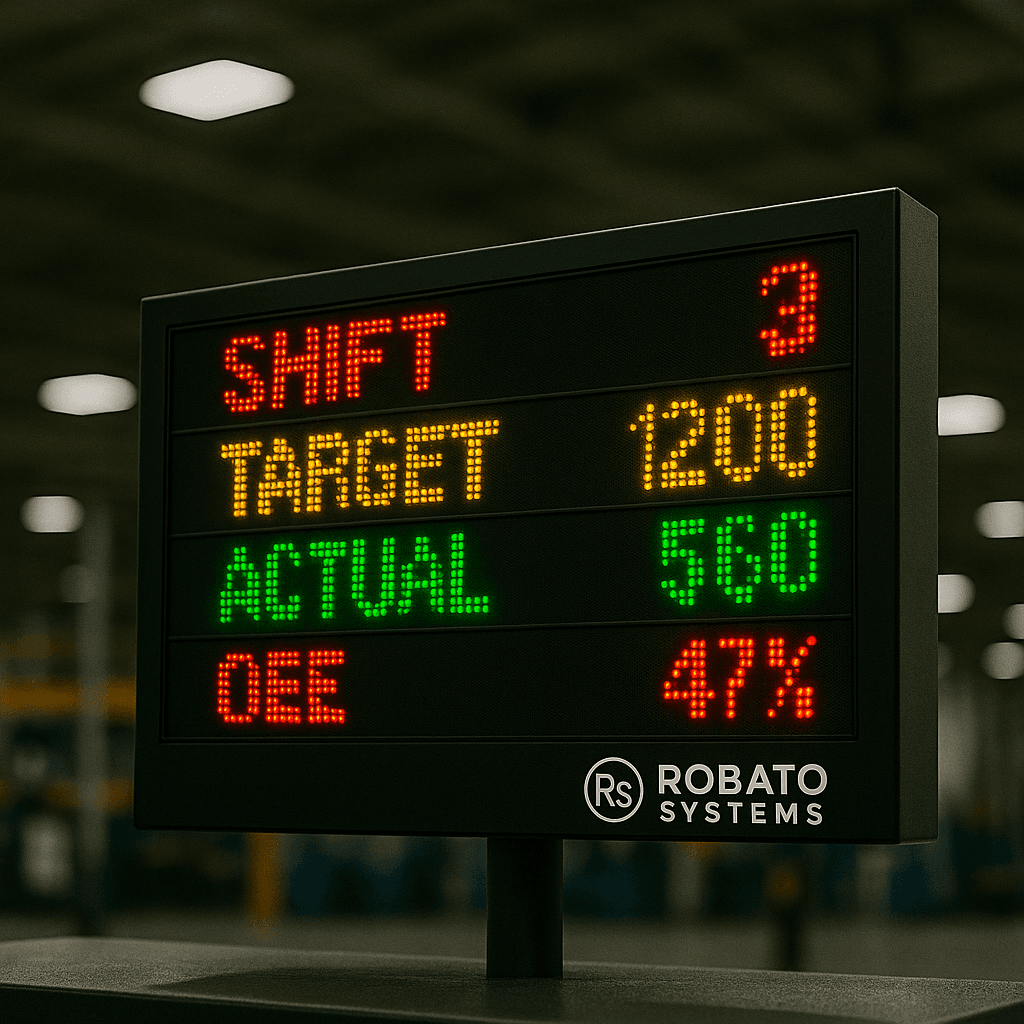
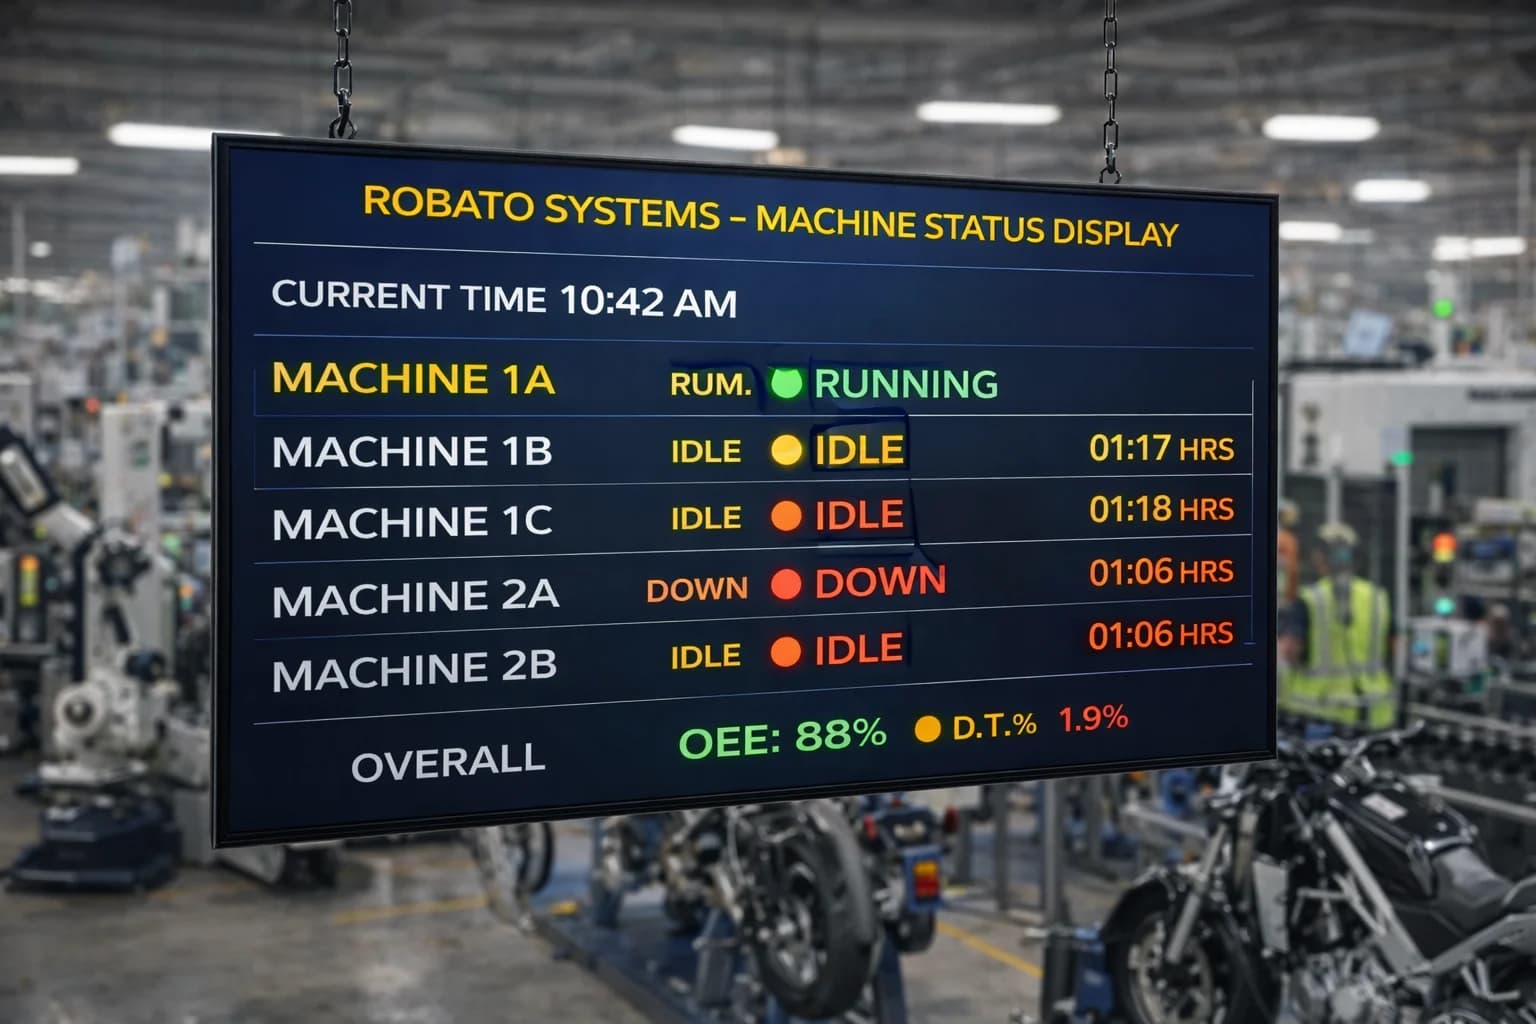
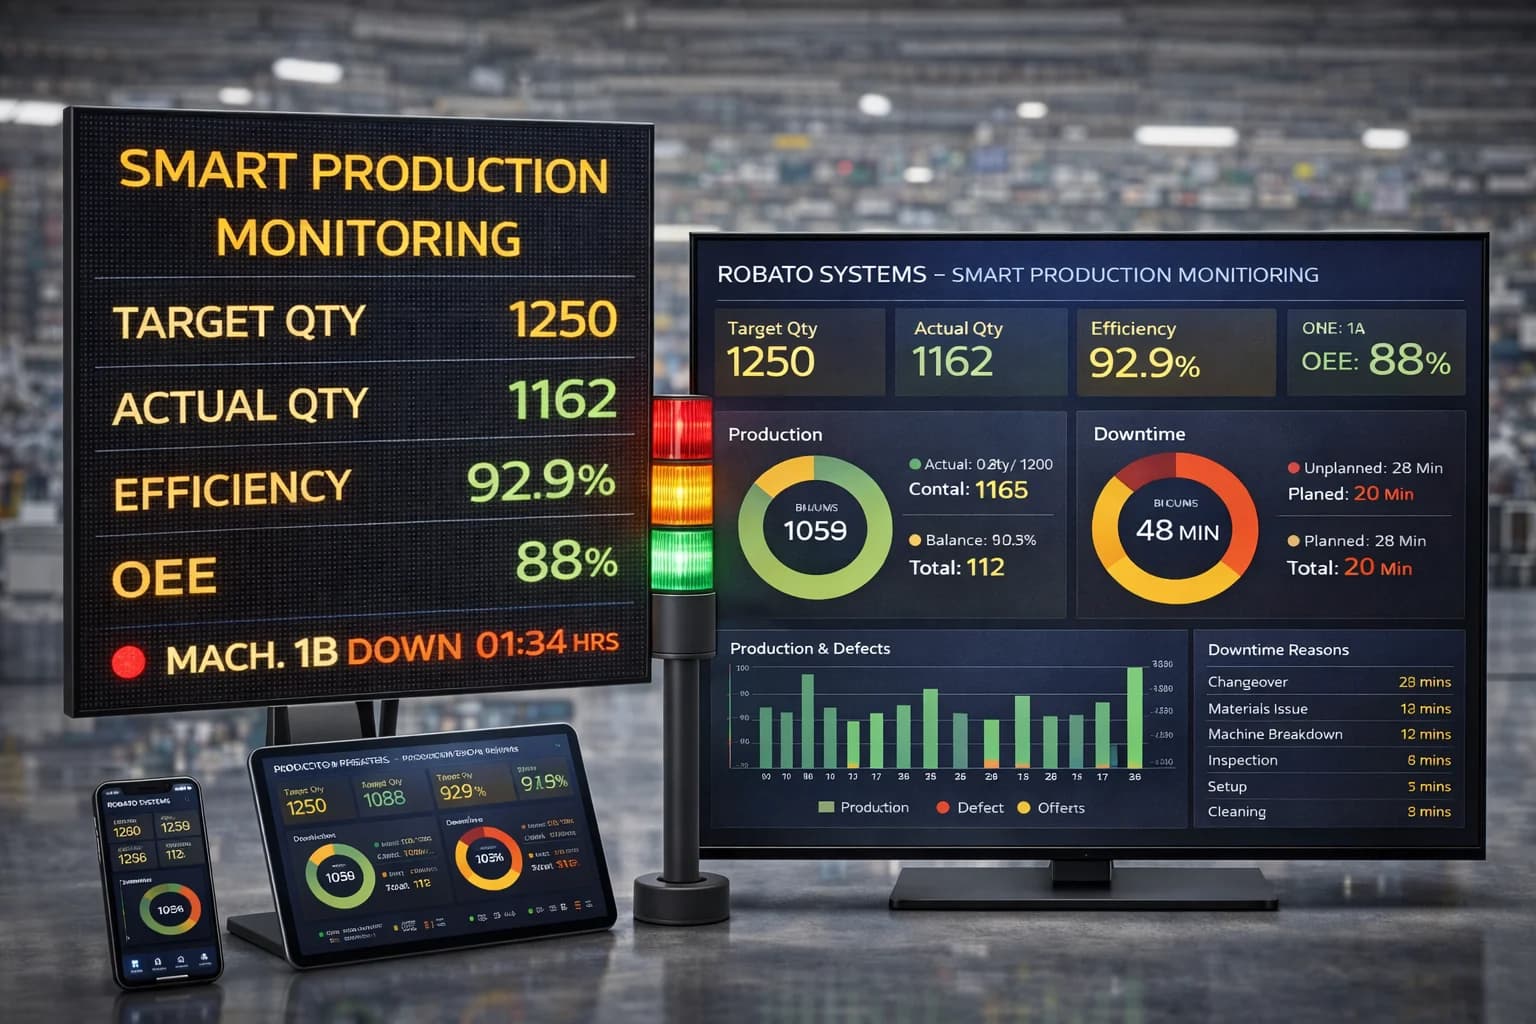
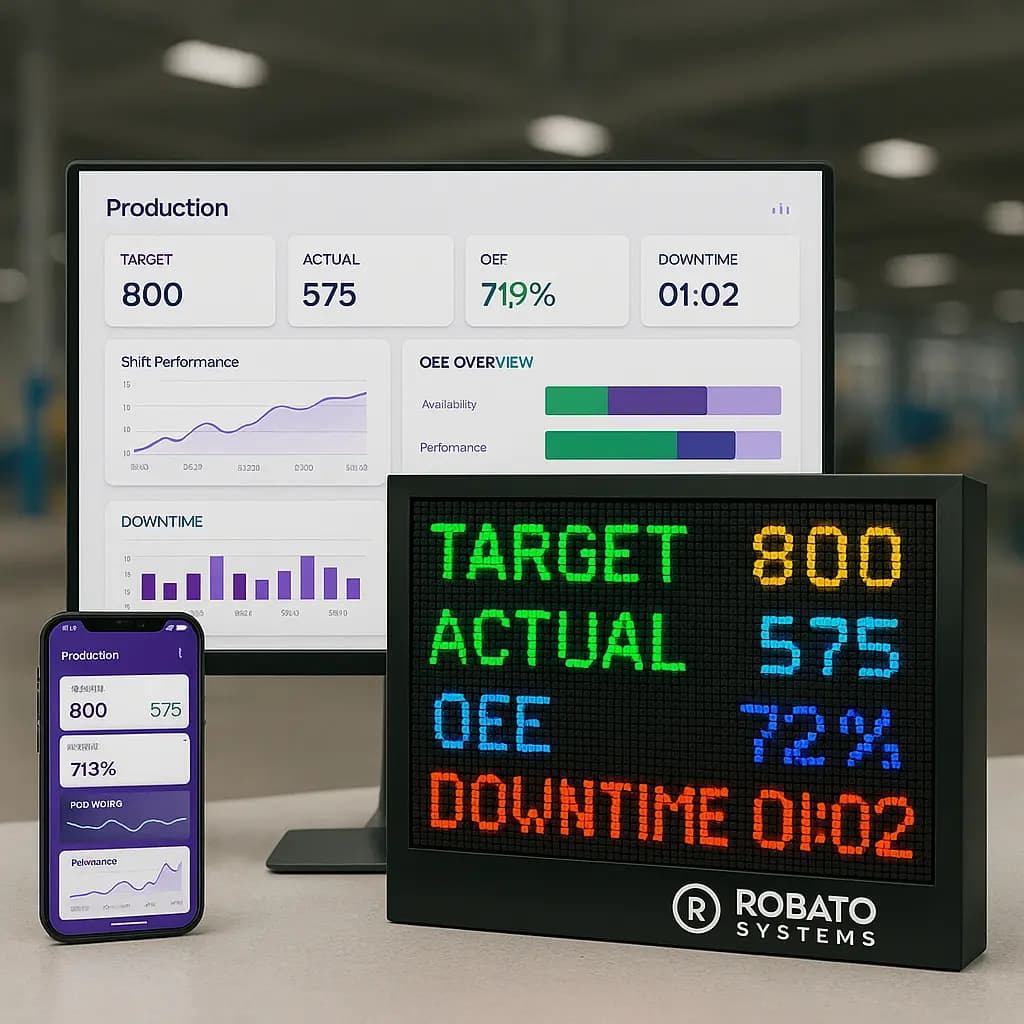
A well-designed OEE Dashboard is more than a collection of charts and graphs. It serves as a decision-support system that transforms production data into actionable insights. Whether displayed on large shop floor screens, desktop computers, tablets, or mobile devices, an effective dashboard helps every stakeholder—from machine operators to plant managers—understand the current production status and take immediate corrective action.
What is an OEE Dashboard?
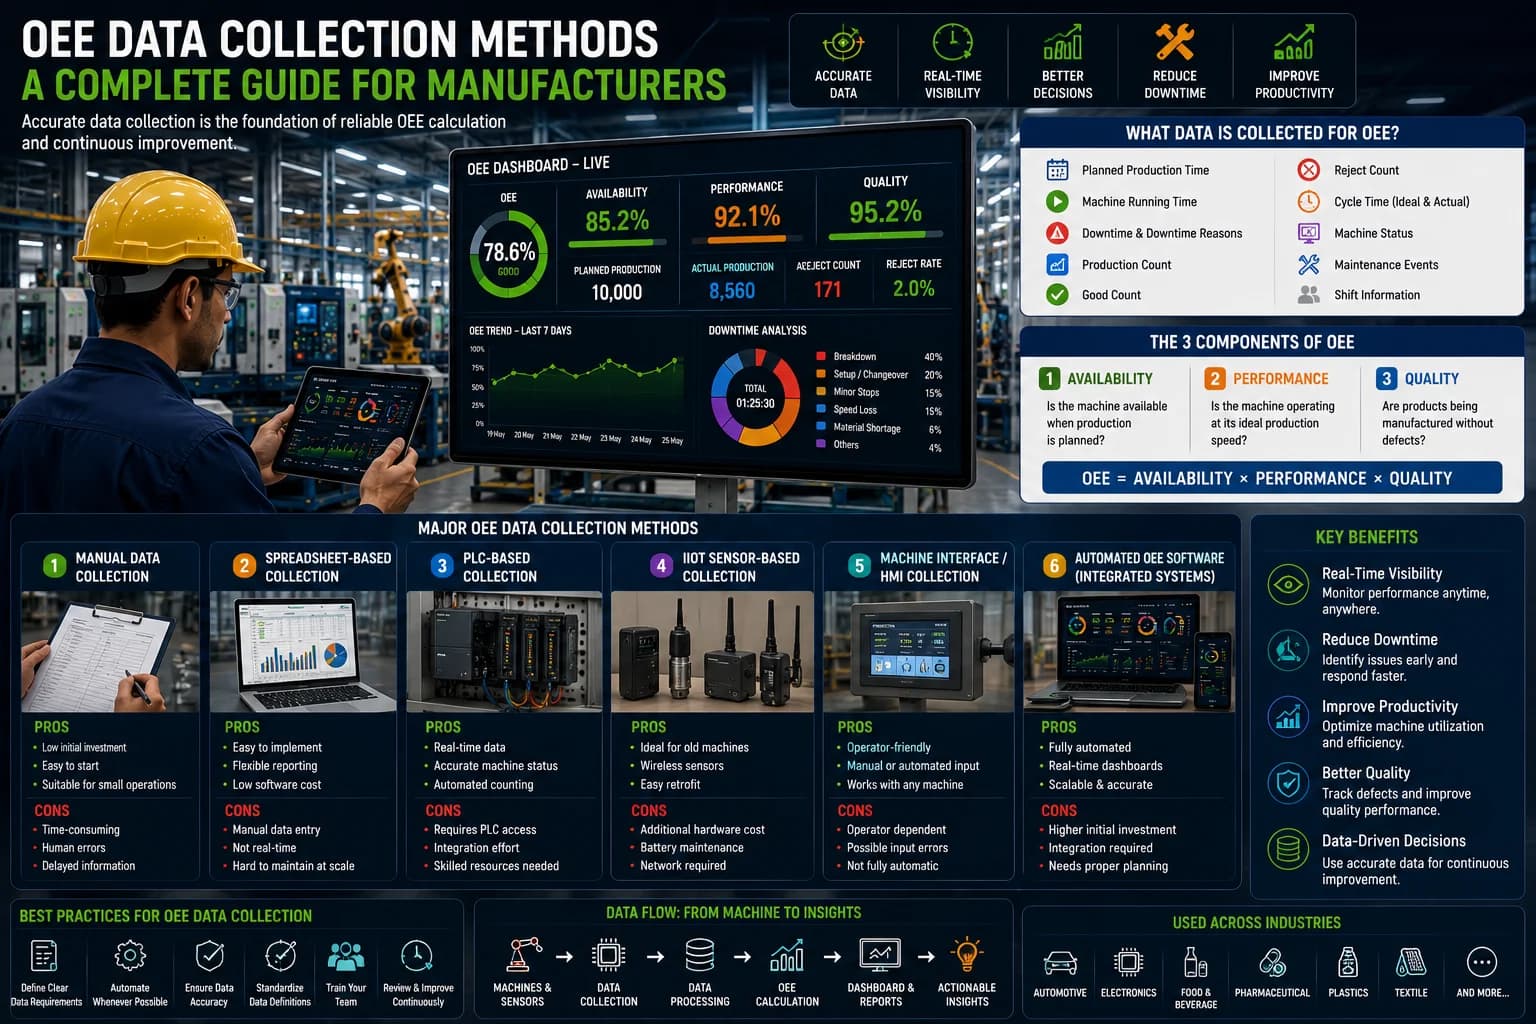
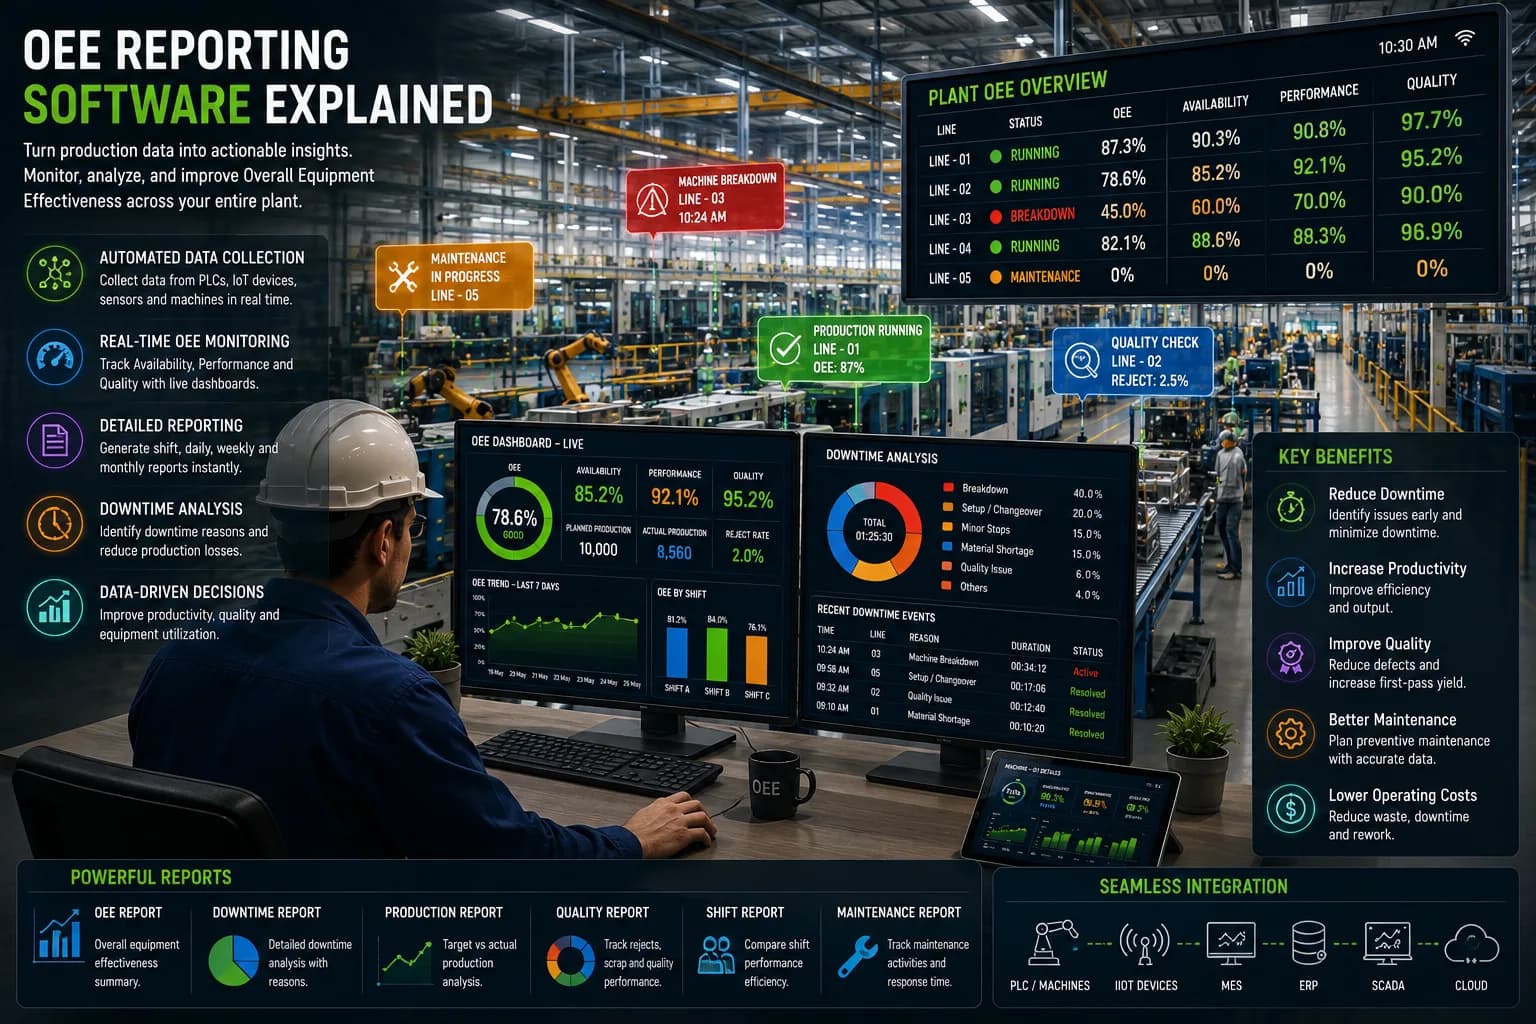
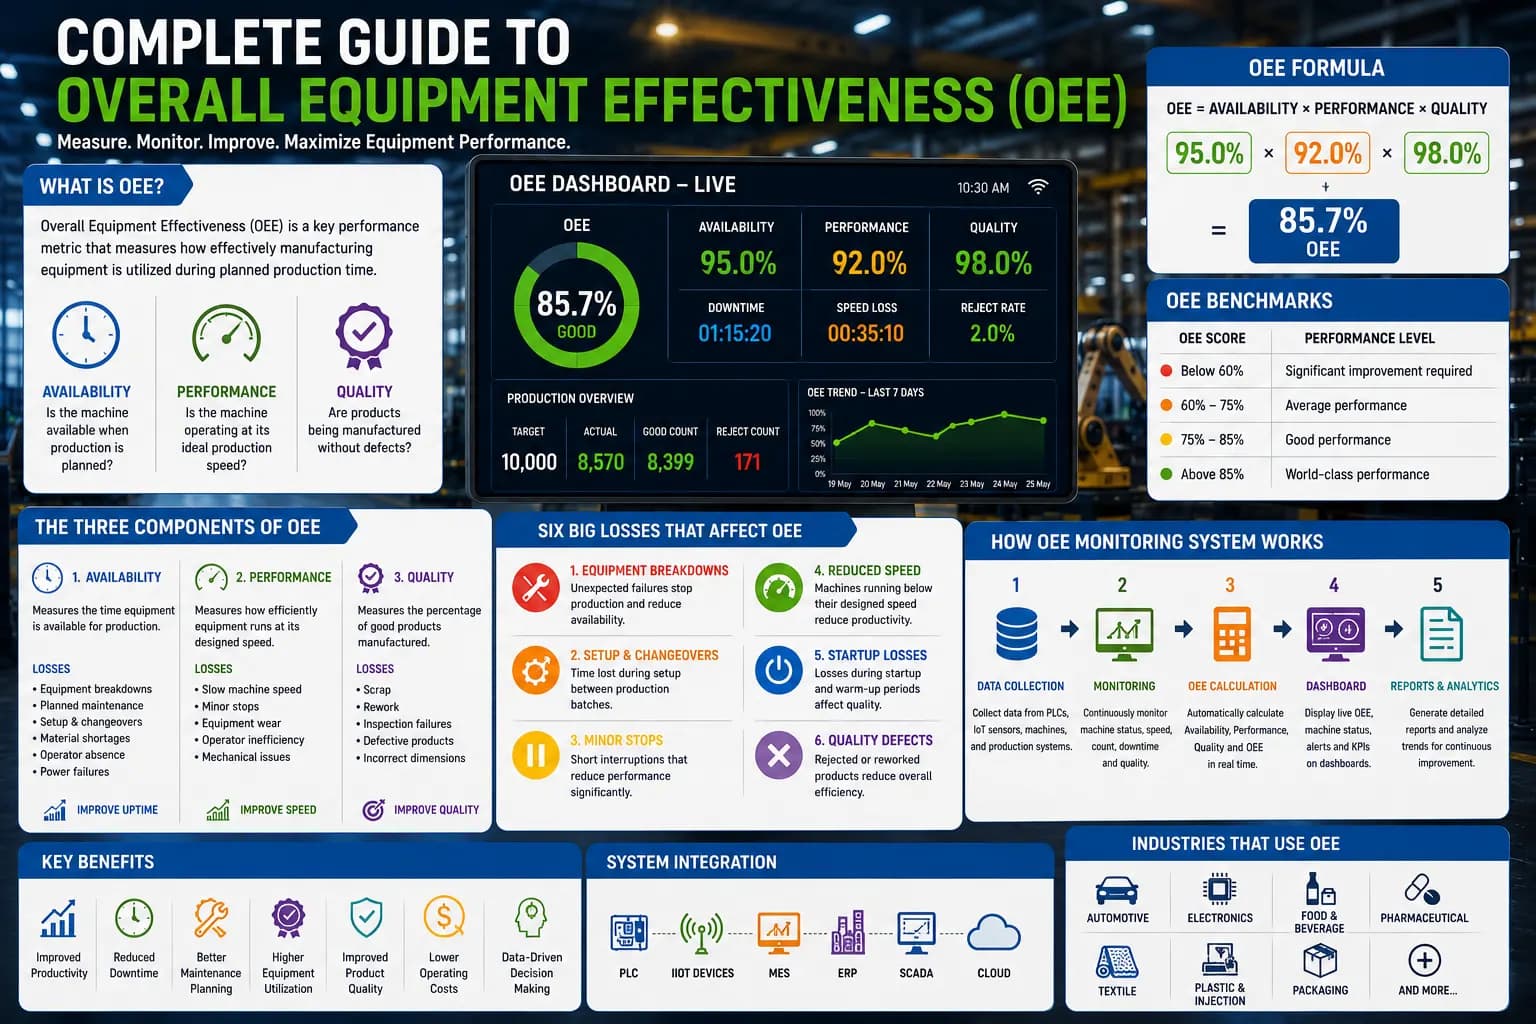
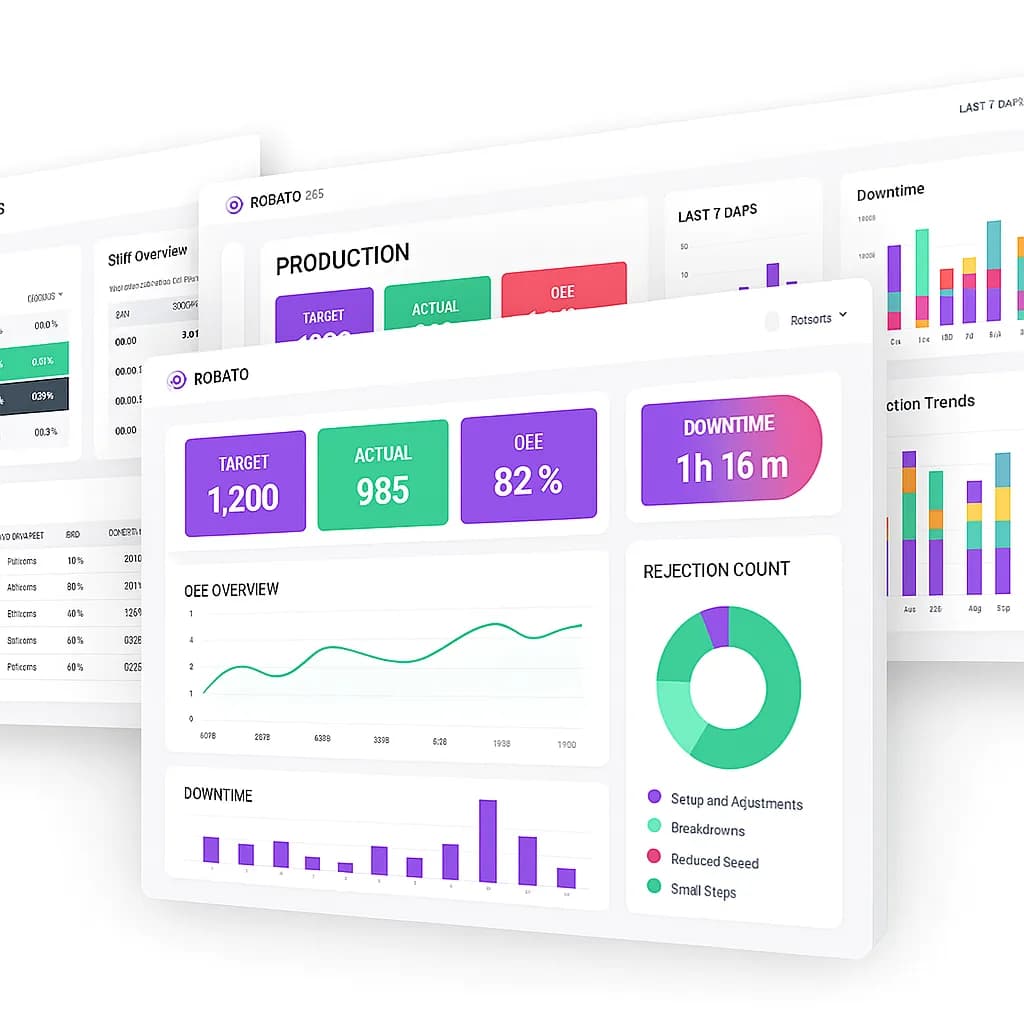
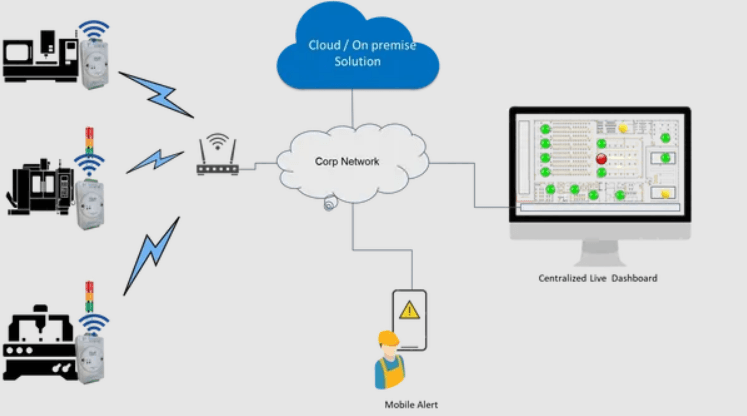
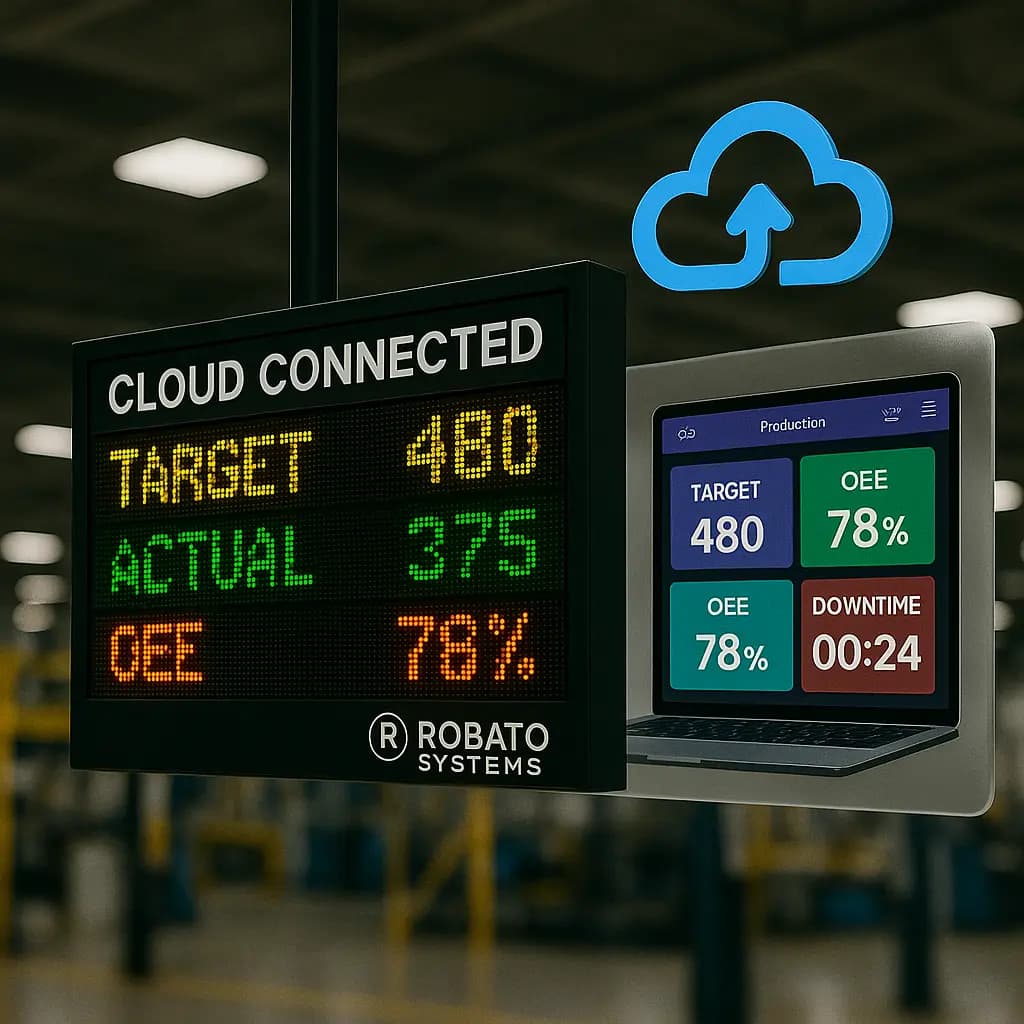
An OEE Dashboard is a visual interface that displays real-time and historical data related to Overall Equipment Effectiveness (OEE). It collects production information from machines, PLCs, Industrial Internet of Things (IIoT) devices, sensors, and manufacturing software, then presents it in an easy-to-understand format using charts, gauges, graphs, tables, and performance indicators.
The dashboard enables manufacturers to monitor:
- Machine availability
- Production performance
- Product quality
- Overall Equipment Effectiveness
- Downtime
- Machine utilization
- Production targets
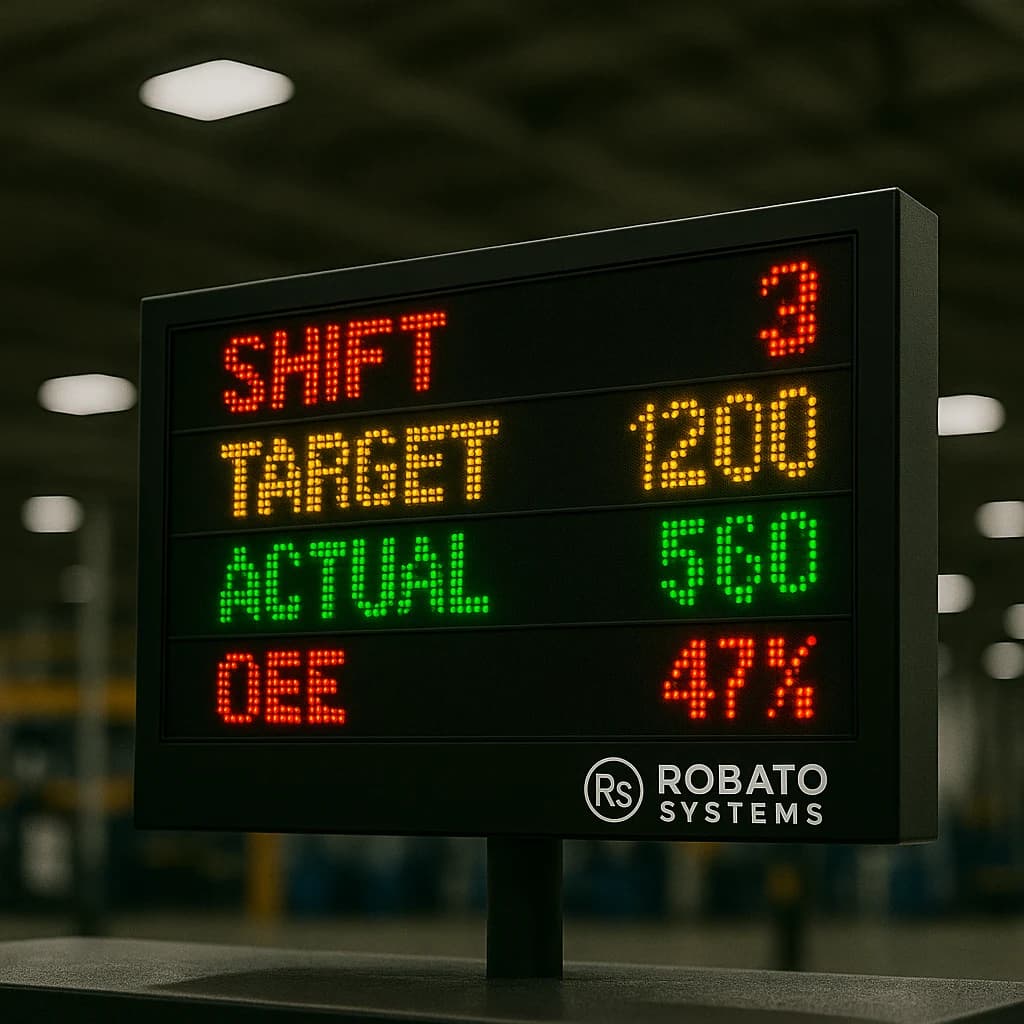
- Shift performance
- Maintenance status
- Factory KPIs
Instead of manually compiling production reports, managers receive live updates that support immediate decision-making.
Why Every Manufacturing Plant Needs an OEE Dashboard
Many factories still rely on paper-based production records or spreadsheets that only provide historical information. While these reports are useful for reviewing past performance, they do not help teams react to issues as they occur.
An OEE Dashboard solves this problem by providing:
- Real-time production visibility
- Faster issue detection
- Live machine monitoring
- Better maintenance coordination
- Improved production planning
- Accurate KPI tracking
- Better communication between departments
- Continuous performance monitoring
By making production information accessible to everyone, manufacturers can reduce delays and improve operational efficiency.
Core Components of an OEE Dashboard
An effective OEE Dashboard should provide a complete overview of manufacturing performance.
Availability Monitoring
Track machine uptime and identify equipment that is unavailable due to breakdowns, maintenance, changeovers, or other production interruptions.
Display metrics such as:
- Machine uptime
- Downtime duration
- Planned downtime
- Unplanned downtime
- Availability percentage
Performance Monitoring
Measure how efficiently machines operate compared to their ideal production speed.
Include:
- Actual production rate
- Target production rate
- Cycle time
- Production efficiency
- Machine speed
Quality Monitoring
Track product quality by displaying:
- Good parts produced
- Reject count
- Scrap percentage
- Rework quantity
- Quality percentage
Overall Equipment Effectiveness
Display the overall OEE percentage for:
- Individual machines
- Production lines
- Manufacturing cells
- Entire plants
This provides a quick overview of equipment efficiency across the factory.
Additional KPIs to Include
Although OEE is the primary metric, an effective dashboard should also include supporting KPIs.
Machine Utilization
Monitor:
- Running hours
- Idle time
- Utilization percentage
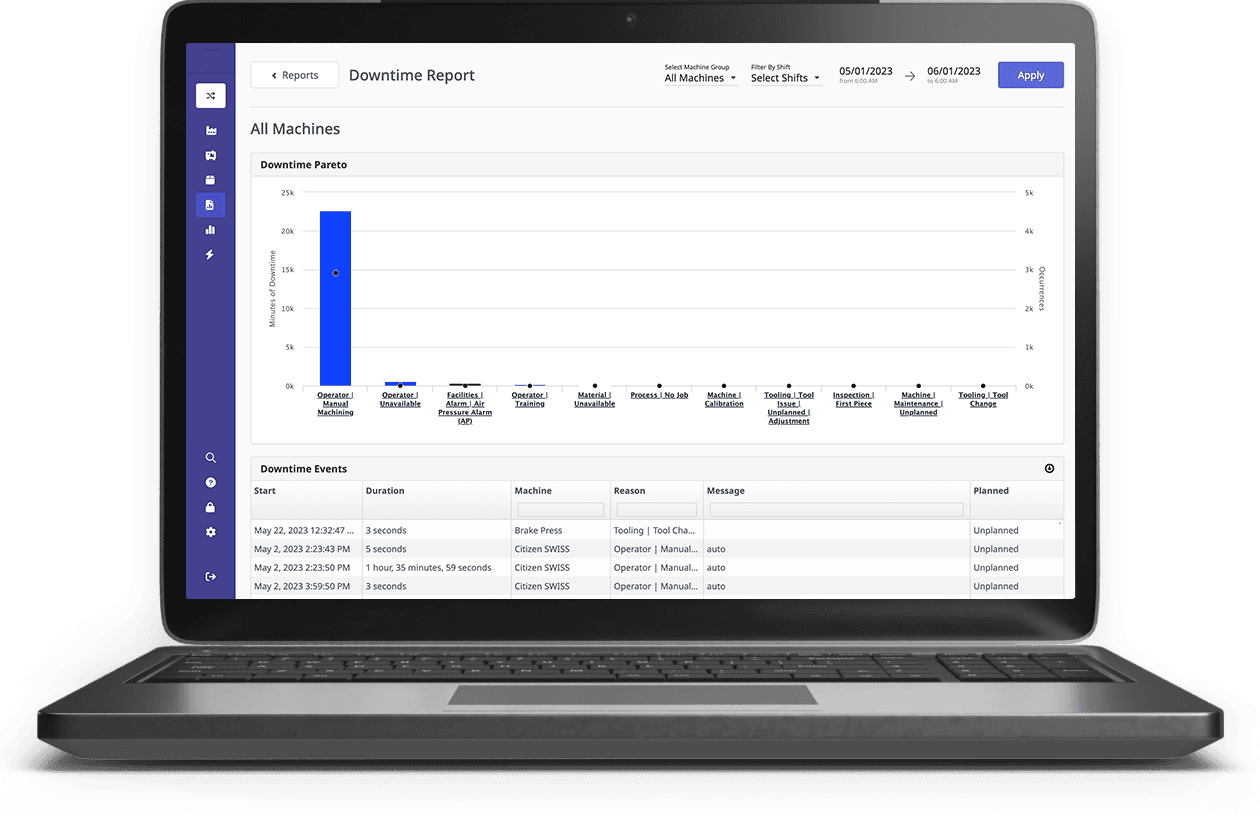
Downtime Analysis
Display:
- Breakdown frequency
- Downtime causes
- Average repair time
- Downtime trends
Production Output
Show:
- Target vs Actual
- Units produced
- Remaining production
- Hourly output
Maintenance Performance
Track:
- Pending maintenance requests
- Active repairs
- Maintenance response time
- MTTR
- MTBF
Shift Performance
Compare:
- Shift-wise OEE
- Shift productivity
- Production efficiency
- Downtime by shift
Best Practices for Designing an OEE Dashboard
Keep the Dashboard Simple
Avoid displaying excessive information that overwhelms users.
Focus on the most important KPIs that support operational decisions.
Use Real-Time Data
Dashboards should update automatically without requiring manual data entry.
Real-time monitoring enables immediate corrective action.
Prioritize Critical Information
The most important metrics should appear at the top of the dashboard, including:
- OEE
- Machine status
- Active downtime
- Production target
- Current output
Use Clear Visual Indicators
Color coding improves visibility.
Example:
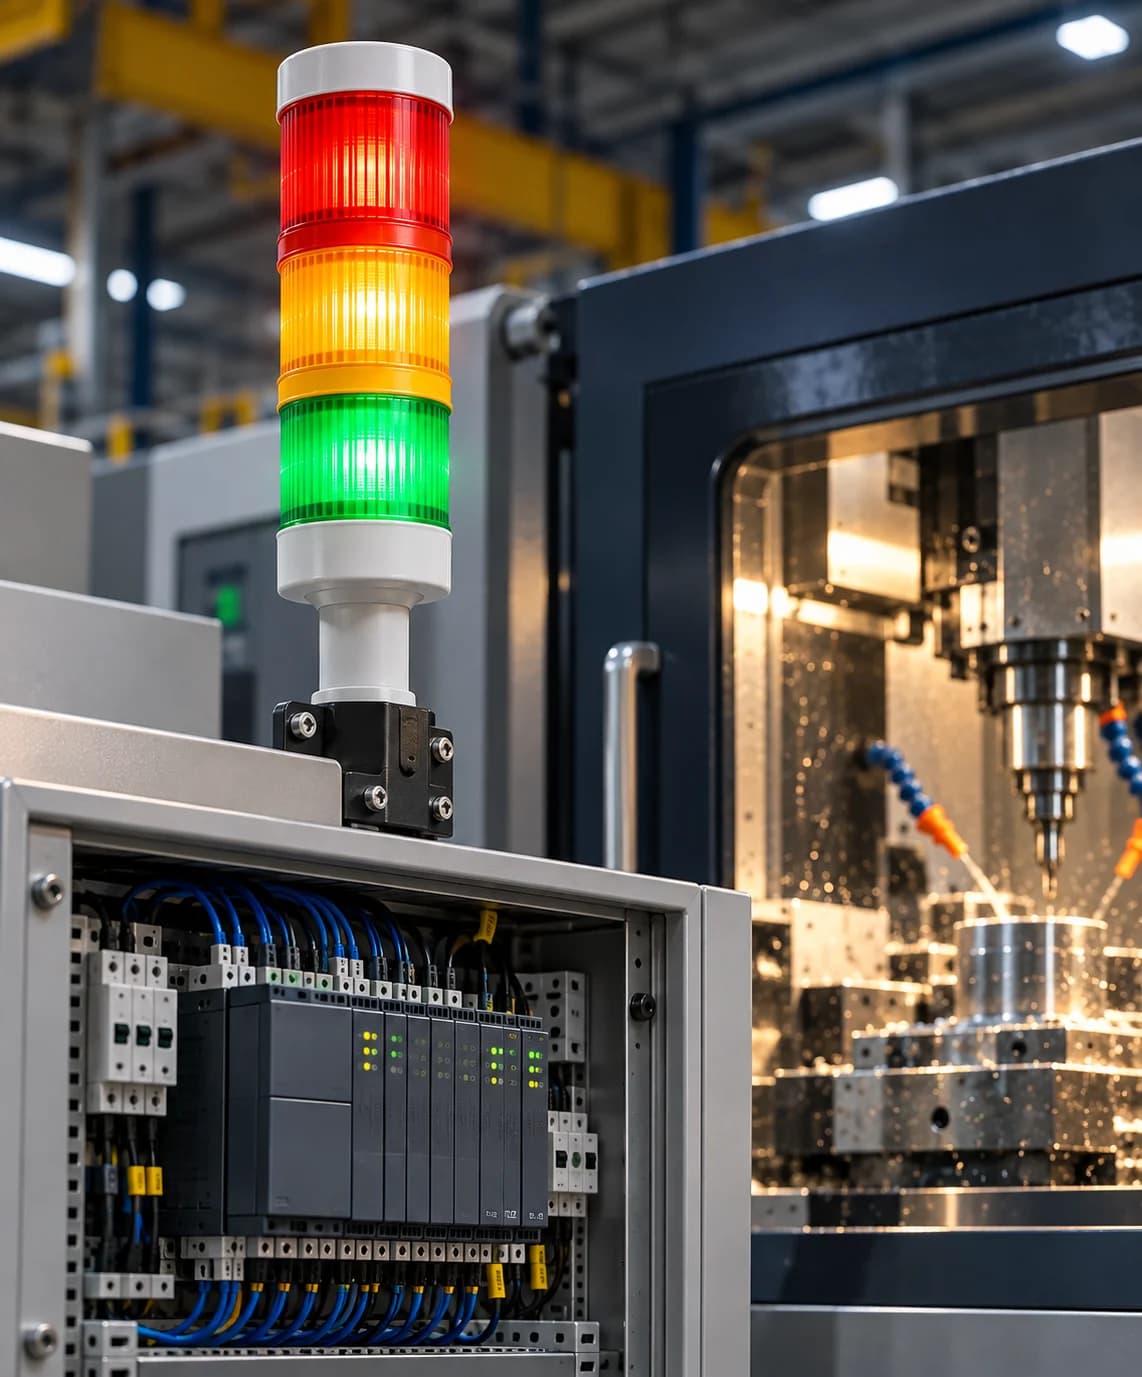
- Green = Normal operation
- Yellow = Warning
- Red = Critical issue
This helps users identify problems instantly.
Display Trends
Historical trend charts help identify recurring issues.
Examples include:
- Daily OEE trend
- Weekly downtime trend
- Monthly production trend
- Machine utilization history
Customize for Different Users
Different teams require different information.
Operators
Need:
- Machine status
- Production count
- Downtime alerts
Maintenance Teams
Need:
- Breakdown alerts
- Maintenance requests
- Equipment health
Production Managers
Need:
- OEE
- Shift performance
- Production targets
- Downtime reports
Plant Management
Need:
- Plant-wide KPIs
- Factory performance
- Multi-line comparison
- Financial impact
Support Mobile Access
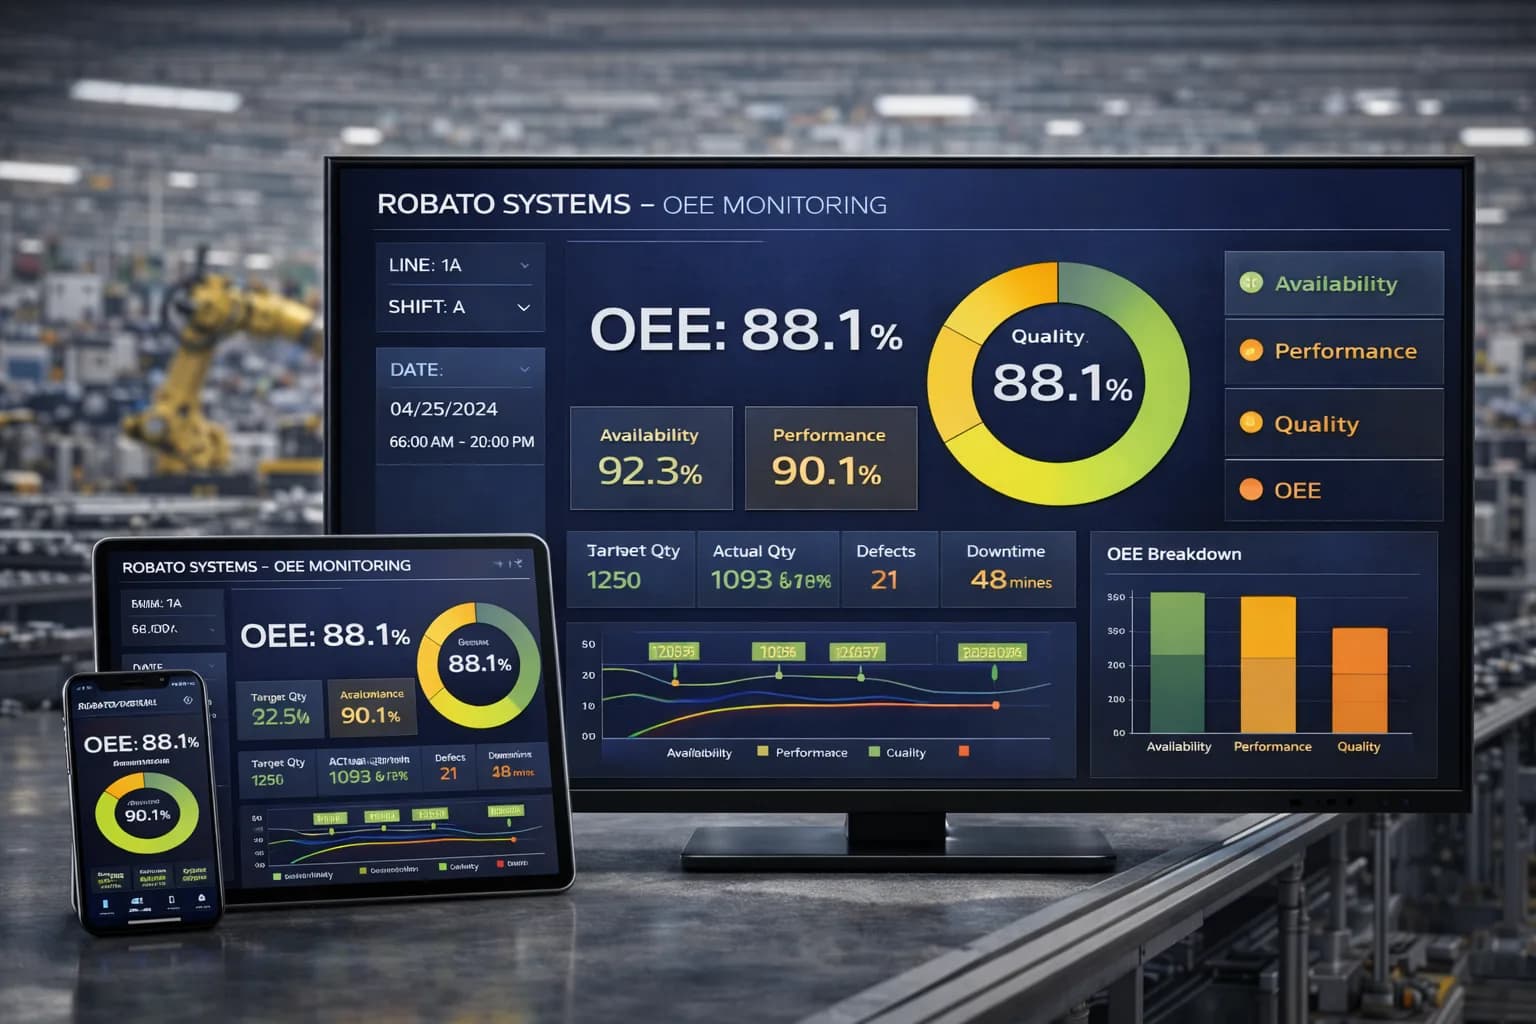
Managers should be able to monitor production remotely using smartphones and tablets.
Enable Drill-Down Analysis
Users should be able to click on a KPI and explore detailed information.
Example:
Plant OEE
↓
Production Line
↓
Machine
↓
Downtime Event
↓
Root Cause
Key Features of a Modern OEE Dashboard
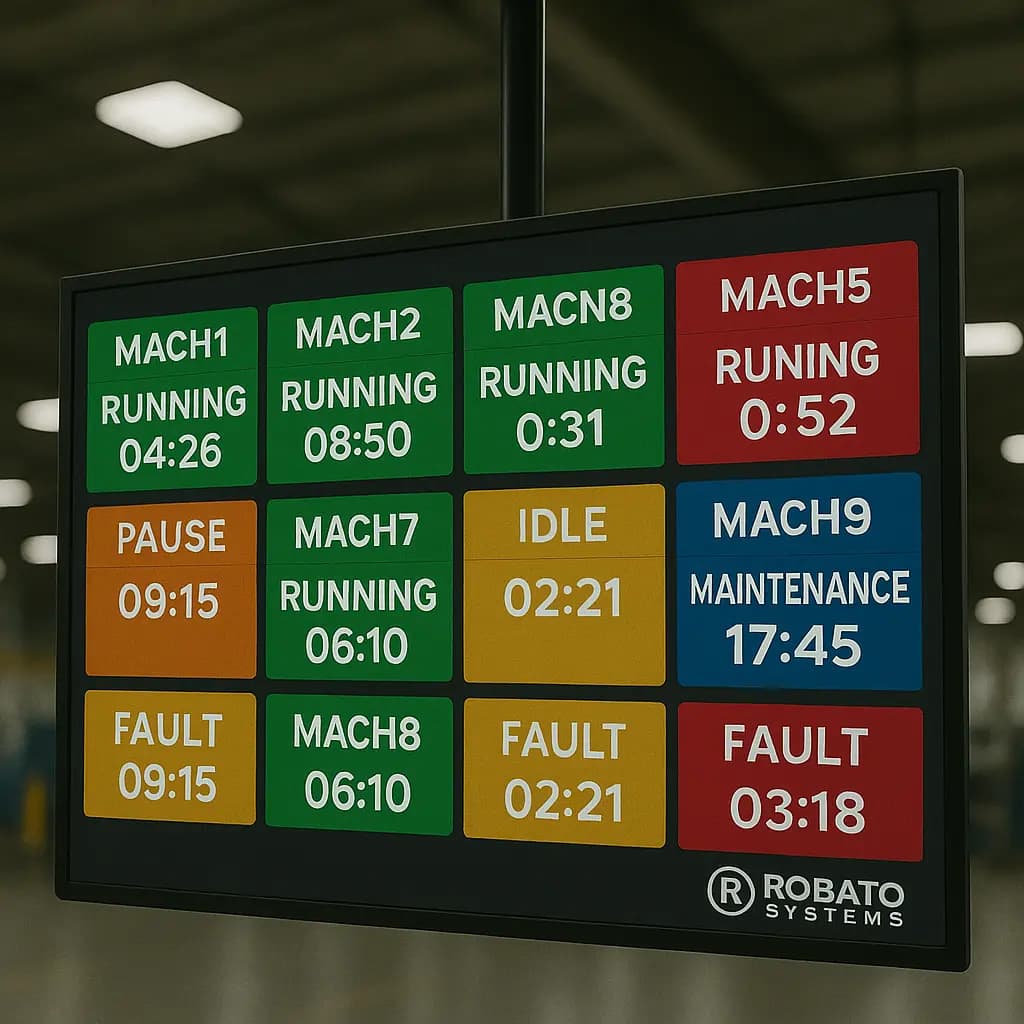
Live Machine Status
Monitor:
- Running
- Idle
- Breakdown
- Maintenance
- Setup
Real-Time OEE Calculation
Automatically calculate:
- Availability
- Performance
- Quality
- OEE
Production Dashboard
Display:
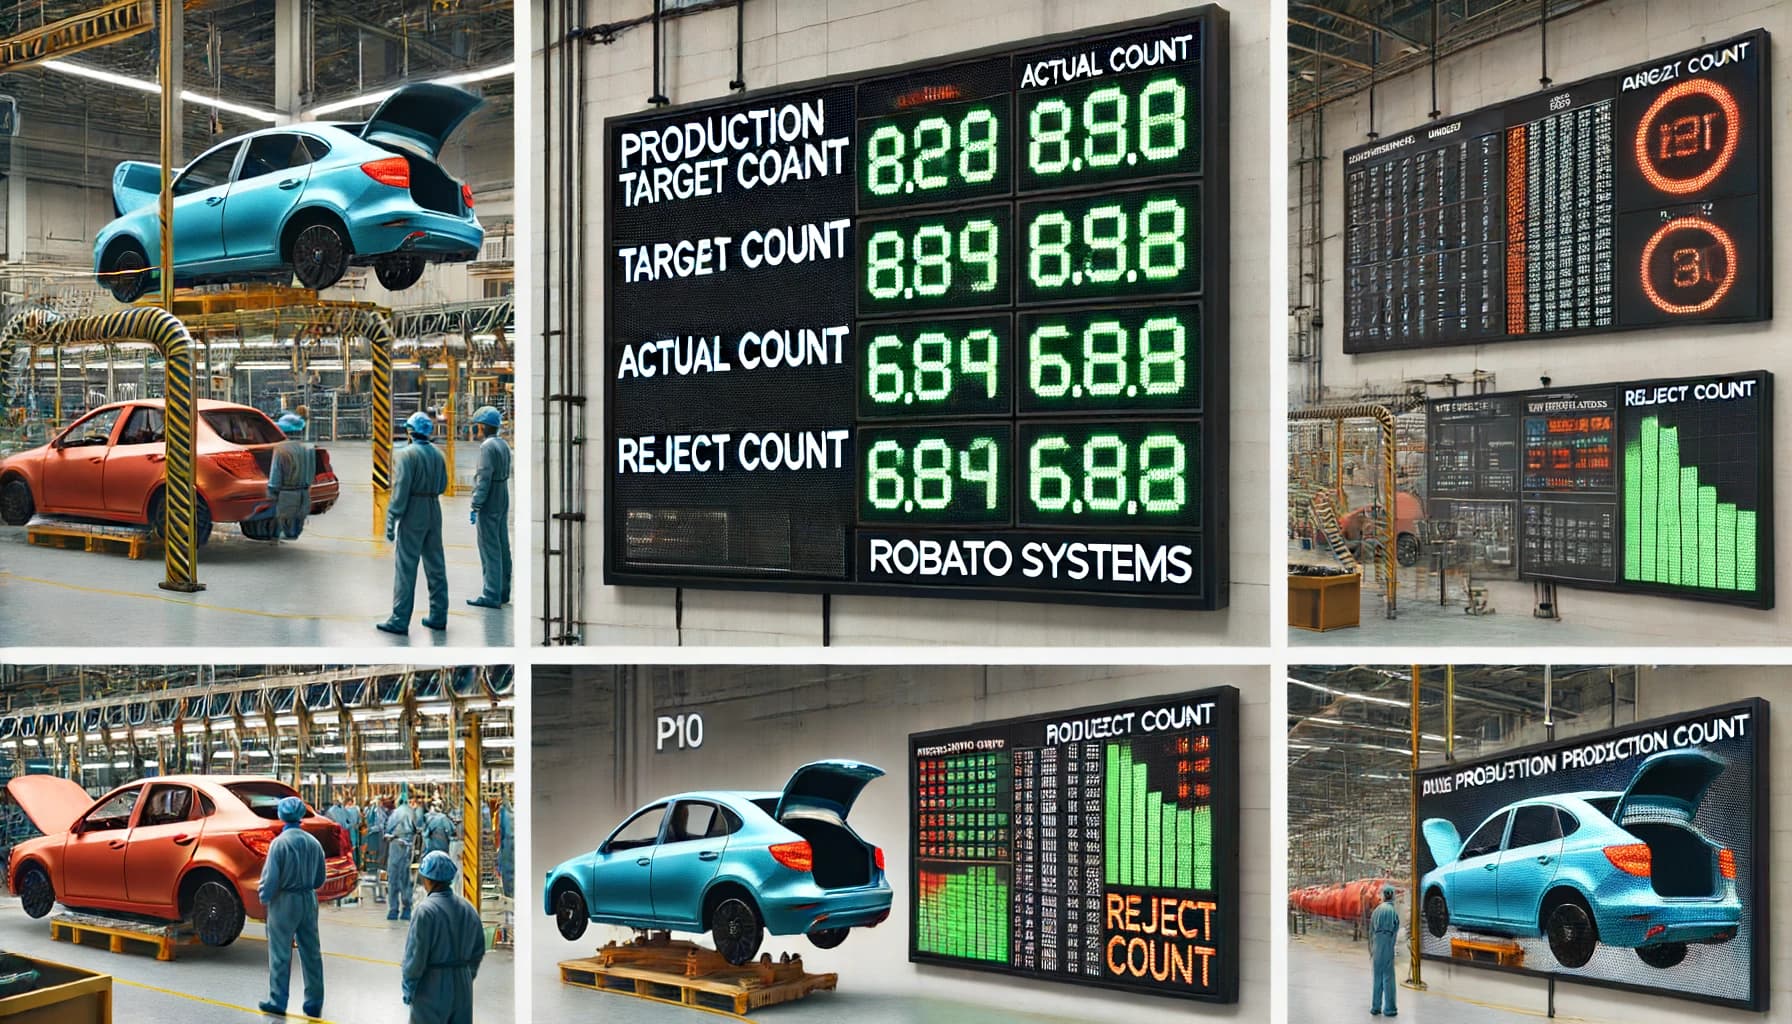
- Target vs Actual
- Production count
- Production efficiency
- Shift output
Downtime Dashboard
Track:
- Active downtime
- Breakdown history
- Downtime reasons
- Response time
Multi-Plant Dashboard
Monitor multiple manufacturing facilities from one interface.
Custom Reports
Generate:
- Daily reports
- Weekly reports
- Monthly reports
- OEE reports
- KPI reports
Cloud Dashboard
Access production information securely from anywhere.
Automated Notifications
Receive alerts for:
- Low OEE
- Machine breakdowns
- Production delays
- Maintenance requests
Benefits of an OEE Dashboard
Improved Production Visibility
Everyone works from the same real-time production data.
Faster Decision-Making
Managers can react immediately instead of waiting for reports.
Reduced Downtime
Real-time monitoring enables quicker maintenance response.
Higher Equipment Utilization
Identify idle equipment and improve asset usage.
Better Productivity
Track production performance continuously and eliminate bottlenecks.
Improved Product Quality
Monitor quality metrics and reduce defect rates.
Better Maintenance Planning
Use historical performance data to schedule preventive maintenance.
Lower Manufacturing Costs
Reducing downtime and increasing efficiency improves profitability.
Integration with Manufacturing Systems
A modern OEE Dashboard should integrate with:
- PLCs
- Industrial IoT (IIoT)
- MES
- ERP
- SCADA
- Production Monitoring Software
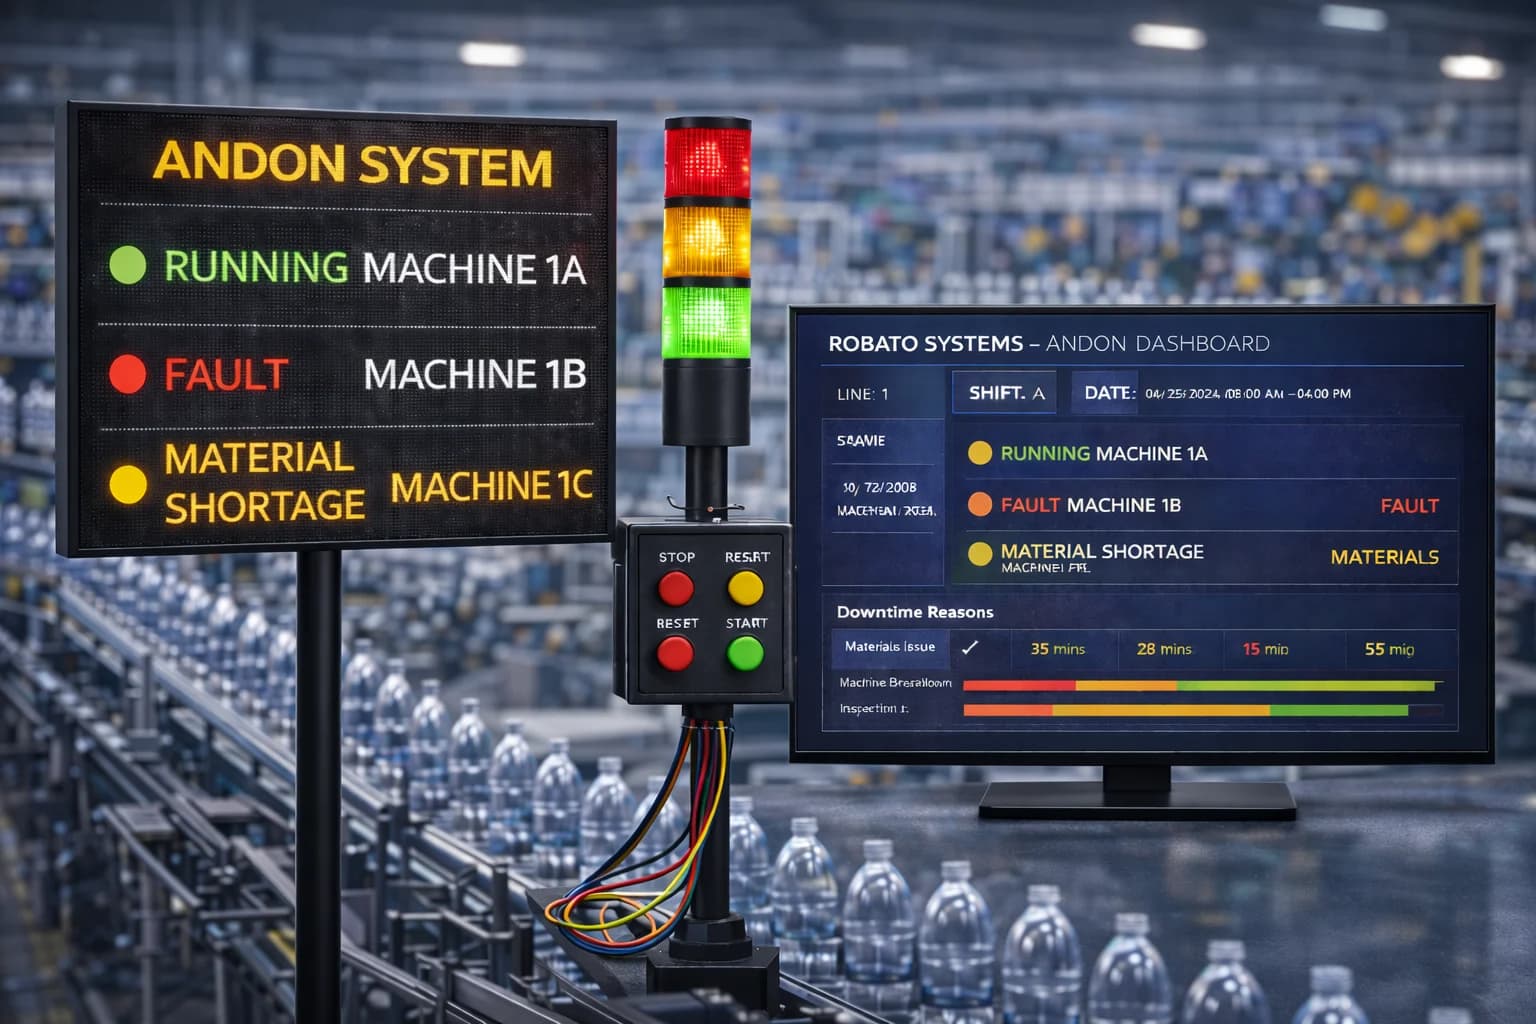
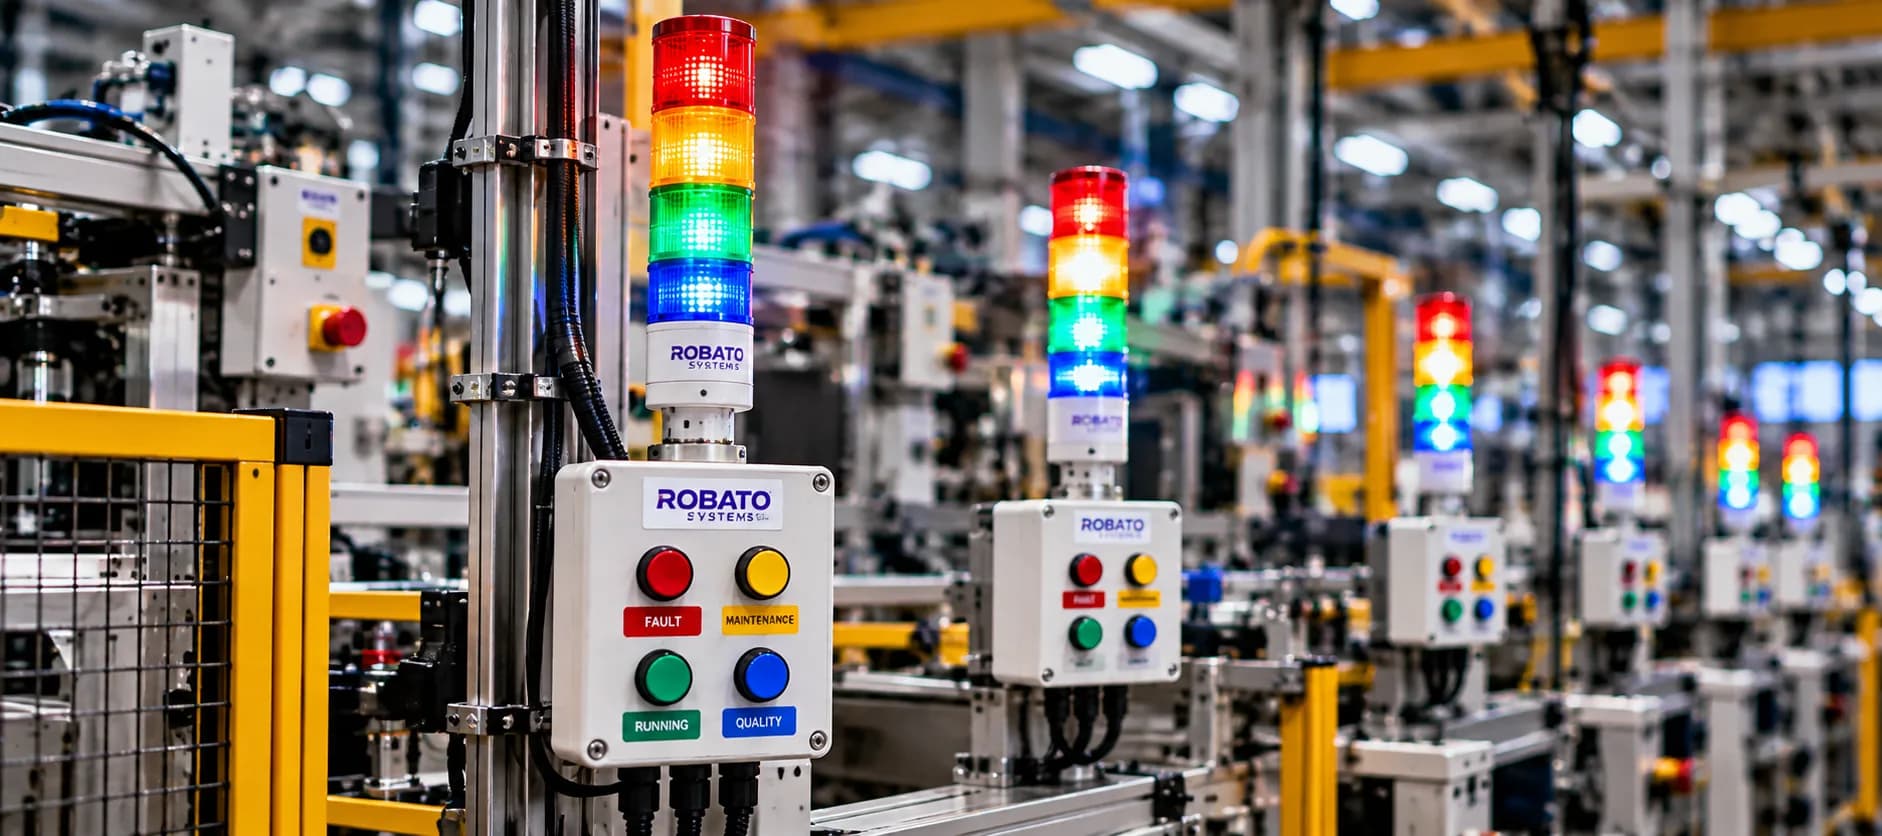
- Andon Systems
- Quality Management Systems
- Cloud Platforms
Integration creates a single source of truth for production performance.
Industries That Use OEE Dashboards
OEE Dashboards are valuable across many industries.
Automotive Manufacturing
Track robotic cells, welding lines, and assembly operations.
Electronics Manufacturing
Monitor SMT lines, testing stations, and PCB assembly.
Food & Beverage
Monitor processing, filling, packaging, and labeling.
Pharmaceutical Manufacturing
Track batch production, compliance, and quality.
Textile Manufacturing
Measure loom efficiency, spinning performance, and machine utilization.
Plastic & Injection Molding
Monitor cycle time, downtime, and machine output.
Packaging Industry
Track packaging equipment, conveyors, and labeling systems.
Common Dashboard Design Mistakes
Avoid these common mistakes:
- Displaying too many KPIs
- Using delayed or manual data
- Ignoring downtime analysis
- Not showing historical trends
- Lack of mobile accessibility
- Complex layouts that confuse users
- No drill-down capability
- Poor color usage
Keeping dashboards focused and intuitive improves usability and adoption.
Future Trends in OEE Dashboards
As Industry 4.0 technologies continue to evolve, OEE Dashboards are becoming more intelligent.
Artificial Intelligence
AI will identify production anomalies and recommend corrective actions automatically.
Predictive Analytics
Machine learning will forecast equipment failures before they occur.
Digital Twins
Virtual factory models will visualize production performance in real time.
Edge Computing
Processing data closer to machines will improve dashboard responsiveness.
Augmented Reality
Maintenance engineers may access live OEE dashboards through AR devices while working on equipment.
These innovations will further enhance manufacturing visibility and operational decision-making.
Why Choose Robato Systems for OEE Dashboards?
Robato Systems delivers advanced OEE Dashboard solutions that provide manufacturers with complete real-time visibility into production performance. Our dashboards integrate seamlessly with PLCs, Industrial IoT devices, MES, ERP, SCADA, Andon Systems, and Production Monitoring Software to display live OEE metrics, machine status, downtime analysis, production KPIs, and equipment utilization.
Designed for Industry 4.0 environments, our platform includes customizable dashboards, shift-wise performance tracking, cloud access, automated alerts, multi-plant monitoring, and historical analytics. These features help manufacturers improve productivity, reduce downtime, optimize maintenance, and make faster data-driven decisions.
Whether you operate a single production line or multiple manufacturing facilities, Robato Systems provides scalable dashboard solutions that support continuous improvement and operational excellence.
Conclusion
An OEE Dashboard is much more than a reporting screen—it is a strategic decision-making tool that gives manufacturers complete visibility into production performance. By displaying real-time information about machine availability, production efficiency, product quality, and downtime, it enables organizations to identify problems quickly, optimize equipment utilization, and improve manufacturing productivity.
Following dashboard design best practices ensures that production teams receive accurate, actionable information at the right time. As factories continue embracing Industry 4.0 technologies, intelligent OEE Dashboards will remain essential for achieving higher efficiency, lower costs, and smarter manufacturing operations.
Frequently Asked Questions (FAQs)
What is an OEE Dashboard?
An OEE Dashboard is a real-time visual interface that displays Overall Equipment Effectiveness along with production, downtime, quality, and machine performance metrics.
What should an OEE Dashboard include?
A well-designed OEE Dashboard should include Availability, Performance, Quality, OEE, machine status, downtime analysis, production targets, shift performance, and maintenance KPIs.
Why is an OEE Dashboard important?
It helps manufacturers monitor equipment performance in real time, reduce downtime, improve productivity, and make faster operational decisions.
Can an OEE Dashboard integrate with ERP and MES?
Yes. Modern OEE Dashboards integrate with ERP, MES, PLCs, SCADA, Industrial IoT devices, Production Monitoring Systems, and cloud platforms.
Which industries benefit from OEE Dashboards?
Automotive, electronics, food processing, pharmaceuticals, textiles, plastics, packaging, FMCG, and other manufacturing industries use OEE Dashboards to improve operational efficiency.