Manufacturing operations generate enormous amounts of data every day. Machines produce parts, operators record production quantities, maintenance teams resolve breakdowns, and quality departments track rejected products. However, collecting this information is only the first step. The real value comes from transforming production data into meaningful insights that can help improve efficiency.
This is where OEE Reporting Software becomes valuable.
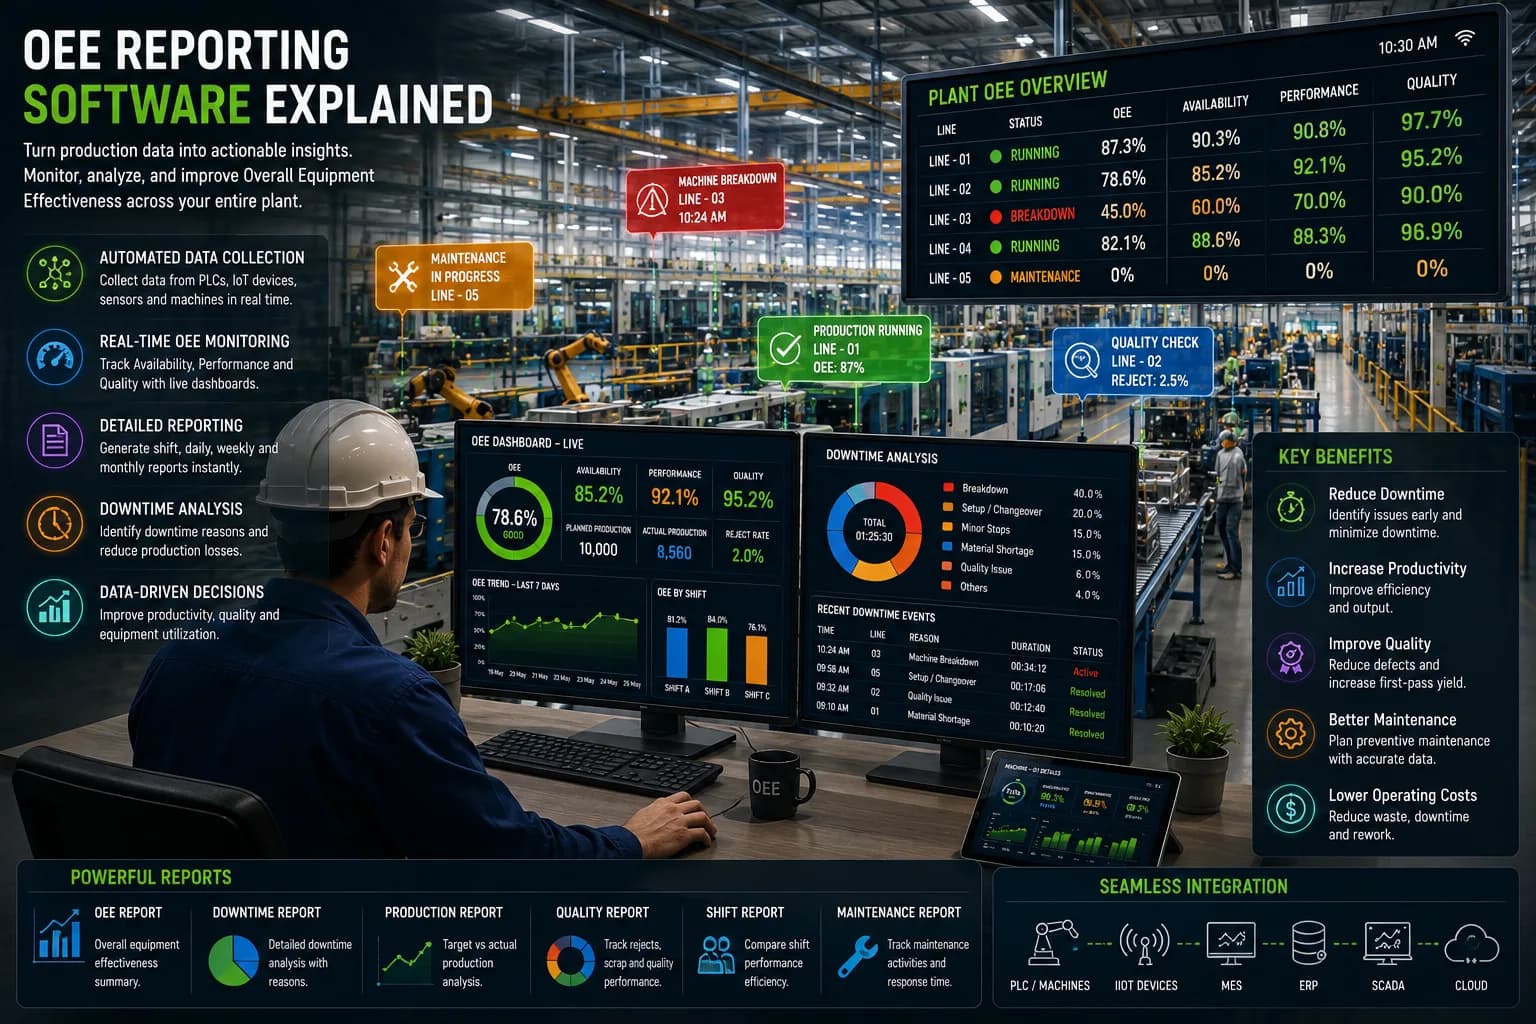
OEE Reporting Software helps manufacturers automatically collect, organize, analyze, and report production performance data. Instead of relying on manually prepared spreadsheets or end-of-shift reports, production teams can access structured information about machine availability, performance, quality, downtime, production output, and Overall Equipment Effectiveness.
A well-designed reporting solution gives manufacturers a clear understanding of where production losses occur and which areas require attention. It can also help management compare machines, production lines, shifts, departments, and even multiple manufacturing plants using consistent performance metrics.
For factories working toward Industry 4.0, OEE Reporting Software provides an important foundation for creating a data-driven manufacturing environment.
What is OEE Reporting Software?
OEE Reporting Software is a digital manufacturing solution that automatically collects production information and converts it into detailed OEE reports and performance analytics.
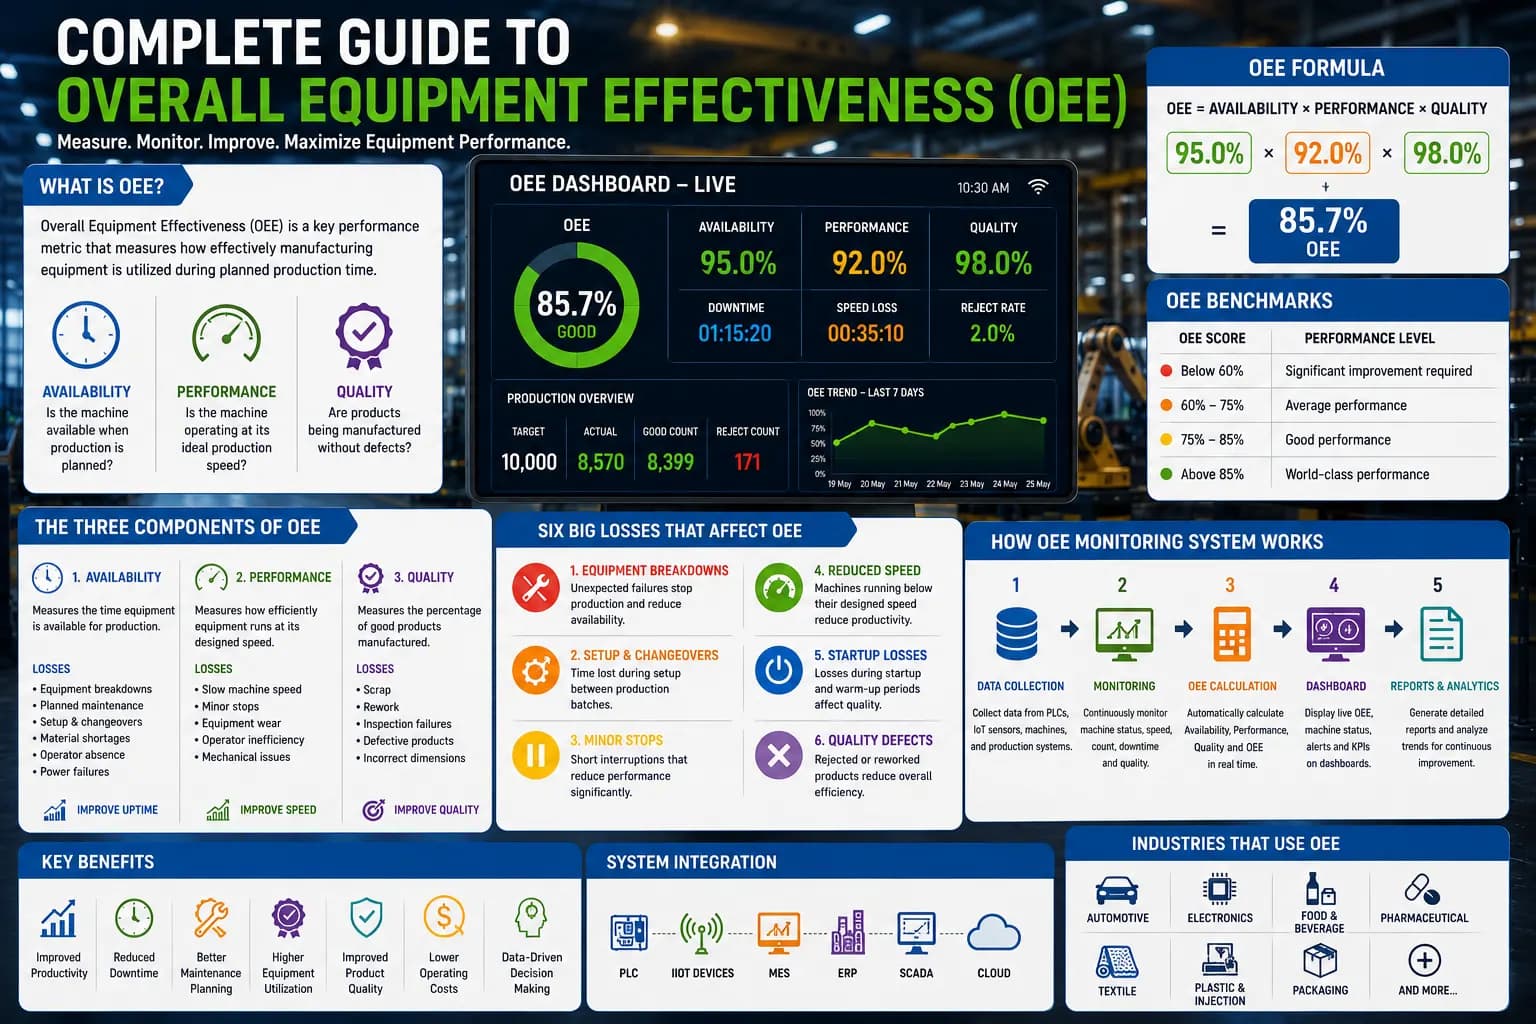
The software typically tracks the three primary components of Overall Equipment Effectiveness:
- Availability
- Performance
- Quality
It can also capture supporting production information such as:
- Machine downtime
- Production quantity
- Rejected quantity
- Machine status
- Cycle time
- Target production
- Actual production
- Maintenance events
- Shift performance
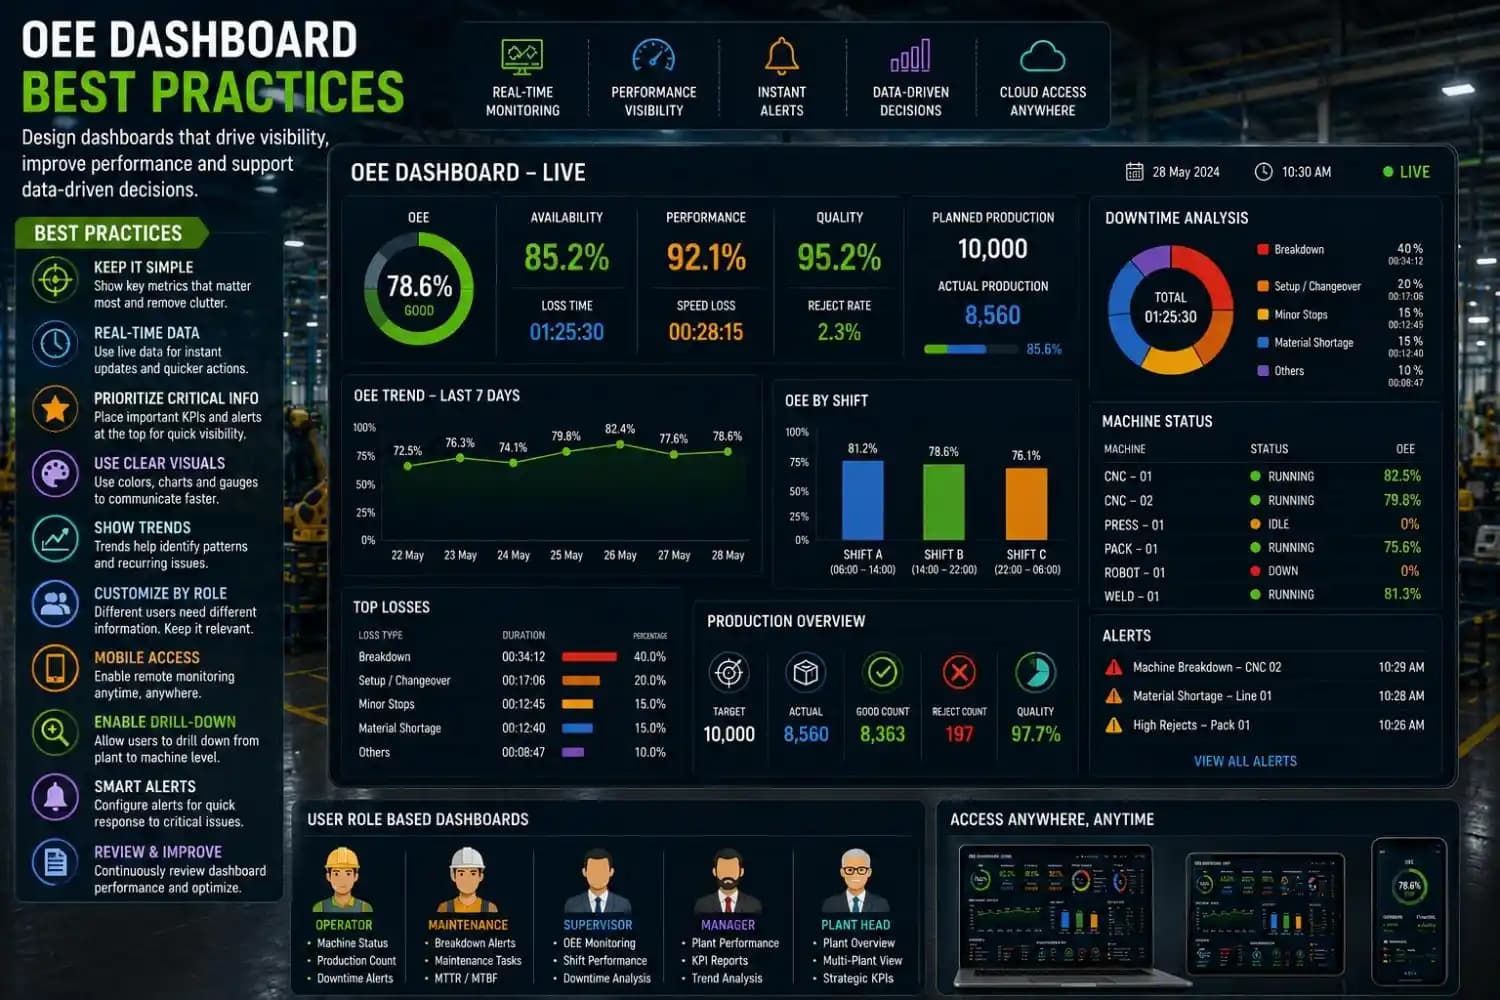
This information can then be presented through dashboards, charts, tables, and downloadable reports.
Instead of asking employees to manually compile production information, manufacturers can automate much of the reporting process.
Why is OEE Reporting Important?
A single OEE percentage does not always explain why production performance is poor.
For example, a production line may have an OEE of 68%. But management needs to know why the value is low.
Is the problem:
- Frequent machine breakdowns?
- Long changeover times?
- Reduced production speed?
- High rejection rates?
- Material shortages?
- Operator delays?
OEE Reporting Software helps answer these questions by breaking overall performance into detailed production losses.
This allows teams to move from simply measuring performance to actually improving performance.
How OEE Reporting Software Works
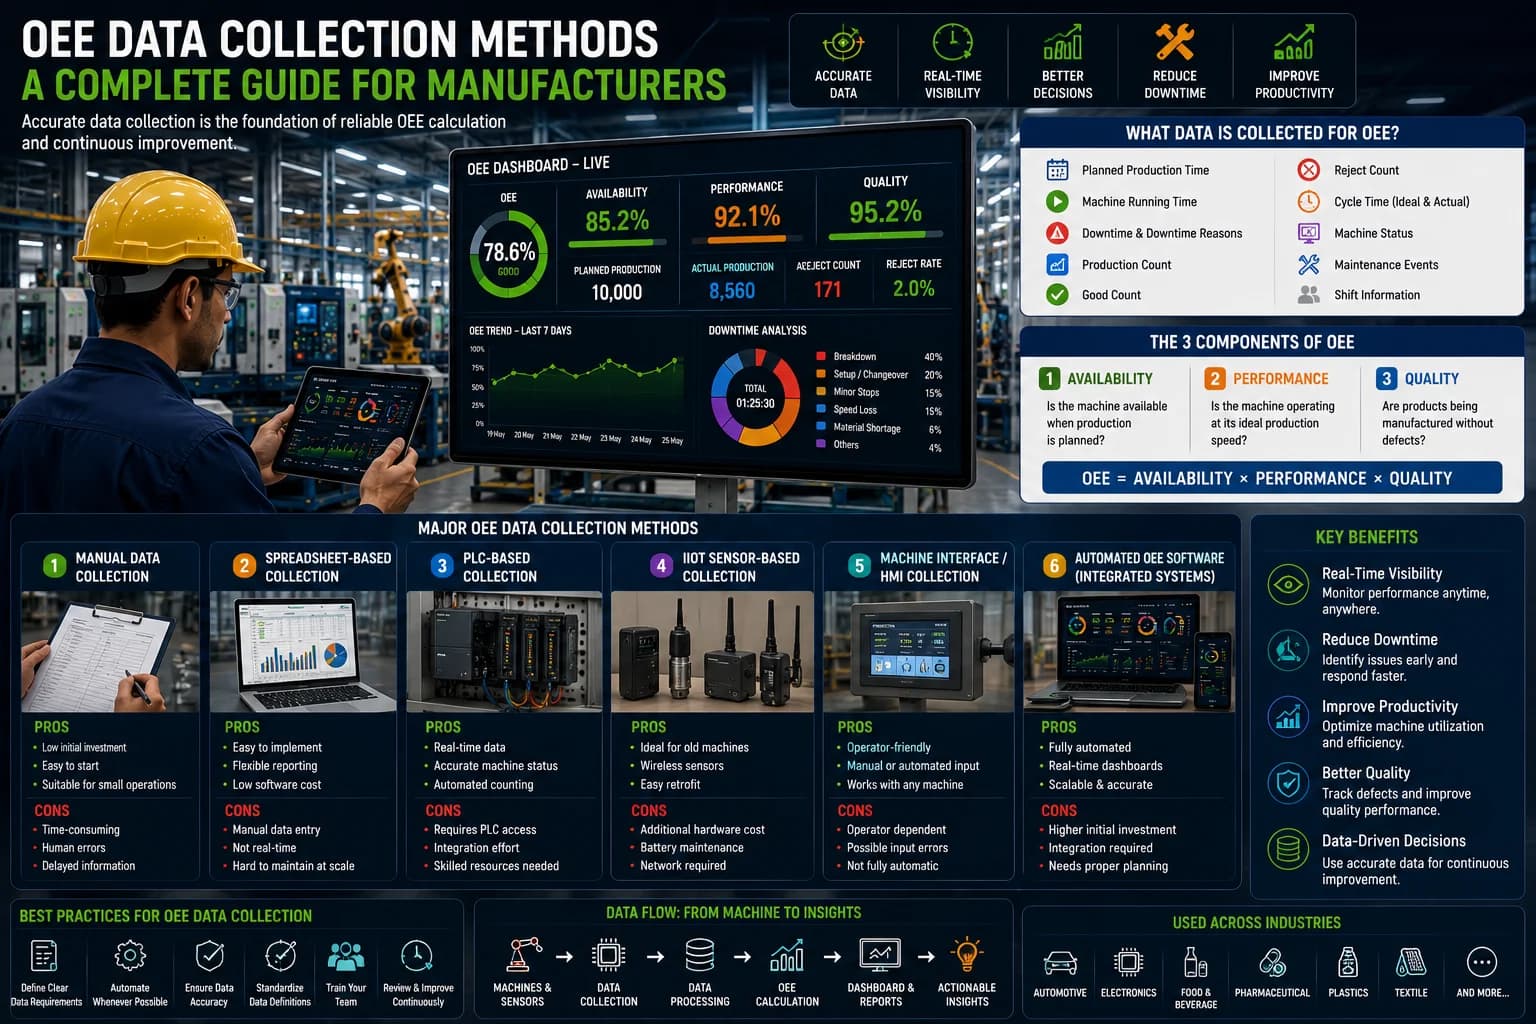
1. Production Data Collection
The software collects information from machines and manufacturing systems.
Common data sources include:
- PLCs
- Industrial IoT sensors
- Machine controllers
- Production counters
- Barcode scanners
- RFID systems
- Operator terminals
- MES
- SCADA systems
2. Data Processing
Collected data is organized into production events and performance categories.
For example:
A machine stops at 10:35 AM.
The system records:
- Machine ID
- Production line
- Start time
- Stop time
- Downtime duration
- Downtime reason
- Shift
- Operator
- Production order
This information becomes part of the machine's performance history.
3. OEE Calculation
The system automatically calculates:
- Availability
- Performance
- Quality
- OEE
This eliminates repetitive manual calculations.
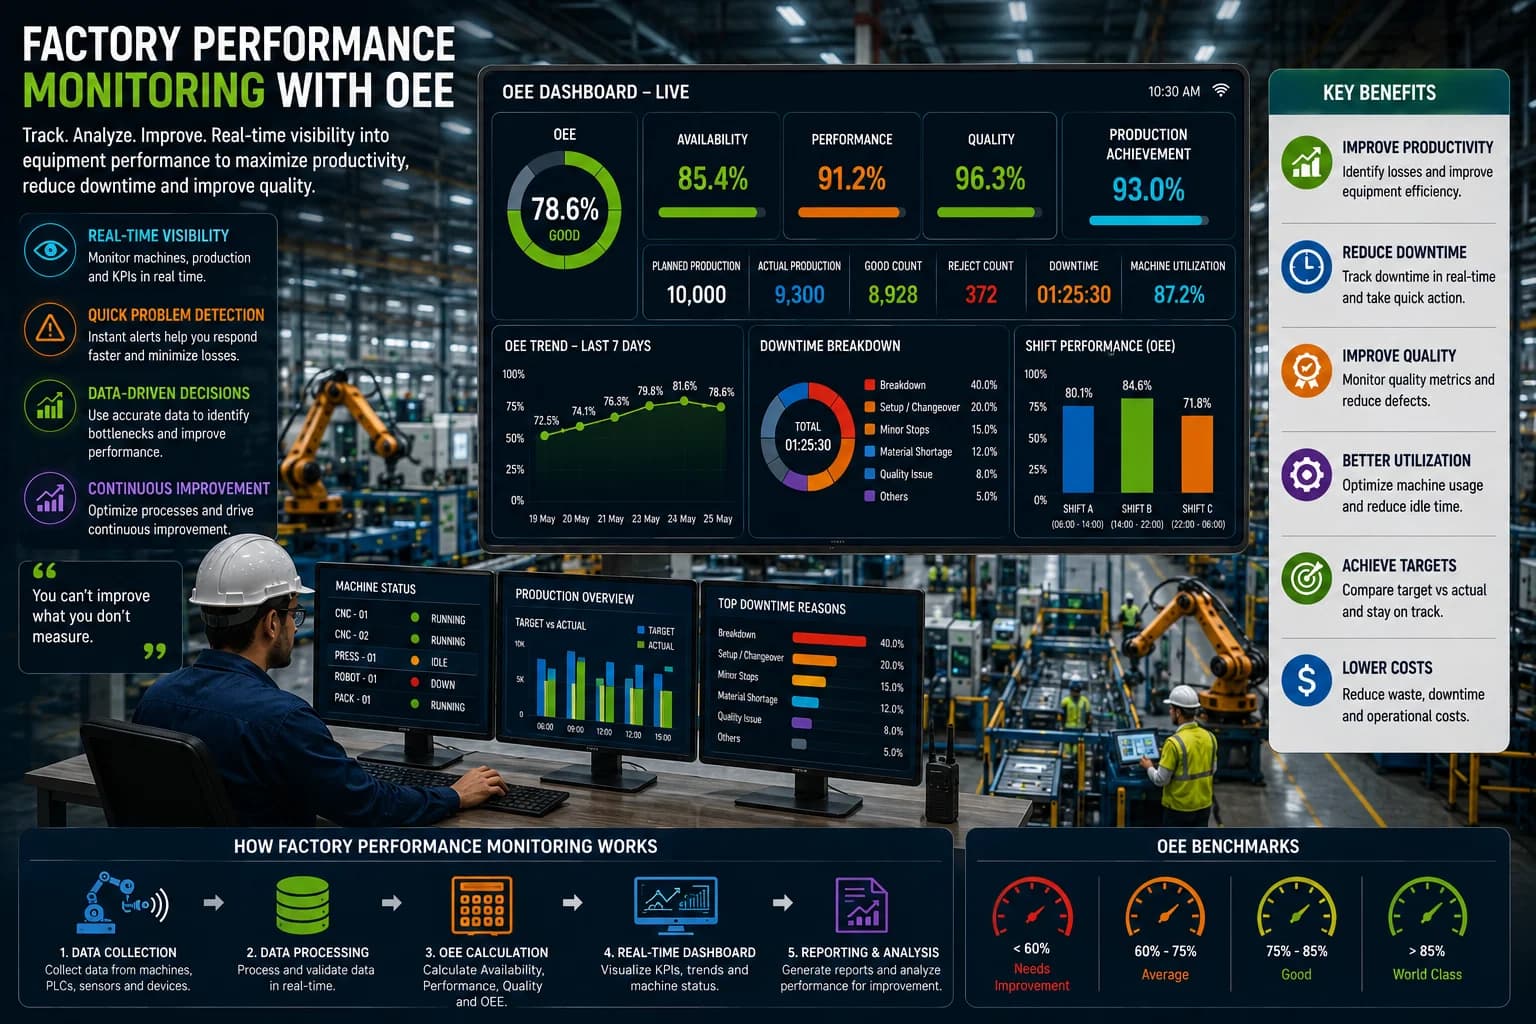
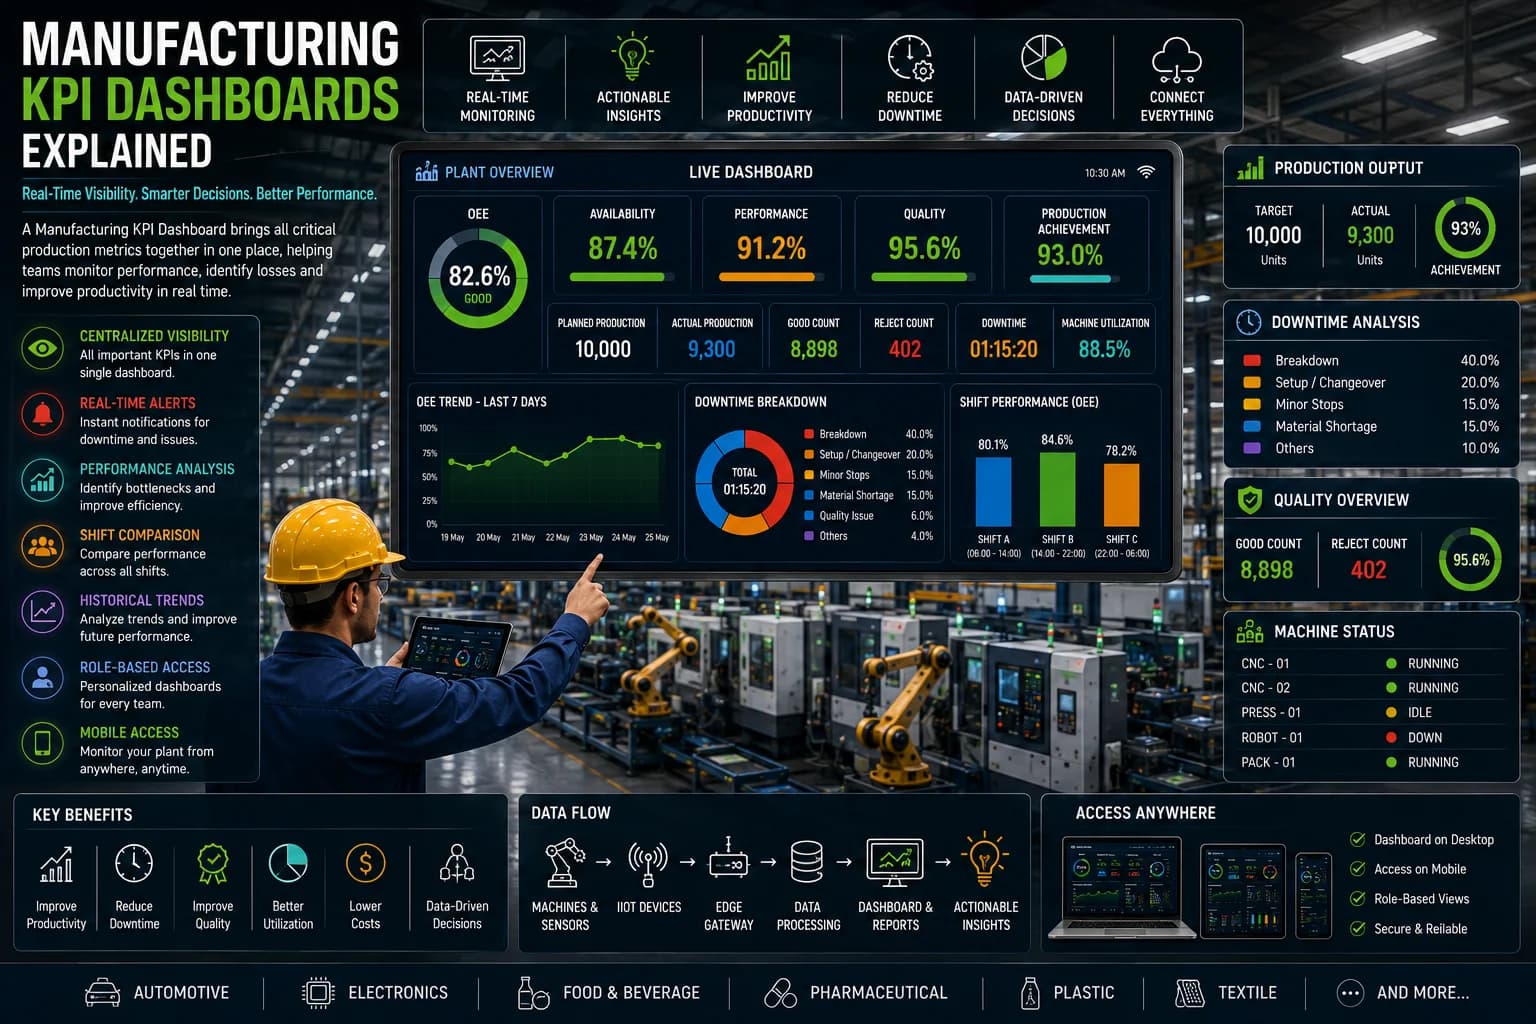
4. Dashboard Visualization
The processed data is displayed through dashboards containing:
- OEE percentage
- Production output
- Downtime
- Machine utilization
- Quality performance
- Target vs Actual
- Shift performance
5. Automated Reporting
Reports can be generated according to different time periods and operational requirements.
Examples include:
- Hourly reports
- Shift reports
- Daily reports
- Weekly reports
- Monthly reports
Important OEE Reports for Manufacturing
A comprehensive OEE Reporting Software solution should provide several types of reports.
OEE Performance Report
This report provides an overview of:
- Availability
- Performance
- Quality
- OEE
It can be used to compare performance across machines, production lines, or shifts.
Downtime Report
Downtime reporting is one of the most useful features of OEE Software.
It can show:
- Total downtime
- Breakdown duration
- Number of breakdowns
- Downtime reasons
- Machine-wise downtime
- Shift-wise downtime
This helps maintenance teams identify recurring problems.
Production Report
Production reports compare planned production with actual output.
Important metrics include:
- Production target
- Actual production
- Production achievement
- Good quantity
- Rejected quantity
- Production efficiency
Quality Report
Quality reports help identify manufacturing losses caused by defects.
Metrics may include:
- Total production
- Good parts
- Rejected parts
- Scrap
- Rework
- Quality percentage
Machine Utilization Report
This report shows how effectively individual machines are being used.
It can include:
- Running time
- Idle time
- Downtime
- Maintenance time
- Utilization percentage
Shift-Wise OEE Report
Compare production performance across different shifts.
For example:
| Shift | Availability | Performance | Quality | OEE |
|---|---|---|---|---|
| Shift A | 92% | 89% | 98% | 80% |
| Shift B | 95% | 91% | 97% | 84% |
| Shift C | 88% | 85% | 96% | 72% |
This type of comparison helps management identify performance differences between shifts.
Key Features of OEE Reporting Software
Automated Data Collection
Production information is collected directly from connected machines and systems.
Real-Time Reporting
Reports and dashboards can update as production events occur.
Customizable Reports
Users can configure reports according to machines, production lines, shifts, or plants.
Historical Data
Store production information for long-term trend analysis.
Downtime Analysis
Identify the largest causes of production losses.
OEE Trend Analysis
Compare OEE performance over:
- Days
- Weeks
- Months
- Years
Machine-Level Reporting
Analyze individual equipment performance.
Line-Level Reporting
Compare multiple machines within a production line.
Plant-Level Reporting
View overall performance across an entire facility.
Multi-Plant Reporting
Organizations with multiple factories can compare performance across locations.
Exportable Reports
Reports can be exported for:
- Management reviews
- Production meetings
- Audits
- Continuous improvement activities
Benefits of OEE Reporting Software
Eliminates Manual Reporting
Automated reporting reduces the time employees spend preparing spreadsheets and production summaries.
Improves Data Accuracy
Direct machine data reduces errors caused by manual entry.
Provides Better Production Visibility
Managers can quickly understand current and historical factory performance.
Reduces Downtime
Detailed downtime reports reveal recurring equipment problems.
Improves Maintenance Planning
Maintenance teams can use historical machine data to prioritize equipment requiring attention.
Supports Continuous Improvement
Historical reports help identify whether improvement initiatives are actually producing measurable results.
Improves Productivity
By identifying production losses, manufacturers can improve machine utilization and output.
Enables Data-Driven Decisions
Management can make decisions using measurable production performance rather than assumptions.
OEE Reporting Software vs Manual Reporting
Traditional reporting often depends on operators recording production information manually.
This approach can create several problems:
- Delayed information
- Data entry errors
- Inconsistent reporting
- Missing downtime events
- Difficult historical analysis
- High administrative workload
With OEE Reporting Software, production information can be collected automatically and presented in standardized reports.
Manual Reporting
- Spreadsheet-based
- Time-consuming
- Often delayed
- Difficult to scale
- Higher risk of errors
Automated OEE Reporting
- Real-time
- Machine-connected
- Centralized
- Scalable
- Easier to analyze
The result is a faster and more reliable approach to production performance management.
OEE Reporting and the Six Big Losses
OEE Reporting Software can help manufacturers identify the six major sources of equipment losses.
Equipment Failures
Unplanned breakdowns reduce Availability.
Setup and Adjustment
Long setup and changeover times reduce productive machine time.
Idling and Minor Stops
Frequent short interruptions reduce Performance.
Reduced Speed
Operating below ideal machine speed lowers production efficiency.
Process Defects
Defective products reduce Quality.
Startup Losses
Initial production losses after machine startup can also reduce Quality.
By tracking these losses, manufacturers can prioritize improvement activities based on actual production data.
OEE Reporting for Different Teams
Different departments can use the same reporting platform for different purposes.
Production Managers
Production managers can monitor:
- OEE
- Production achievement
- Downtime
- Shift performance
- Target vs Actual
Maintenance Teams
Maintenance teams can analyze:
- Machine breakdowns
- Downtime causes
- MTTR
- MTBF
- Equipment reliability
Quality Teams
Quality teams can monitor:
- Rejection rates
- Scrap
- Rework
- Quality percentage
Plant Management
Senior management can review:
- Plant-wide OEE
- Production trends
- Machine utilization
- Factory performance
- Operational losses
Integrating OEE Reporting Software with Factory Systems
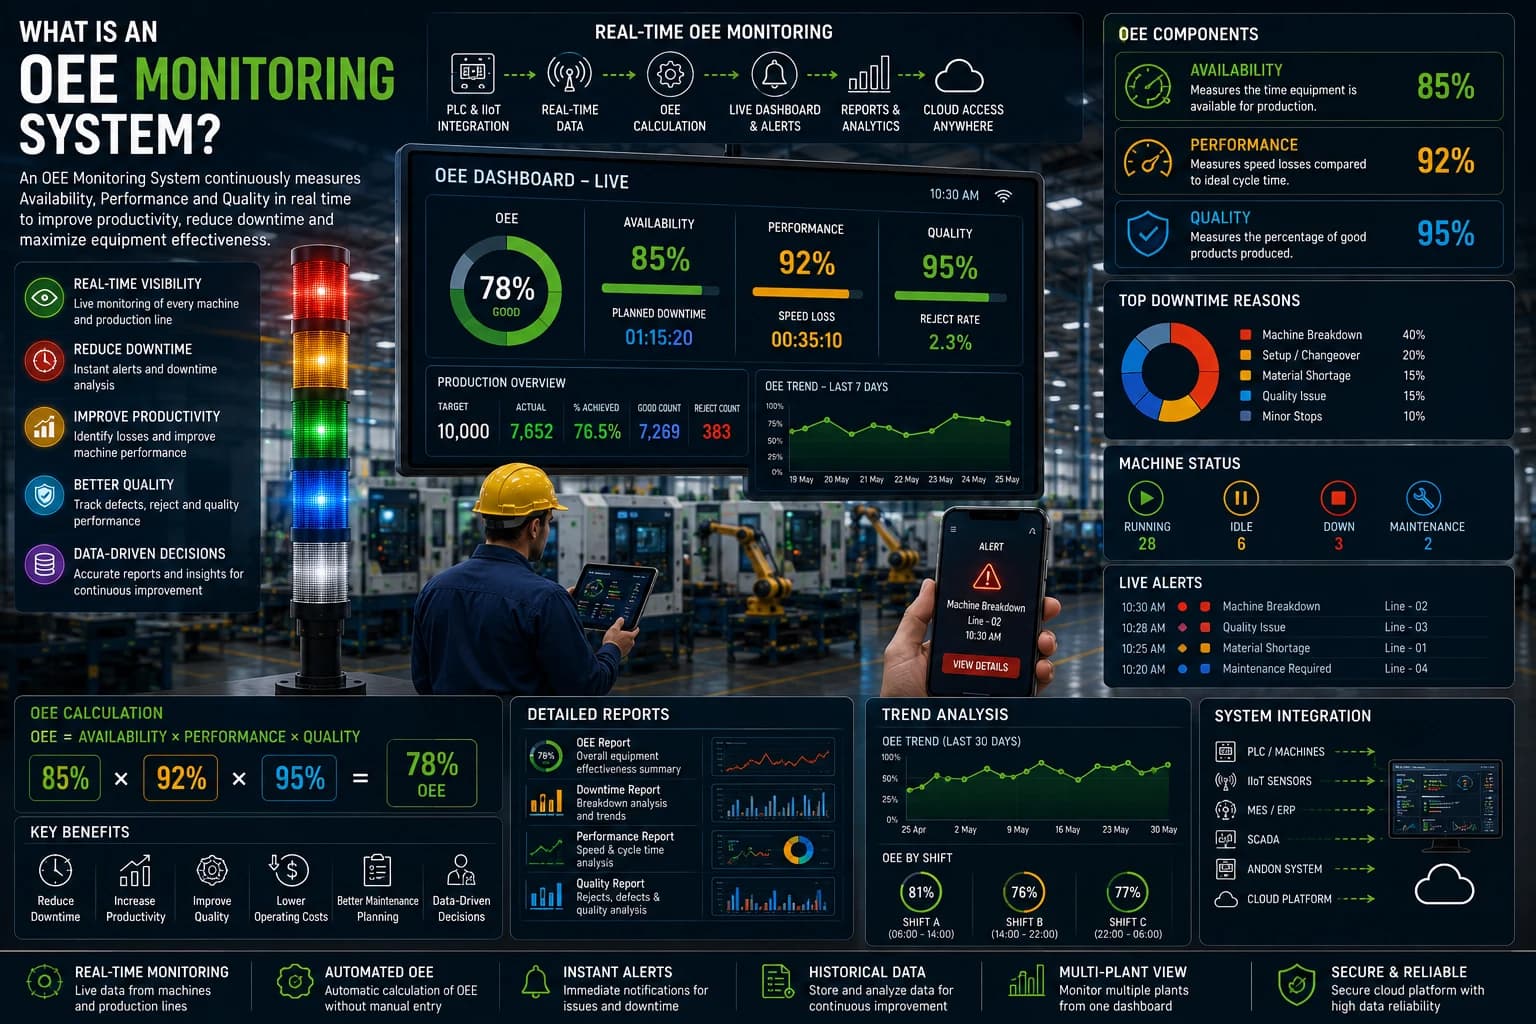
Modern OEE Reporting Software can integrate with existing manufacturing technologies.
PLC Integration
Production and machine status can be collected directly from PLCs.
IIoT Integration
Sensors can provide additional equipment and process data.
MES Integration
Production orders and manufacturing information can be synchronized with the OEE platform.
ERP Integration
Production performance can be connected with business and planning systems.
SCADA Integration
Machine monitoring and OEE analytics can work together to provide complete operational visibility.
Andon Integration
Andon events such as machine breakdowns and operator assistance calls can be included in production reports.
This creates a connected manufacturing environment where production, maintenance, quality, and management teams work from the same information.
Best Practices for Implementing OEE Reporting Software
Start with Critical Machines
Begin with production lines where downtime has the greatest business impact.
Standardize Downtime Reasons
Create a consistent list of downtime categories across machines.
Automate Data Collection
Connect directly to machines whenever possible.
Define Clear KPIs
Ensure teams understand exactly how each KPI is calculated.
Review Reports Regularly
Use production meetings to review trends and identify improvement opportunities.
Avoid Measuring Everything
Focus on information that can support actual operational decisions.
Train Employees
Ensure operators and managers understand how to use and interpret reports.
Common Challenges
Legacy Machine Connectivity
Older equipment may not have modern communication interfaces.
IoT gateways, sensors, or retrofit devices can help connect these machines.
Inconsistent Data
Different machines may produce data in different formats.
Standardization is important for accurate reporting.
Incorrect Downtime Classification
If downtime reasons are recorded incorrectly, reports may lead to incorrect conclusions.
Poor User Adoption
Even the best software will not deliver value if production teams do not use it properly.
Training and clear processes are therefore important.
Future of OEE Reporting Software
OEE Reporting Software is evolving rapidly as manufacturers adopt Industry 4.0 technologies.
Artificial Intelligence
AI can identify unusual production patterns and recommend corrective actions.
Predictive Analytics
Historical OEE data can help predict potential equipment failures and production losses.
Automated Root Cause Analysis
Advanced analytics can identify relationships between machine conditions and production losses.
Digital Twins
Digital factory models can use OEE data to simulate production scenarios.
Edge Computing
Processing production information closer to machines can reduce latency and improve real-time monitoring.
Why Choose Robato Systems for OEE Reporting Software?
Robato Systems provides intelligent OEE Reporting Software designed to turn production data into actionable manufacturing insights. Our platform connects with PLCs, Industrial IoT devices, machines, MES, ERP, SCADA, and production monitoring systems to automate data collection and reporting.
The solution provides real-time OEE dashboards, machine-level reports, downtime analytics, production performance reports, quality tracking, shift-wise analysis, machine utilization monitoring, and historical trend reports.
With automated reporting and centralized production visibility, manufacturers can reduce manual work, identify production losses faster, improve maintenance planning, and make better data-driven decisions.
Robato Systems is designed for both individual production lines and larger multi-plant manufacturing environments, making it suitable for organizations progressing toward Industry 4.0 and smart factory operations.
Conclusion
OEE Reporting Software transforms raw production data into useful information that manufacturers can use to improve operational performance. By automating data collection, OEE calculations, downtime analysis, and performance reporting, it eliminates much of the complexity associated with traditional manual reporting.
More importantly, it helps manufacturers understand why production performance changes. Instead of simply seeing an OEE percentage, teams can identify the machines, shifts, downtime causes, speed losses, and quality problems responsible for production inefficiencies.
As manufacturing becomes increasingly connected, automated OEE reporting will play an important role in building transparent, data-driven, and efficient factories. The right OEE Reporting Software can help organizations reduce losses, improve productivity, optimize equipment utilization, and create a strong foundation for continuous improvement.
Frequently Asked Questions
What is OEE Reporting Software?
OEE Reporting Software is a manufacturing application that automatically collects production data and generates reports covering equipment availability, performance, quality, downtime, and Overall Equipment Effectiveness.
What reports can OEE Software generate?
Common reports include OEE reports, downtime reports, production reports, quality reports, machine utilization reports, shift-wise reports, maintenance reports, and KPI trend reports.
Can OEE Reporting Software collect data automatically?
Yes. It can collect data directly from PLCs, machines, Industrial IoT devices, sensors, production counters, MES, SCADA, and other connected systems.
How does OEE Reporting Software reduce downtime?
It identifies downtime events, tracks their duration and causes, and provides historical analysis that helps maintenance and production teams address recurring problems.
Can OEE reports be viewed in real time?
Yes. Modern OEE Reporting Software can provide live dashboards that update as production data is collected.
Is OEE Reporting Software suitable for multiple factories?
Yes. Enterprise-level solutions can provide centralized reporting and performance comparison across multiple production lines and manufacturing plants.