Manufacturing plants generate large amounts of production data every day. Machines produce counts, operators complete production activities, supervisors manage shifts, and production managers track targets and performance.
The challenge is not always collecting this information. The bigger challenge is turning it into information that managers can understand and act on quickly.
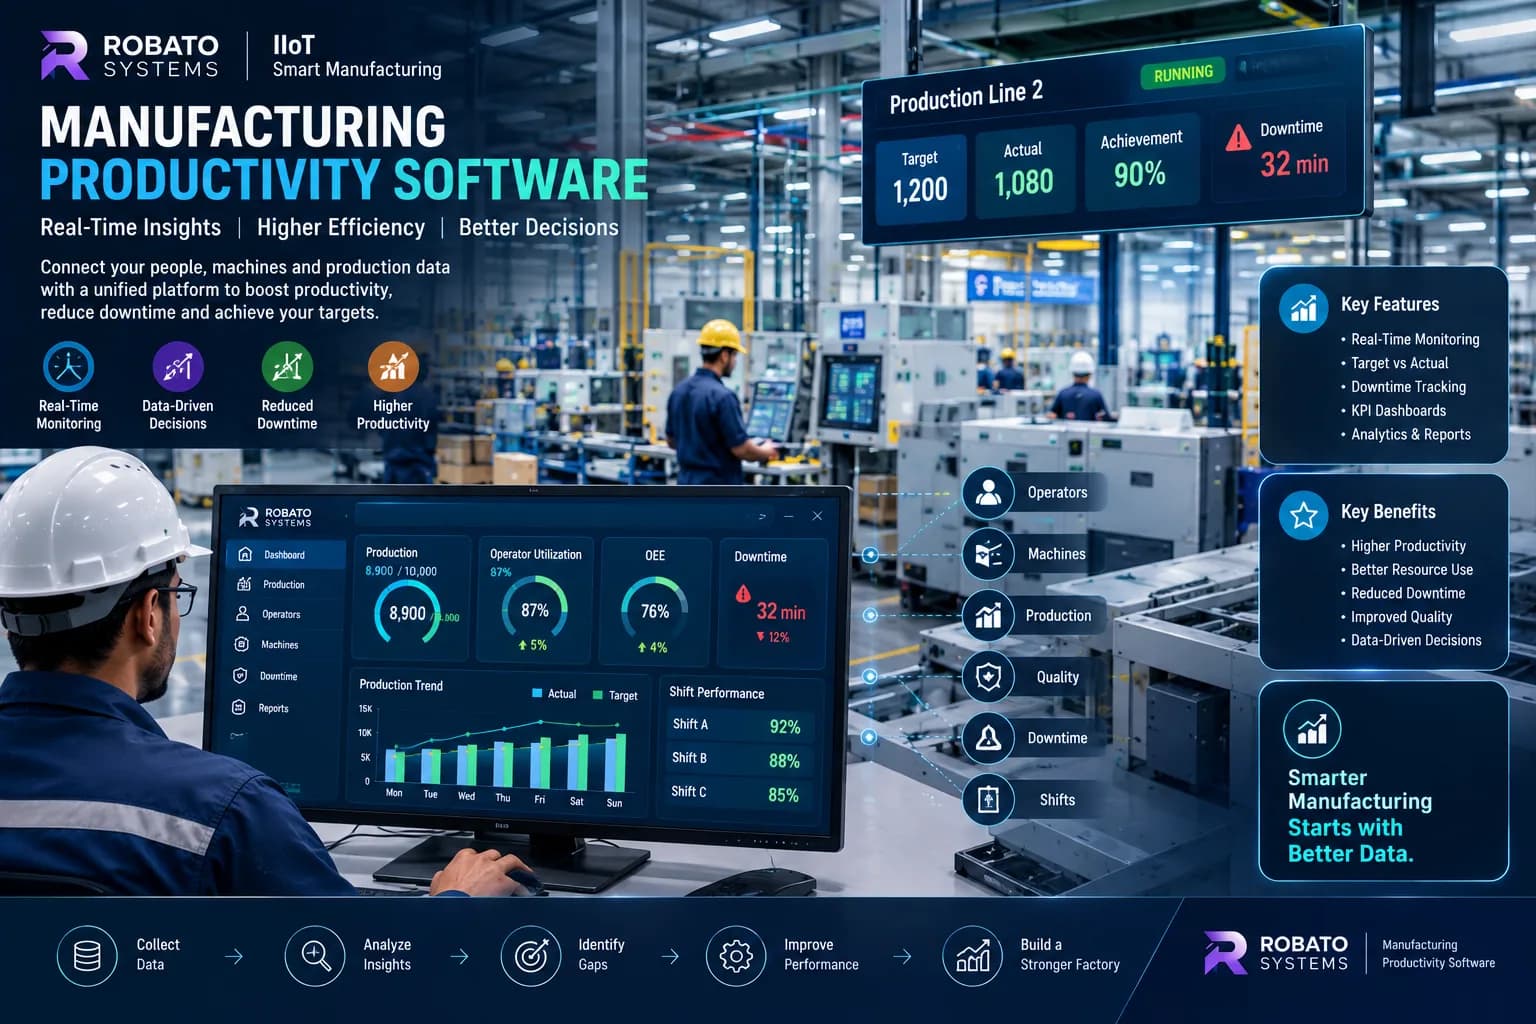
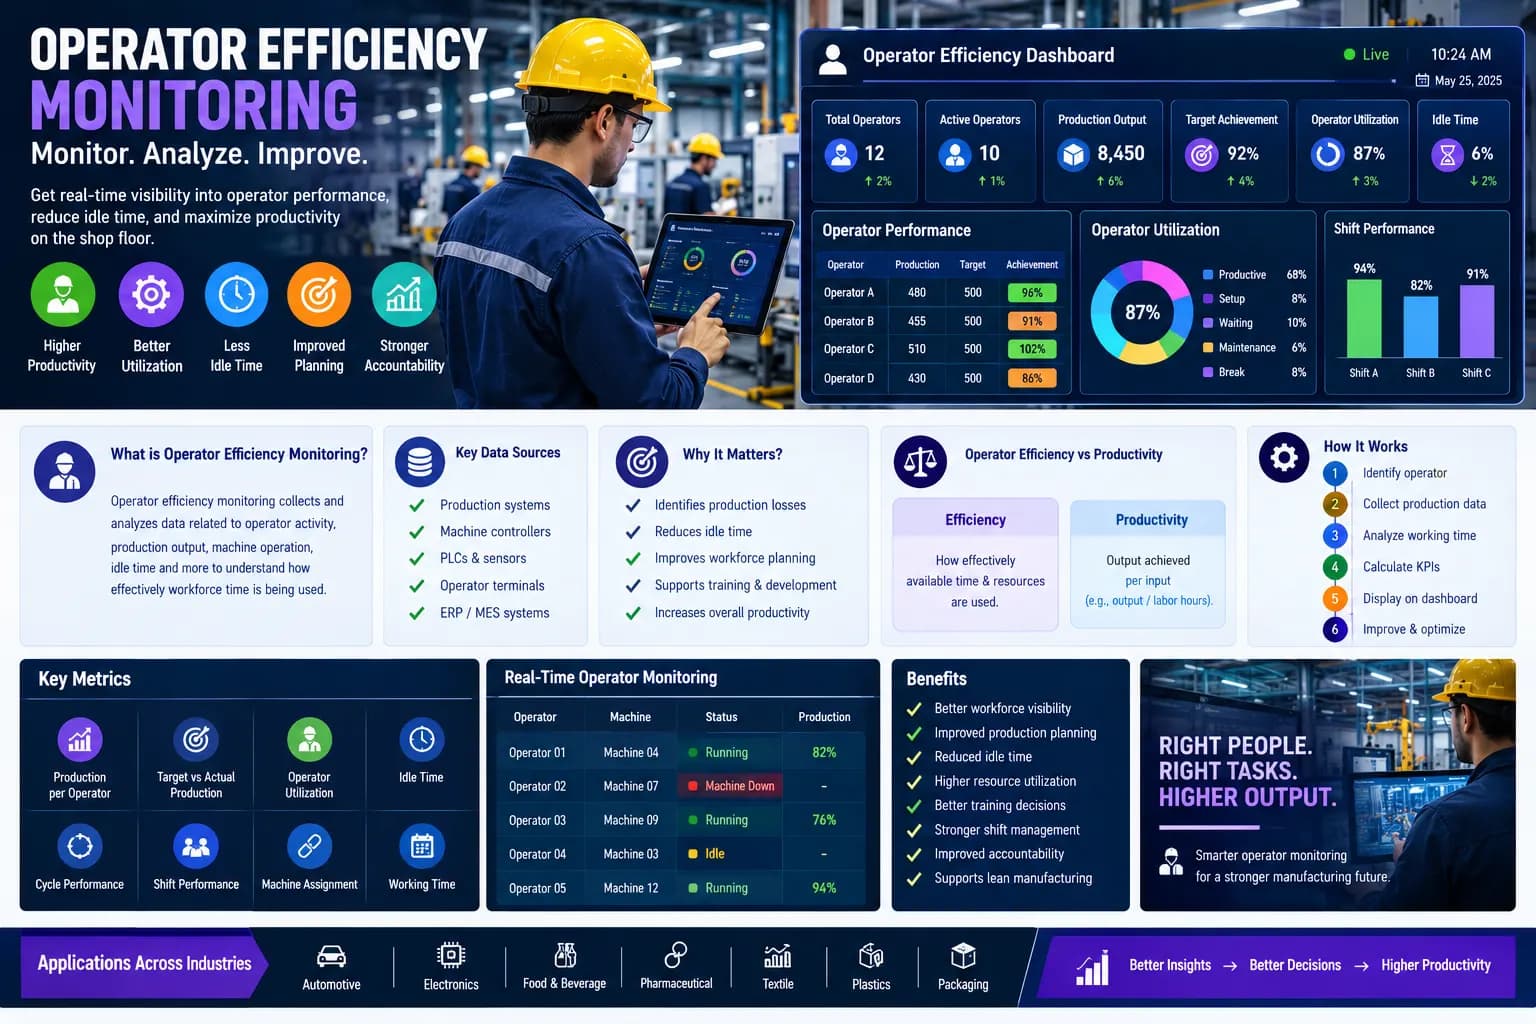
An operator KPI dashboard provides a centralized view of important workforce and production performance indicators. Instead of depending on multiple spreadsheets, paper reports, or manually prepared shift summaries, production teams can view relevant operator KPIs through a digital dashboard.
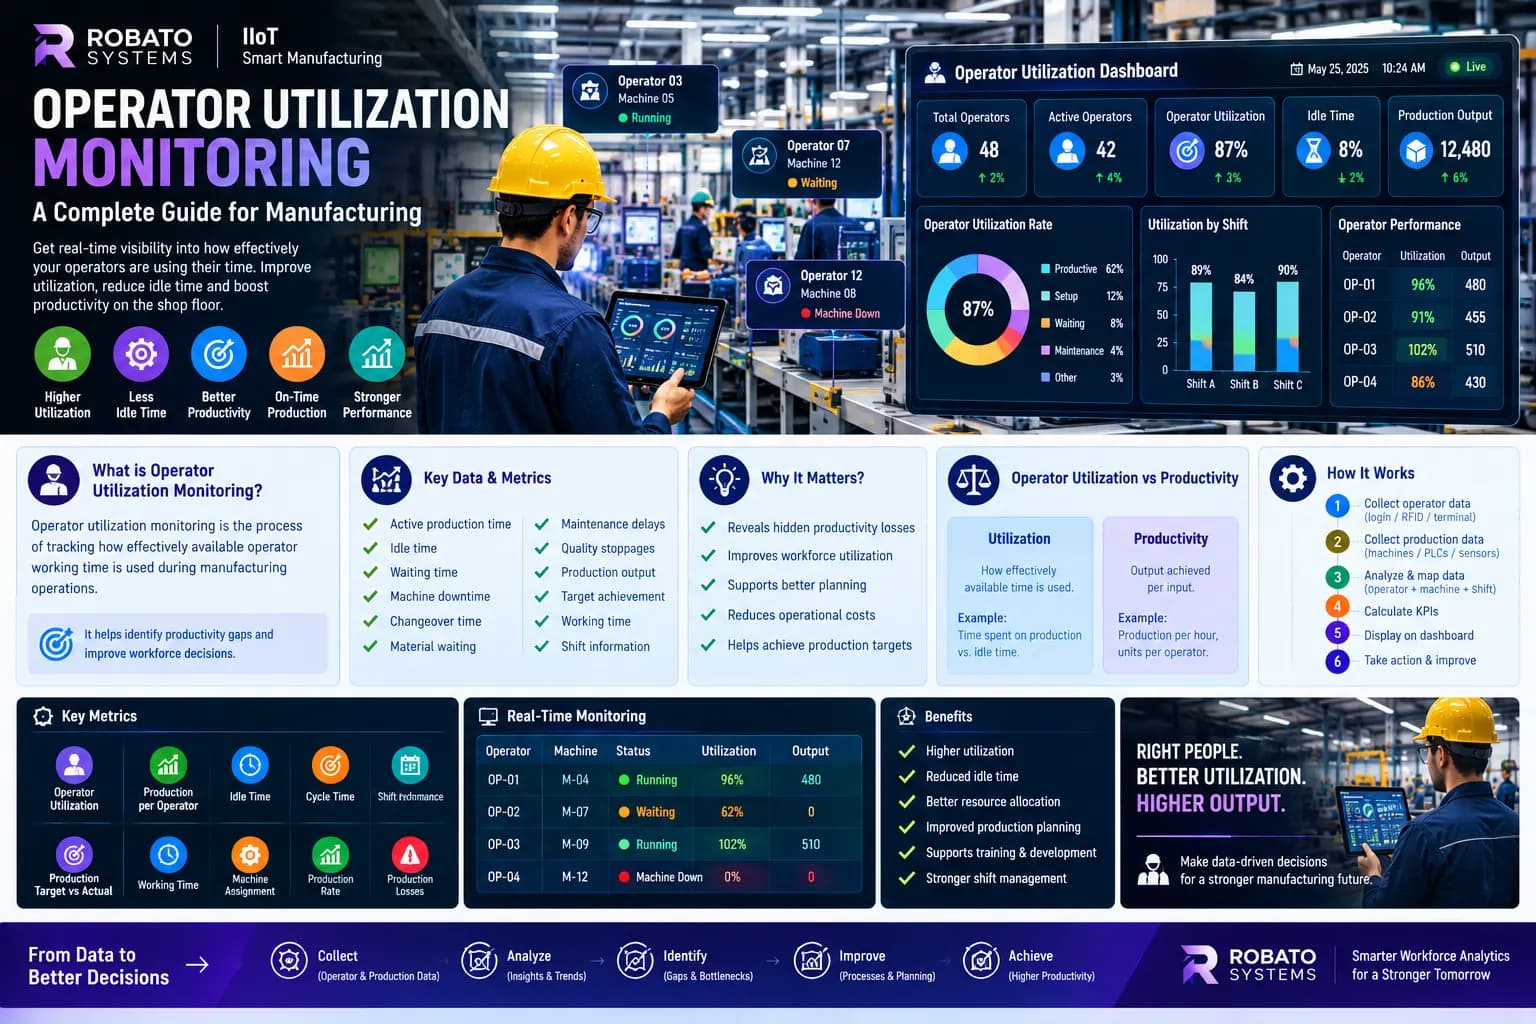
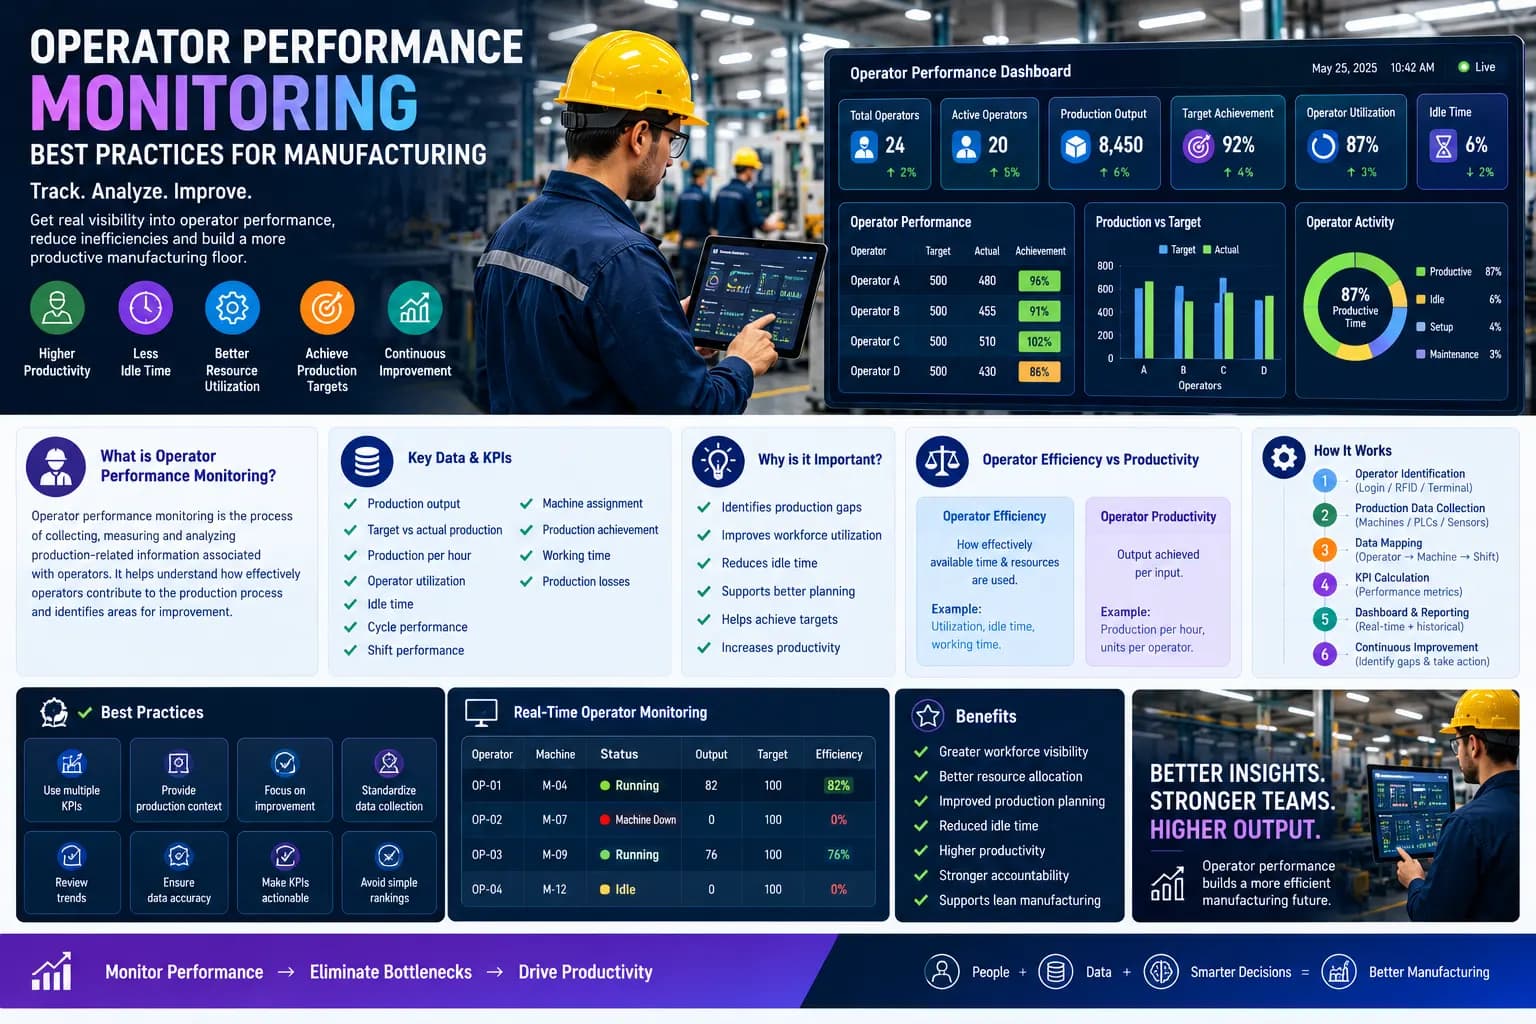
A well-designed dashboard can help manufacturers understand production output, target achievement, operator utilization, idle time, production rates, shift performance, and other workforce-related indicators.
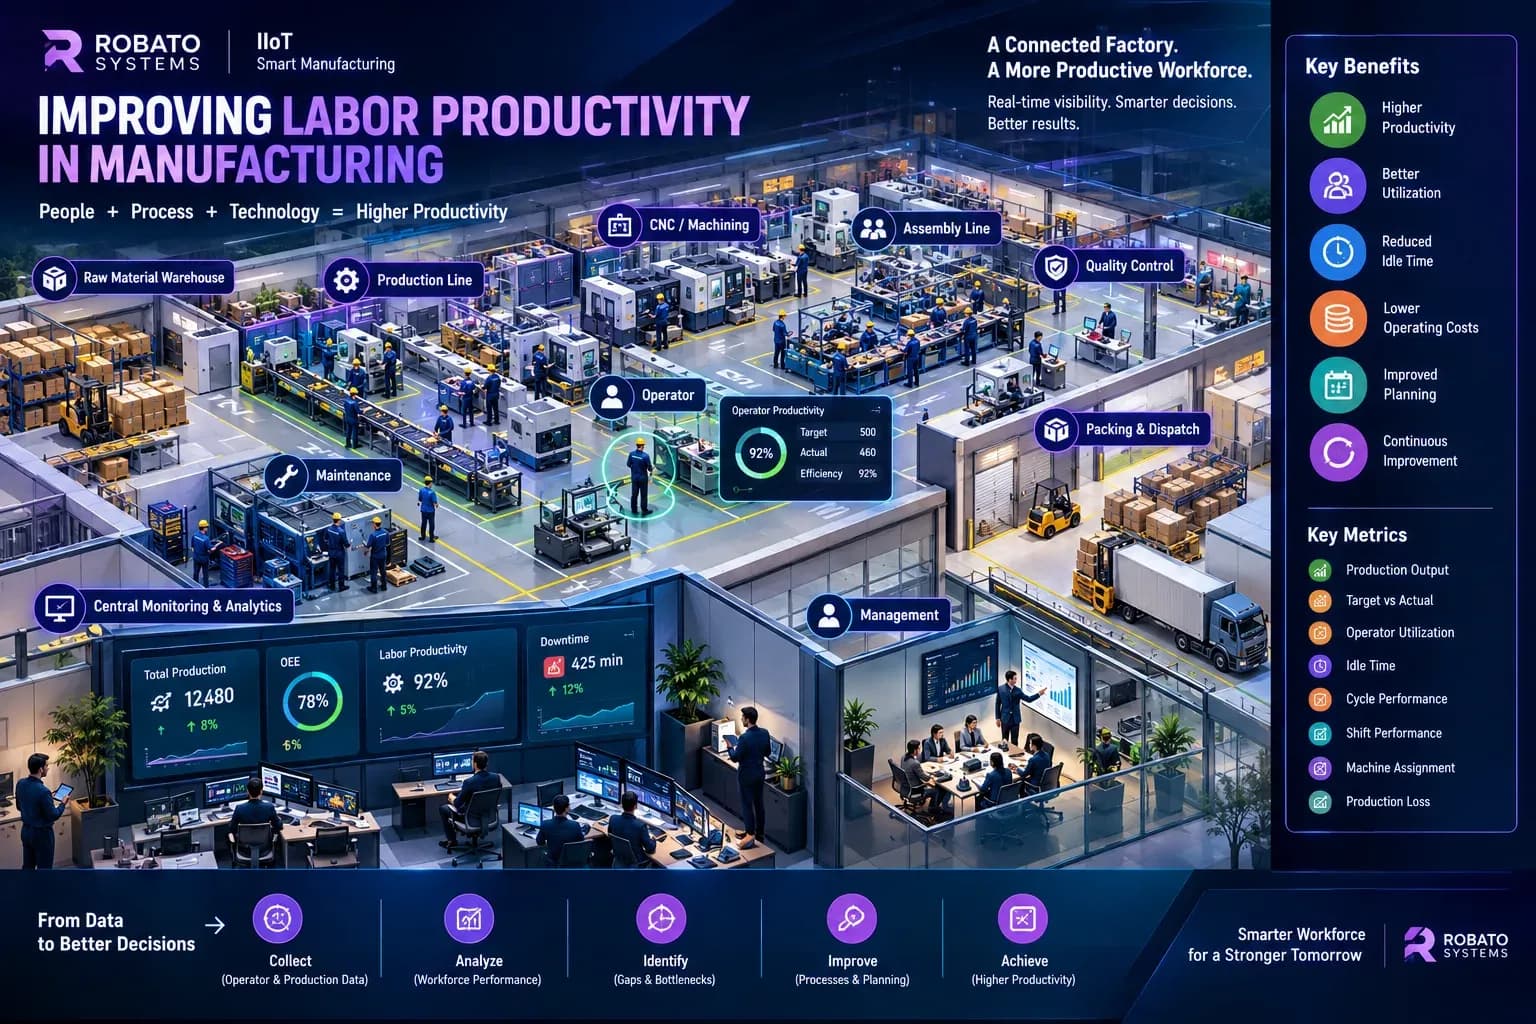
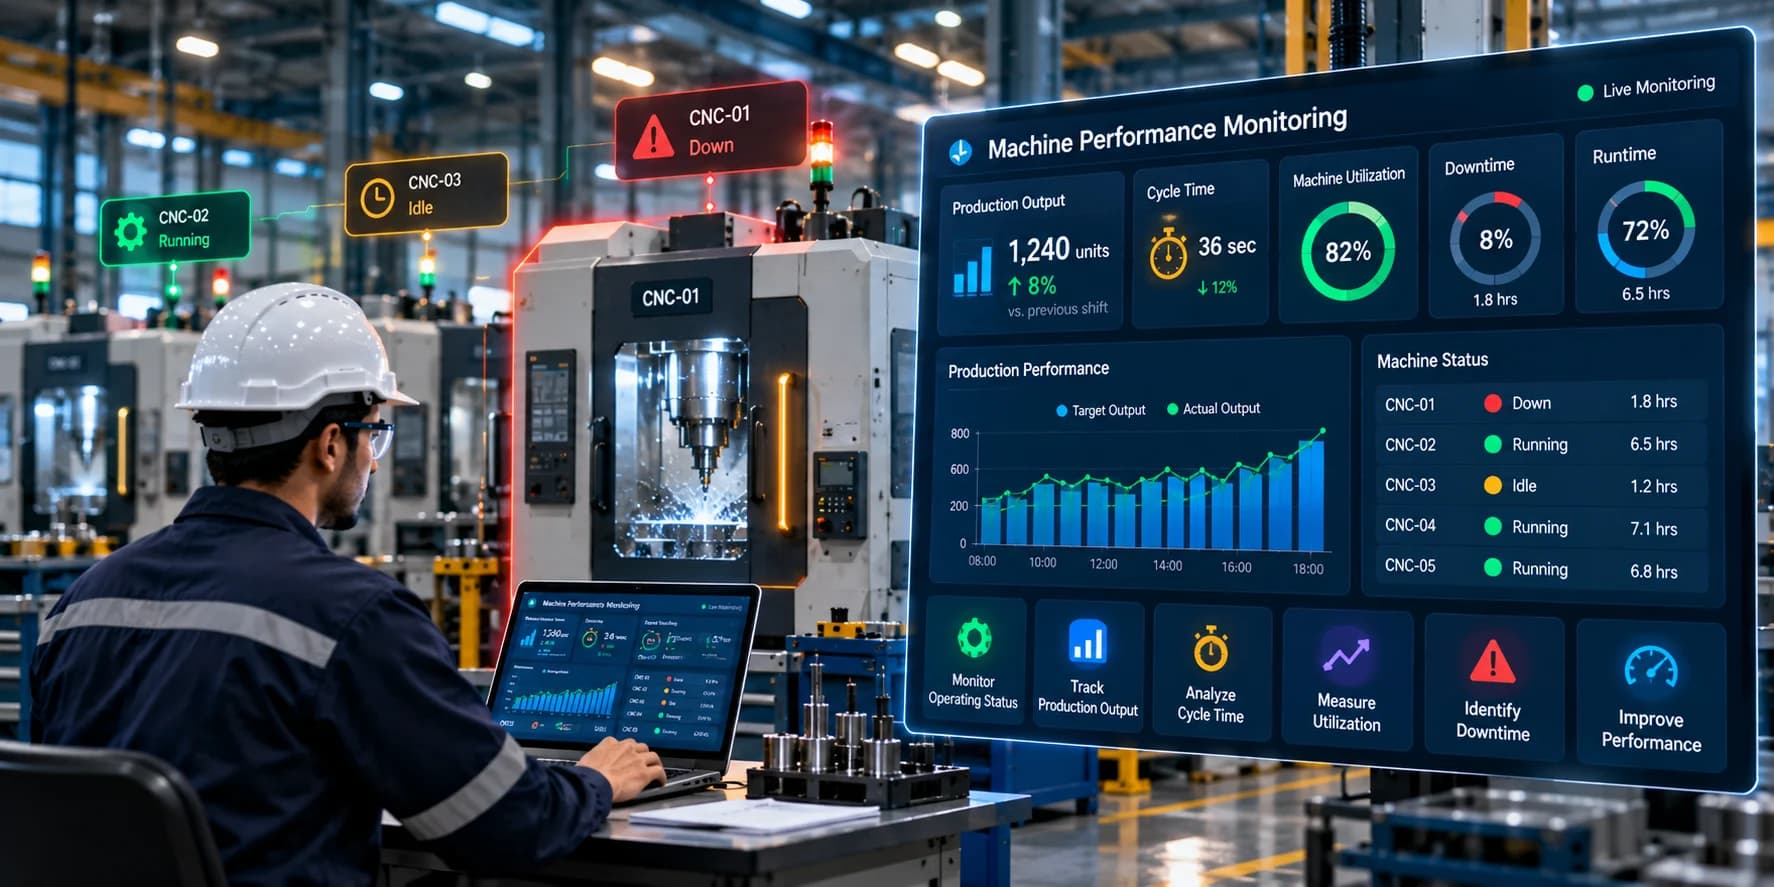
The dashboard becomes even more useful when operator information is connected with machine status, downtime, production, and OEE data.
What is an Operator KPI Dashboard?
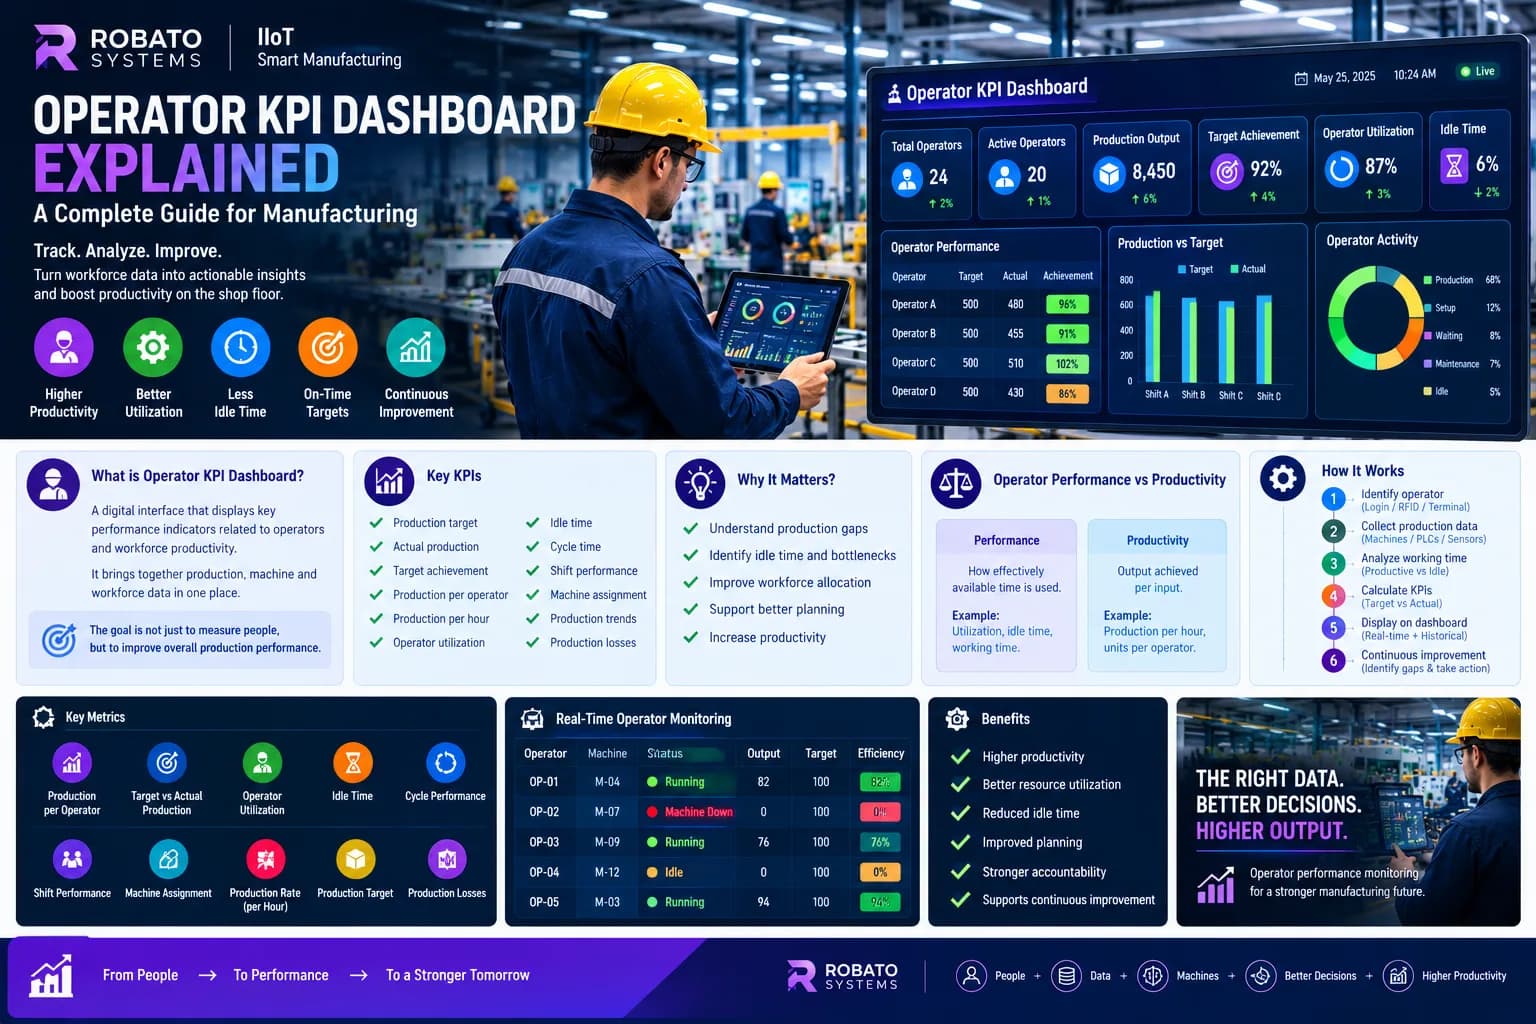
An operator KPI dashboard is a digital interface that displays key performance indicators related to operators and workforce productivity in a manufacturing environment.
Depending on the production process, an operator KPI dashboard may display:
- Production target
- Actual production
- Target achievement
- Production per operator
- Production per hour
- Operator utilization
- Idle time
- Cycle time
- Shift performance
- Operator-machine assignment
- Production trends
- Machine downtime affecting operator output
The purpose is to provide a simple and centralized way to understand workforce-related production performance.
Instead of searching through several reports, managers can use the dashboard to identify important trends and production gaps.
Why Do Manufacturing Plants Need an Operator KPI Dashboard?
Production managers often need to make decisions quickly.
During a shift, they may need answers to questions such as:
- Are we on track to achieve today's target?
- Which production areas are behind schedule?
- How much production has each operator completed?
- Where is operator idle time increasing?
- Which shift has lower production achievement?
- Is low operator output related to machine downtime?
- Where should workforce resources be allocated?
Without a centralized dashboard, answering these questions may require collecting information from multiple sources.
An operator KPI dashboard brings relevant information into one place.
Important KPIs for an Operator Dashboard
The right KPIs depend on the manufacturing process, but several metrics are commonly useful.
1. Production Target
The production target represents the expected quantity for a defined period.
Targets can be established for:
- Shift
- Day
- Production order
- Machine
- Workstation
- Operator activity
A dashboard can show the target alongside actual production to provide immediate visibility into progress.
2. Actual Production
Actual production represents the quantity produced during a defined period.
Displaying actual production next to the target helps managers identify production gaps.
For example:
Target: 1,000 units
Actual: 920 units
The dashboard can immediately show that production is below the planned quantity.
3. Target Achievement
Target achievement expresses actual production relative to the target.
For example, if the target is 1,000 units and actual production is 920 units, target achievement is 92%.
This metric provides a quick indication of production progress.
4. Production Per Operator
Production per operator helps managers understand how much output is associated with each operator during a defined period.
This can be useful for analyzing similar production activities and identifying workforce capacity requirements.
5. Production Per Hour
Production per hour helps measure the production rate.
It can be tracked by:
- Operator
- Machine
- Shift
- Production line
- Product
This KPI can help identify processes with consistently slower production rates.
6. Operator Utilization
Operator utilization measures how much of the available operator time is being used productively.
Low utilization may be associated with:
- Waiting
- Machine downtime
- Material shortages
- Process delays
- Poor workforce allocation
- Lack of production work
The reason behind low utilization should always be investigated.
7. Idle Time
Idle time measures periods where an operator is available but production activity is not progressing.
Tracking idle time can help identify recurring process problems.
For example, if multiple operators frequently wait for material, the problem may be related to material handling rather than individual operator performance.
8. Cycle Time
Cycle time measures how long a production cycle takes.
Comparing actual cycle time with the standard cycle time can help identify production variations.
9. Shift Performance
Shift-level KPIs allow managers to understand production performance across different shifts.
A dashboard may compare:
- Target achievement
- Production quantity
- Production rate
- Utilization
- Idle time
- Downtime
This provides a broader understanding of shift performance.
Operator KPI Dashboard Design
A good operator KPI dashboard should prioritize clarity.
The dashboard should not simply display every available piece of data.
Instead, important information should be organized according to the user's role.
For example:
Operator View
Operators may need to see:
- Current target
- Actual production
- Remaining target
- Production rate
- Current shift progress
Supervisor View
Supervisors may need:
- Operator performance
- Machine status
- Target achievement
- Idle time
- Production gaps
- Shift performance
Production Manager View
Production managers may need:
- Department performance
- Workforce utilization
- Production trends
- Shift comparison
- Productivity gaps
- Machine and operator relationships
Plant Manager View
Plant managers may require:
- Overall workforce productivity
- Production achievement
- Department-level performance
- Productivity trends
- Major production losses
Role-based dashboards prevent users from being overwhelmed by unnecessary information.
Real-Time Operator KPI Dashboard
One of the major advantages of a digital operator KPI dashboard is the ability to provide current production information.
Traditional reports may only become available after a shift.
A real-time dashboard can show production progress while the shift is still running.
For example:
Shift target: 800 units
Current production: 540 units
Expected production at current time: 620 units
The dashboard can highlight the production gap.
The supervisor can then investigate the cause before the shift ends.
This creates a faster improvement cycle:
Monitor → Identify → Investigate → Act
Operator KPI Dashboard and Machine Data
Operator performance should not be analyzed separately from machine performance.
Consider an operator assigned to a machine for an eight-hour shift.
If the machine experiences two hours of unplanned downtime, the operator may have significantly less productive production time.
A dashboard that only shows operator output could provide an incomplete picture.
A connected dashboard can show:
Operator + Machine + Production + Downtime
This provides better context.
Managers can determine whether a production gap is associated with:
- Machine downtime
- Operator idle time
- Material shortages
- Slow cycles
- Production planning
- Other process issues
Operator KPI Dashboard and OEE
OEE and operator KPIs measure different aspects of manufacturing performance.
OEE commonly evaluates equipment performance using:
- Availability
- Performance
- Quality
Operator KPIs focus more on workforce-related production performance.
Combining these views can help managers understand how machine and workforce performance interact.
For example:
Low OEE + high machine downtime + low operator output
may indicate that equipment availability is affecting workforce productivity.
On the other hand:
High machine availability + consistently slow production cycles
may require investigation into the production process or operating method.
The dashboard should help users investigate these relationships rather than assume a single cause.
Benefits of an Operator KPI Dashboard
Faster Decision-Making
Managers can access important production information from one centralized location.
Better Workforce Visibility
Production teams can understand how available workforce capacity is being utilized.
Improved Target Monitoring
Target versus actual production can be monitored throughout the shift.
Reduced Reporting Effort
Automated dashboards reduce the need for manually preparing repetitive production reports.
Better Shift Management
Supervisors can identify production gaps and workforce issues during the shift.
Historical Performance Analysis
Historical KPI data can reveal recurring trends.
Better Resource Allocation
Managers can use productivity information to support workforce planning.
Improved Continuous Improvement
Production teams can use KPI trends to identify areas for process improvement.
Operator KPI Dashboard for Shift Management
Shift management becomes easier when supervisors have access to current production information.
A dashboard can help supervisors monitor:
- Shift target
- Actual production
- Operator availability
- Operator utilization
- Idle time
- Machine downtime
- Production rate
- Target achievement
If production falls behind, the supervisor can investigate immediately.
This is more effective than waiting until the shift ends to discover that the target was missed.
Operator-Wise Performance Dashboard
A dashboard can also provide an operator-wise view.
For example, production managers may be able to analyze:
Operator A
- Target
- Actual
- Production rate
- Utilization
- Idle time
Operator B
- Target
- Actual
- Production rate
- Utilization
- Idle time
This can help identify performance trends.
However, operators should be compared only when the production conditions are reasonably comparable.
Differences in product type, machine availability, production complexity, or downtime can affect the results.
Avoid Using a Single KPI
One of the most important dashboard design principles is to avoid relying on a single metric.
Suppose an operator has low production output.
Looking only at production quantity does not explain why.
The dashboard should allow managers to review related information such as:
- Machine downtime
- Idle time
- Cycle time
- Production target
- Product type
- Shift
- Quality issues
This provides context for the KPI.
Use KPI Trends Instead of Single-Day Results
A single day's performance may not represent a long-term pattern.
A dashboard should provide historical trends where appropriate.
Managers can analyze:
- Daily performance
- Weekly performance
- Monthly performance
- Shift trends
- Product trends
- Machine trends
If the same production area repeatedly shows lower productivity, it may indicate a process issue worth investigating.
Manufacturing Workforce Analytics
An operator KPI dashboard can become part of a broader workforce analytics system.
Historical information can help manufacturers understand:
- Workforce utilization
- Production capacity
- Operator allocation
- Shift requirements
- Productivity trends
- Training opportunities
This can support workforce planning and production management.
How to Build an Operator KPI Dashboard
Step 1: Define the Business Objective
Determine what the dashboard is intended to improve.
Possible objectives include:
- Productivity
- Target achievement
- Workforce utilization
- Shift management
- Production visibility
Step 2: Select Relevant KPIs
Start with a focused KPI set.
For example:
- Target
- Actual
- Achievement
- Production per hour
- Utilization
- Idle time
Step 3: Identify Data Sources
Determine where the required data will come from.
Sources may include:
- Machine PLCs
- Production counters
- Sensors
- Manufacturing software
- Operator login systems
- Production orders
- Shift systems
Step 4: Connect Operators to Production
Define how operator information will be associated with production activity.
This may involve:
- Employee ID
- Operator login
- RFID
- Barcode
- Workstation assignment
- Machine assignment
Step 5: Create Dashboard Views
Create dashboards based on the requirements of operators, supervisors, managers, and plant leadership.
Step 6: Validate Data
Make sure production counts, operator assignments, shift information, and machine status are accurate.
Incorrect data can produce misleading KPIs.
Step 7: Review and Improve
Dashboard requirements may change as the manufacturing process evolves.
Review the KPIs regularly and remove information that does not contribute to decision-making.
Common Mistakes in Operator KPI Dashboards
Too Many Metrics
A dashboard with too many KPIs can make important information difficult to find.
Poor Data Quality
Incorrect production or operator information can make dashboard results unreliable.
No Historical Trends
Real-time data is useful, but historical trends are also important for identifying recurring problems.
Ignoring Machine Conditions
Operator productivity should be interpreted alongside machine availability and downtime.
Using Unclear KPI Definitions
Everyone should understand exactly how each KPI is calculated.
Making the Dashboard Too Complex
The interface should be easy for production teams to understand.
Best Practices for Operator KPI Dashboard Design
Keep Important KPIs Visible
Users should not need to search through multiple screens to find critical production information.
Use Consistent KPI Definitions
Define how production, utilization, idle time, and achievement are calculated.
Provide Drill-Down Capability
Allow managers to move from plant-level information to department, machine, shift, and operator details where appropriate.
Connect Related Data
Combine operator information with production and machine data.
Use Historical Trends
Show performance over time to identify recurring patterns.
Make Dashboards Role-Specific
Different users require different information.
Focus on Actionable Information
Every major KPI should help users understand a production condition or make a decision.
Manual Reports vs Operator KPI Dashboard
Traditional reporting often involves:
- Paper records
- Excel spreadsheets
- Manual calculations
- Supervisor observations
- End-of-shift reports
A digital dashboard can automate many of these activities.
| Manual Reports | Operator KPI Dashboard |
|---|---|
| Data collected manually | Data can be collected automatically |
| Delayed information | Real-time or near real-time visibility |
| Manual calculations | Automated KPI calculations |
| Difficult trend analysis | Historical trend analysis |
| Time-consuming reporting | Automated reporting |
| Multiple data sources | Centralized information |
The objective is not simply to replace reports.
It is to provide production teams with information that is easier to access and act upon.
Industry 4.0 and Operator KPI Dashboards
Industry 4.0 manufacturing environments increasingly connect machines, sensors, production systems, and workforce information.
An operator KPI dashboard can become part of this connected architecture.
A manufacturing environment can connect:
Machines + Operators + Production + Downtime + Quality + OEE
This creates a broader production intelligence environment.
Managers can analyze how workforce utilization, machine availability, production output, and process performance interact.
Operator KPI Dashboard with Robato Systems
Robato Systems helps manufacturers build connected production monitoring solutions that bring machine, production, and operational information into a centralized digital environment.
An operator KPI dashboard can provide visibility into production targets, actual output, operator assignments, utilization, idle time, shift performance, production rates, and related manufacturing KPIs.
When these KPIs are connected with machine status, downtime, production counts, and OEE information, production managers can gain better context around workforce and production performance.
The objective is to help manufacturing teams identify productivity gaps, understand production losses, and make data-driven operational decisions.
Conclusion
An operator KPI dashboard provides manufacturers with a centralized way to monitor workforce-related production performance.
Instead of depending entirely on manual reports, managers can view important KPIs such as target versus actual production, production per hour, operator utilization, idle time, cycle performance, and shift achievement.
The most effective dashboards do not simply display numbers. They provide context.
Connecting operator information with machine status, downtime, production, and OEE data can help managers understand why performance changes and where improvement opportunities exist.
A well-designed dashboard should be simple, role-specific, accurate, and focused on actionable information.
As manufacturing plants move toward Industry 4.0, operator KPI dashboards can become an important part of a connected production monitoring and workforce analytics strategy.
FAQs
What is an operator KPI dashboard?
An operator KPI dashboard is a digital dashboard that displays key performance indicators related to operator productivity, utilization, production output, target achievement, and workforce performance.
What KPIs should an operator dashboard include?
Common KPIs include target versus actual production, production per operator, production per hour, operator utilization, idle time, cycle time, and shift performance.
Can an operator KPI dashboard work in real time?
Yes. When connected to production systems and machine data, an operator KPI dashboard can provide real-time or near real-time production visibility.
Why should operator KPIs be connected with machine data?
Machine downtime and availability can directly affect operator production. Combining both data sources provides better context for performance analysis.
How does an operator KPI dashboard improve productivity?
It helps managers identify production gaps, idle time, utilization issues, and recurring performance trends so that corrective actions can be taken.
Can operator KPI dashboards track multiple shifts?
Yes. A dashboard can provide shift-wise production, utilization, target achievement, and other KPI information.
Should operators be compared using only production output?
No. Production output should be considered alongside machine availability, downtime, product complexity, production targets, and other relevant operating conditions.
How does an operator KPI dashboard support Industry 4.0?
It can connect workforce information with machine, production, downtime, and quality data to provide a more connected view of manufacturing performance.