Manufacturing plants depend on people, machines, materials, and processes working together efficiently. While manufacturers have traditionally focused heavily on machine performance and production output, workforce performance is equally important.
Operators control machines, perform production activities, handle materials, respond to process issues, and contribute directly to production output.
However, understanding workforce performance across a manufacturing plant can be difficult when information is spread across paper reports, spreadsheets, production systems, and supervisor observations.
This is where workforce analytics for manufacturing becomes valuable.
Workforce analytics helps manufacturers collect and analyze workforce-related production data to understand productivity, utilization, shift performance, labor efficiency, and production trends.
When workforce data is combined with machine and production information, manufacturers can gain a more complete view of how their factory is operating.
What is Workforce Analytics in Manufacturing?
Workforce analytics in manufacturing is the process of collecting, analyzing, and interpreting workforce-related data to improve production and operational performance.
Manufacturing workforce analytics can include information such as:
- Operator productivity
- Production per operator
- Labor utilization
- Operator idle time
- Target versus actual production
- Shift performance
- Production per hour
- Operator-machine assignments
- Working hours
- Production trends
- Workforce allocation
- Production losses
The purpose is to transform workforce data into useful information for production planning and continuous improvement.
Instead of asking only how many employees are working, managers can understand how available workforce capacity is being utilized.
Why is Workforce Analytics Important for Manufacturing?
Manufacturing plants can have hundreds of operators working across multiple machines, lines, departments, and shifts.
Managing this workforce using manual reports can become difficult as production complexity increases.
Workforce analytics provides visibility into questions such as:
- How productive is the workforce?
- Which production areas have the highest workload?
- Where is operator idle time increasing?
- Which shifts are consistently behind target?
- How much production is generated per labor hour?
- Where is workforce capacity being underutilized?
- Are machine problems affecting operator productivity?
- Where might additional training be required?
These insights can support better production decisions.
Key Areas of Manufacturing Workforce Analytics
A complete workforce analytics system can cover several areas of production performance.
1. Workforce Productivity
Workforce productivity measures production output relative to the labor resources used.
A basic productivity measurement is:
Labor Productivity = Production Output / Labor Input
Labor input can be represented by labor hours, operator hours, or another relevant workforce measurement.
2. Operator Utilization
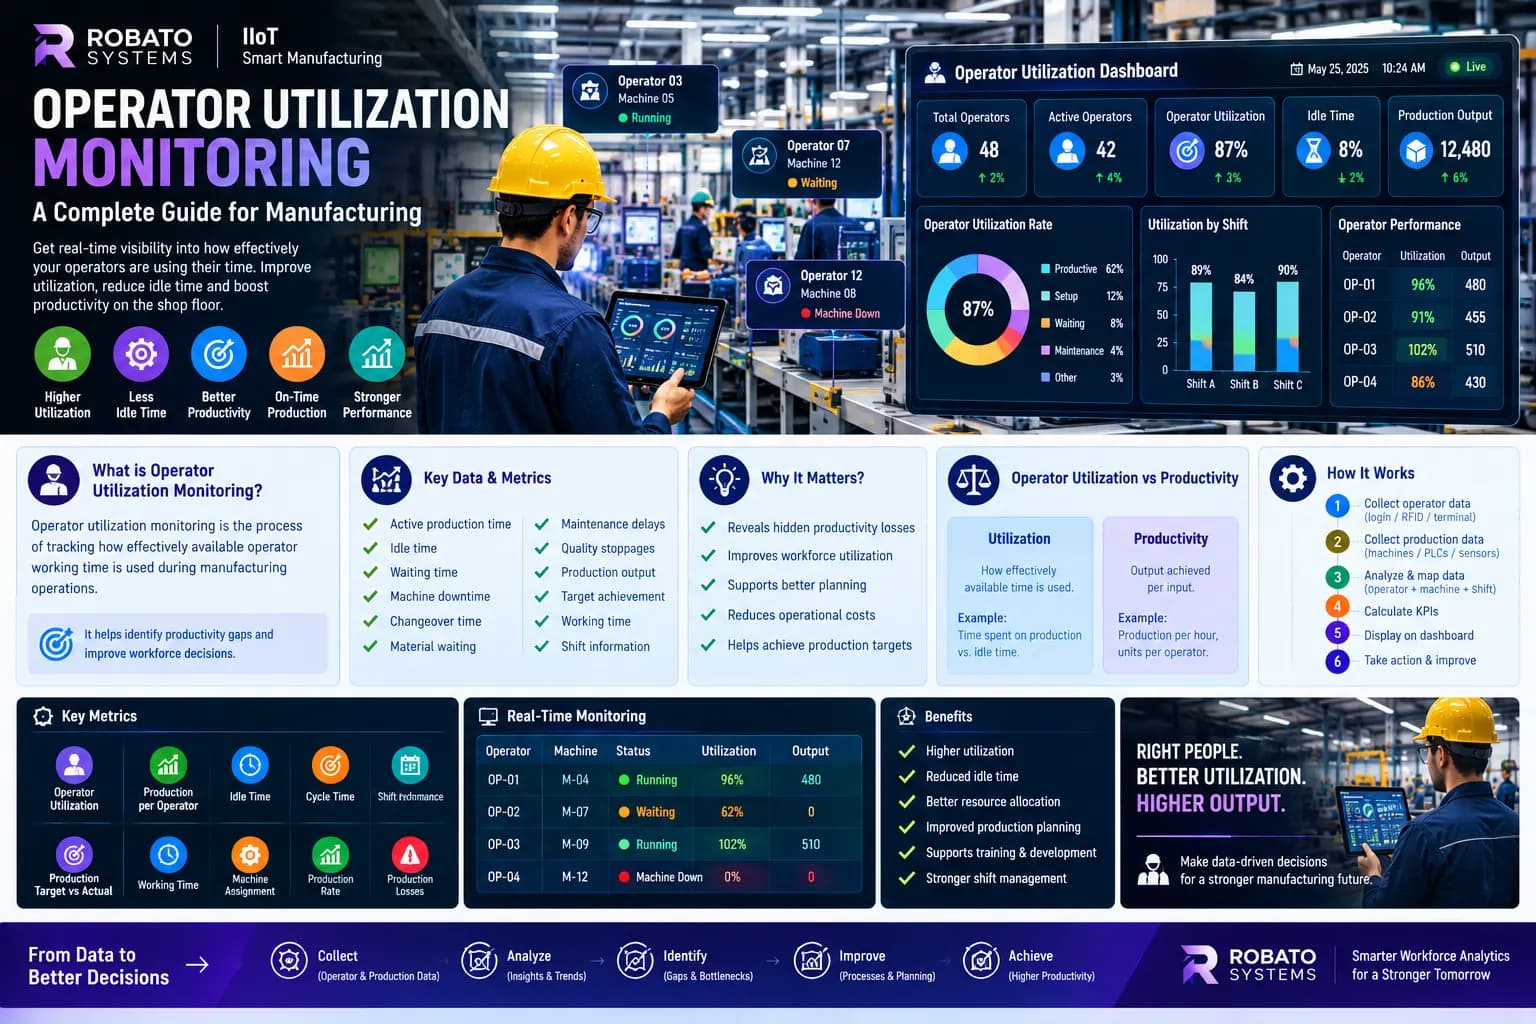
Operator utilization measures how effectively available workforce time is being used.
Low utilization can result from:
- Machine downtime
- Material shortages
- Production delays
- Changeovers
- Waiting
- Poor workforce allocation
Analytics can help identify the causes behind low utilization.
3. Production Per Operator
Production per operator helps manufacturers understand output associated with workforce resources.
This metric can be analyzed by:
- Shift
- Machine
- Product
- Production line
- Department
- Date
4. Shift Performance
Manufacturing plants often operate multiple shifts.
Workforce analytics can compare production and workforce performance across different shifts.
Managers can analyze:
- Production quantity
- Target achievement
- Operator utilization
- Idle time
- Production rate
- Machine availability
5. Workforce Allocation
Analytics can help managers understand where workforce resources are being used.
For example, one production line may have high workload while another has available capacity.
This information can support better workforce allocation decisions.
Important Workforce Analytics KPIs
Selecting the right KPIs is important.
A dashboard should focus on metrics that help managers understand production performance.
Target vs Actual Production
This KPI compares planned production with actual production.
For example:
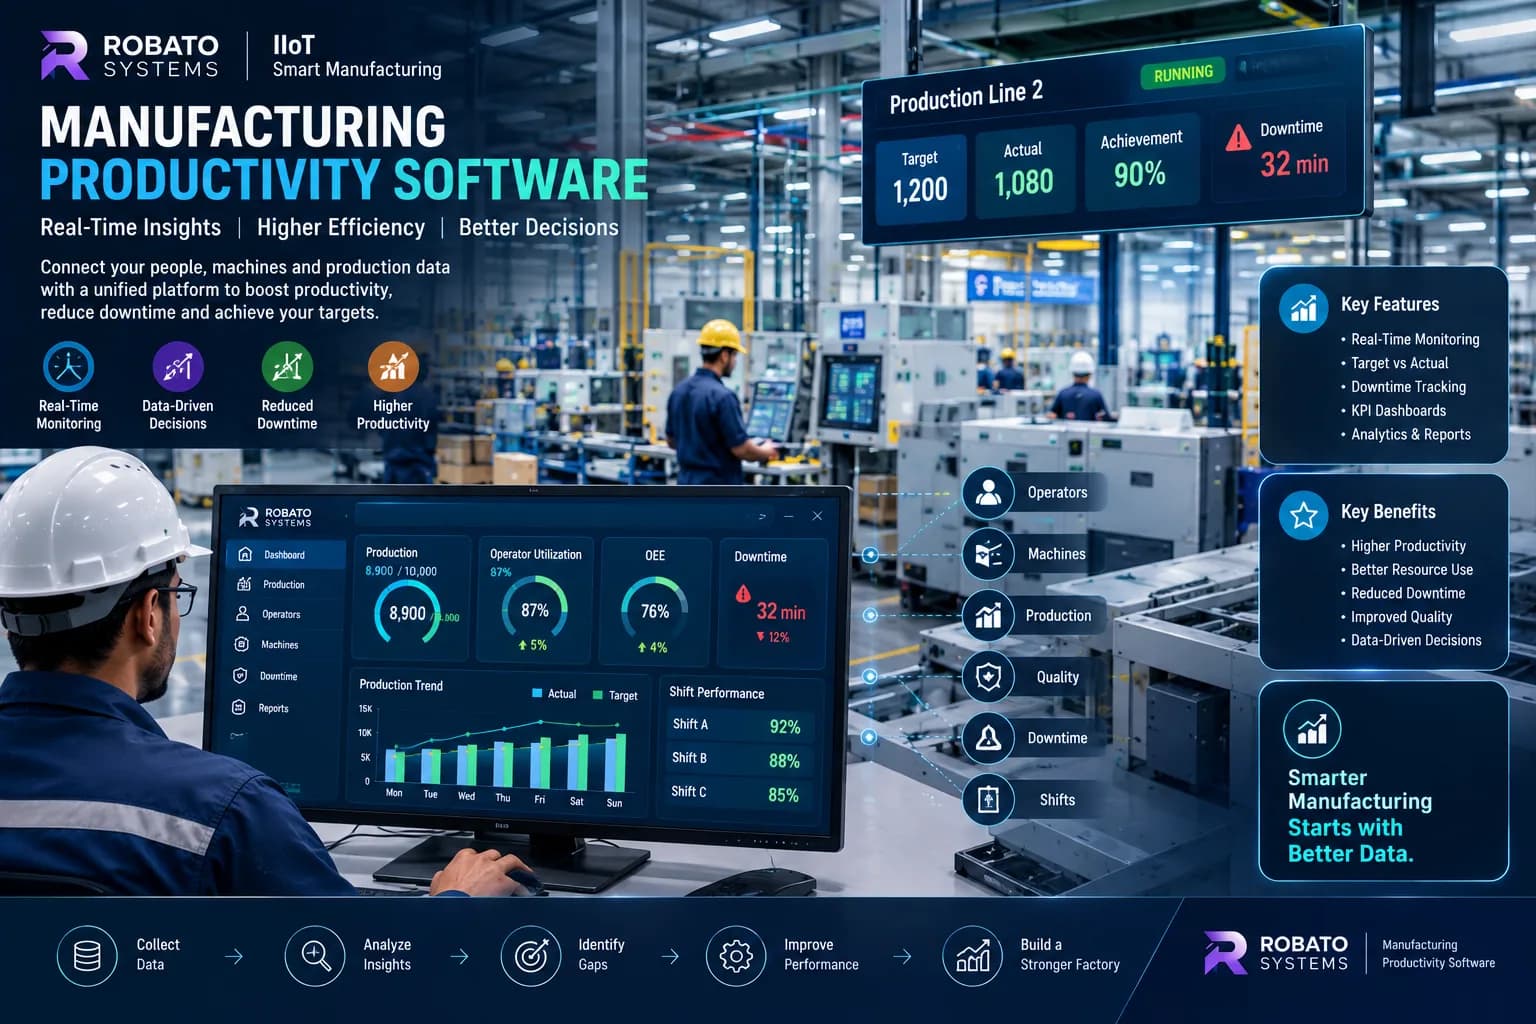
Target: 1,200 units
Actual: 1,080 units
The 120-unit gap can then be investigated.
Production Per Labor Hour
This measures production output relative to labor hours.
It can help manufacturers understand workforce productivity over time.
Operator Utilization
This measures how much available operator time is being used productively.
Idle Time
Idle time identifies periods when operators are available but production activity is not progressing.
Production Per Operator
This provides an operator-level view of production output.
Shift Productivity
Shift productivity provides a broader view of workforce performance across different working periods.
Cycle Time Performance
Comparing actual cycle time with standard cycle time can help identify production variations.
Real-Time Workforce Analytics
Traditional workforce analysis is often performed after production data has been collected.
A production manager may receive a report at the end of the shift showing that the target was missed.
At that point, the opportunity to correct the problem during the shift has already passed.
Real-time workforce analytics changes this approach.
A digital dashboard can provide current information about:
- Production progress
- Target achievement
- Operator activity
- Machine status
- Downtime
- Shift performance
- Utilization
For example:
Shift target: 1,000 units
Current production: 620 units
Expected production: 700 units
The production team can investigate the 80-unit gap while the shift is still running.
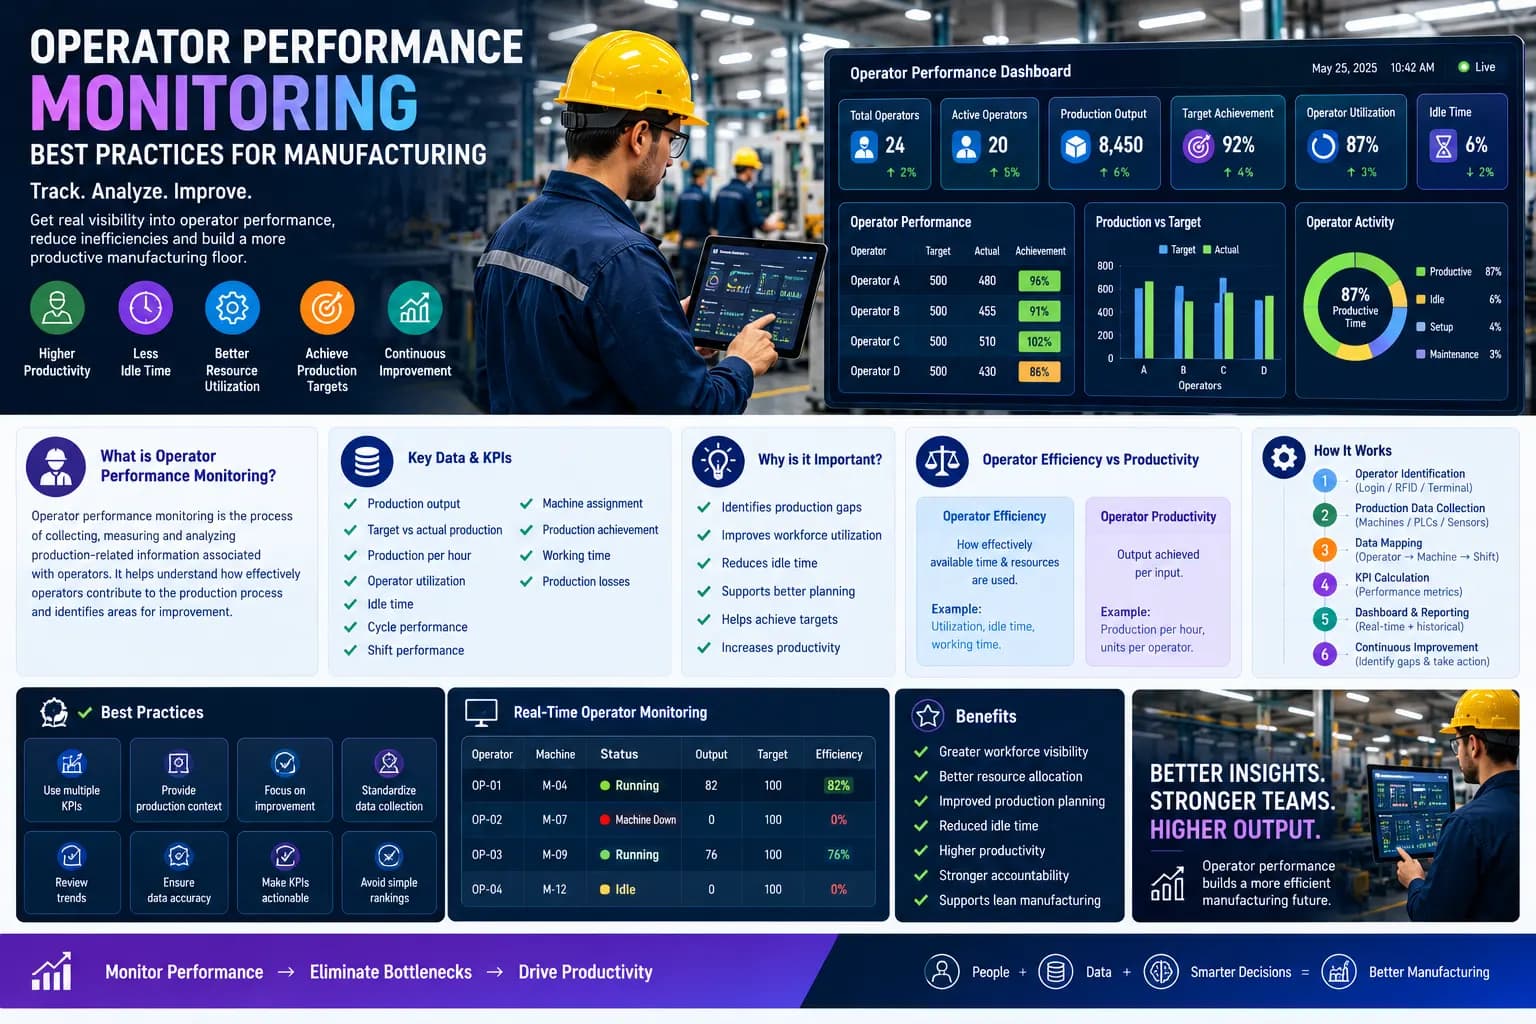
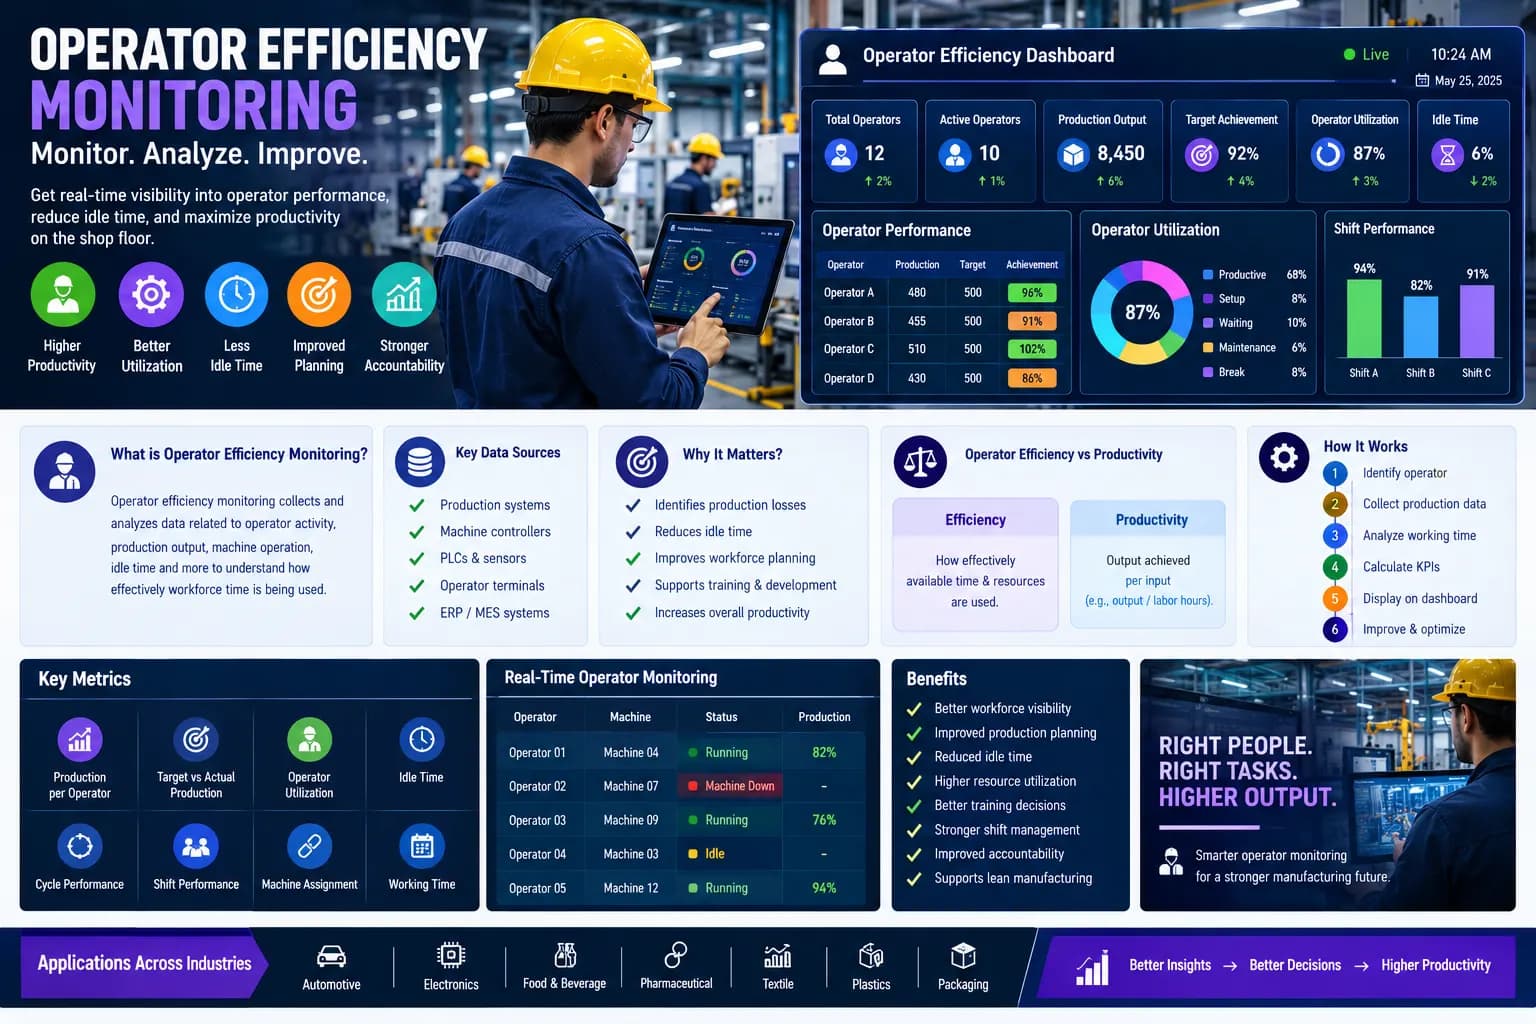
Workforce Analytics Dashboard
A manufacturing workforce analytics dashboard should make complex data easy to understand.
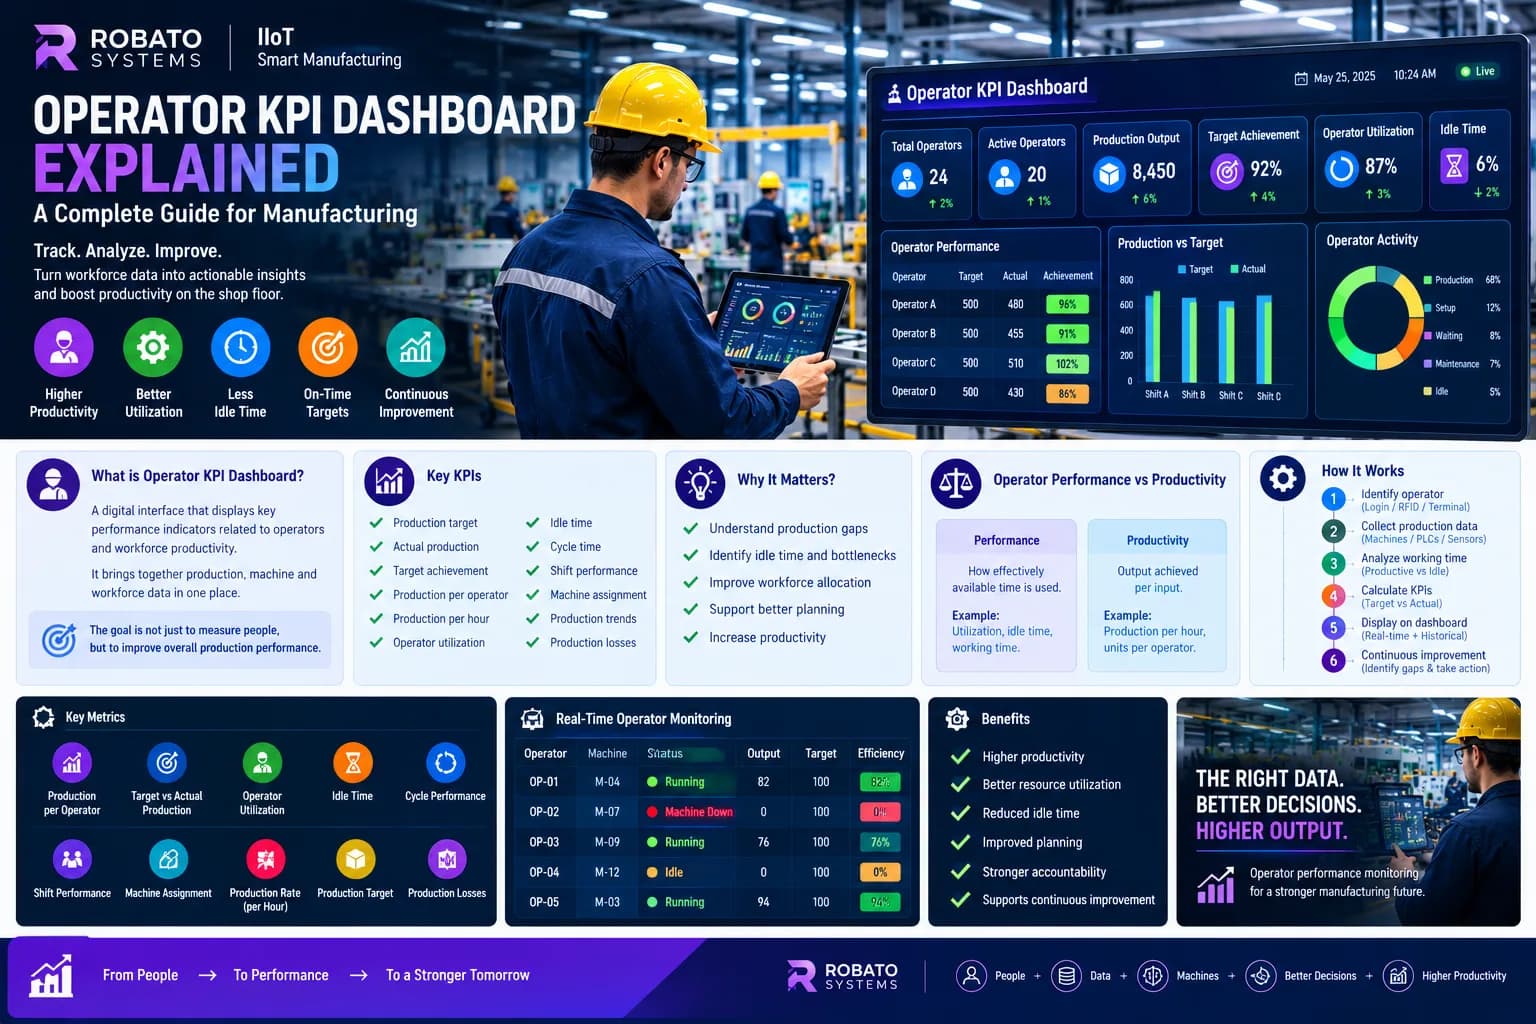
Important dashboard sections can include:
- Total operators
- Active operators
- Production target
- Actual production
- Target achievement
- Production per operator
- Production per hour
- Operator utilization
- Idle time
- Shift performance
- Machine downtime
- Productivity trends
The dashboard can provide different views for different users.
Supervisor Dashboard
Supervisors may need:
- Current production
- Operator status
- Target achievement
- Machine status
- Idle time
- Production gaps
Production Manager Dashboard
Production managers may need:
- Department productivity
- Shift comparison
- Workforce utilization
- Production trends
- Operator performance
- Machine-related productivity losses
Plant Manager Dashboard
Plant managers may focus on:
- Overall workforce productivity
- Production achievement
- Workforce utilization
- Department trends
- Major productivity losses
Workforce Analytics and Operator Performance
Workforce analytics can provide deeper visibility into operator performance.
However, operator performance should always be evaluated in context.
For example, an operator may have lower production because the assigned machine experienced significant downtime.
Another operator may have higher output because their machine was available for the entire shift.
Therefore, workforce analytics should connect:
Operator + Machine + Production + Downtime
This creates a more complete picture.
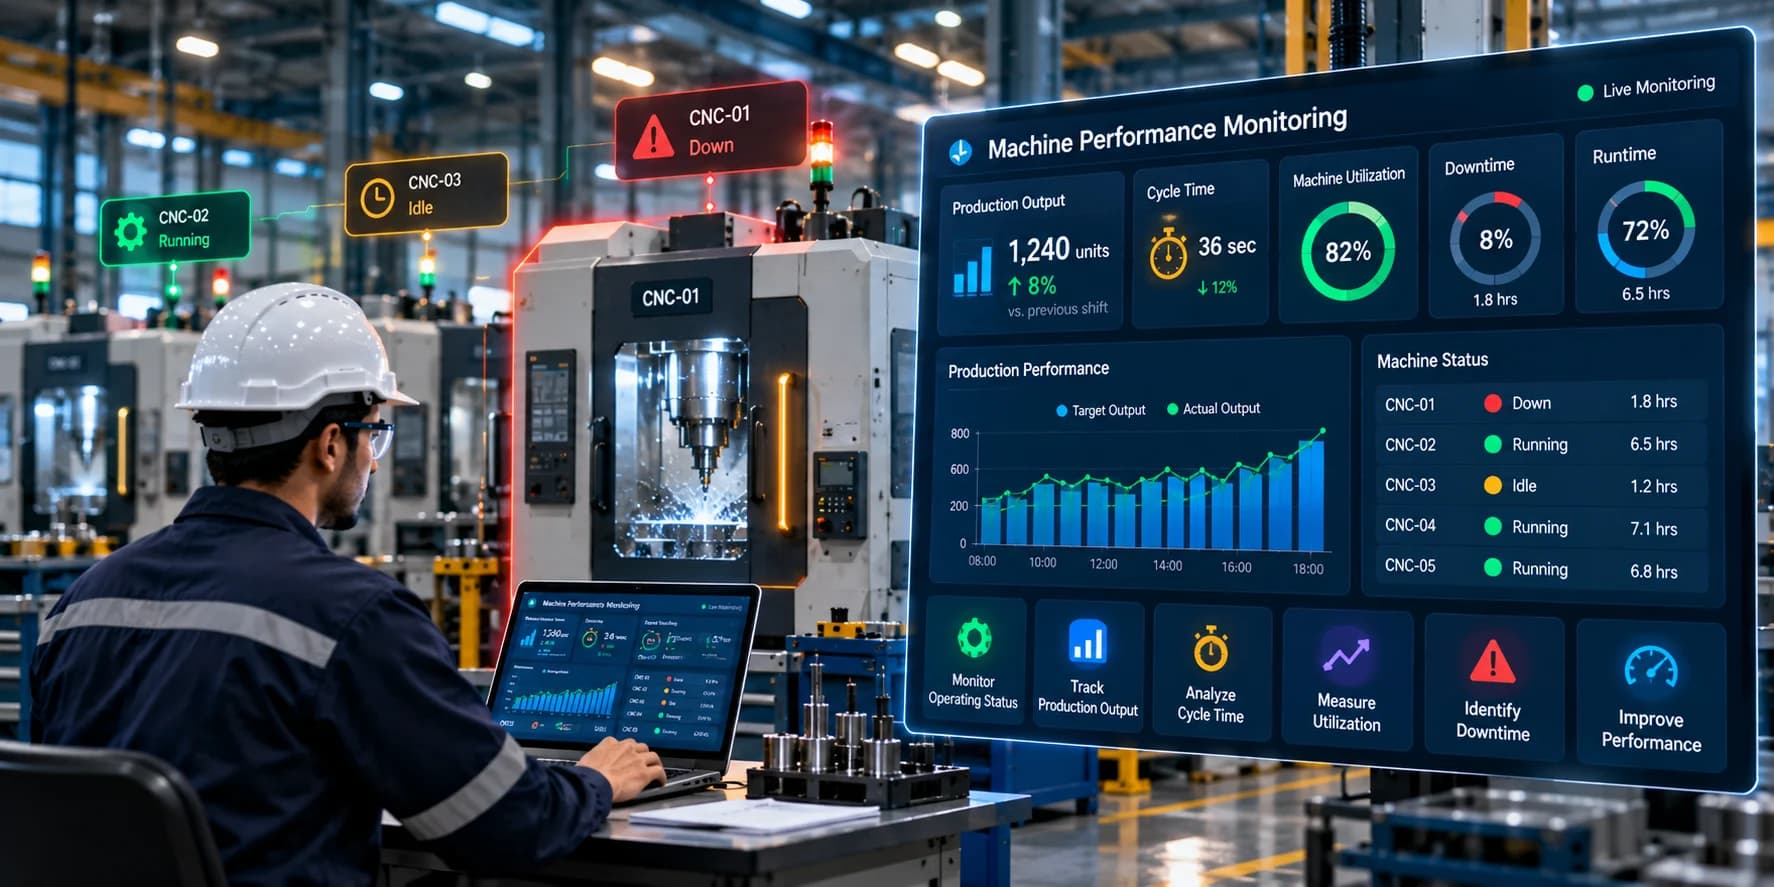
Workforce Analytics and Machine Downtime
Machine downtime is one of the important factors that can affect workforce productivity.
If a machine stops unexpectedly, the assigned operator may not be able to continue producing.
A workforce analytics platform that includes machine status can identify relationships between:
- Operator idle time
- Machine downtime
- Production loss
- Shift performance
This helps managers determine whether low workforce productivity is caused by operator-related factors or equipment and process issues.
Workforce Analytics for Shift Management
Managing multiple shifts can be challenging.
Each shift may have different:
- Operators
- Production targets
- Product mix
- Machine availability
- Workload
- Downtime
Workforce analytics helps managers compare these conditions.
For example, if one shift consistently achieves lower production, managers can investigate:
- Staffing levels
- Machine downtime
- Product complexity
- Material availability
- Changeovers
- Production scheduling
The goal is to identify the reason behind the difference rather than simply compare the final production numbers.
Workforce Analytics for Workforce Planning
Historical workforce data can support better production planning.
Managers can analyze previous production periods to understand:
- Required workforce
- Production capacity
- Operator utilization
- Shift requirements
- Production per labor hour
This information can support decisions related to workforce scheduling and production planning.
For example, if historical data shows that a production line regularly requires additional operators during specific periods, management can plan workforce allocation accordingly.
Workforce Analytics and Training
Workforce analytics can also help identify potential training requirements.
If certain processes consistently show:
- Low production rates
- Long cycle times
- Repeated process deviations
- Quality issues
management can investigate whether additional training or process support is required.
Analytics does not automatically determine the cause, but it can highlight areas that require further investigation.
Workforce Analytics for Continuous Improvement
Continuous improvement requires reliable information.
Workforce analytics can help identify recurring patterns such as:
- High idle time
- Low operator utilization
- Slow production cycles
- Repeated shift-level production gaps
- Poor workforce allocation
- Machine-related waiting
Once these patterns are identified, improvement teams can investigate the root causes and implement changes.
The improvement cycle becomes:
Measure → Analyze → Improve → Measure Again
Benefits of Workforce Analytics for Manufacturing
Better Workforce Visibility
Managers gain a clearer understanding of workforce utilization and production performance.
Improved Production Planning
Historical workforce data can support better planning of production and staffing requirements.
Reduced Idle Time
Analytics can identify where operators spend time waiting for machines, materials, or processes.
Better Workforce Allocation
Production managers can use workload information to distribute workforce resources more effectively.
Faster Problem Identification
Real-time dashboards can highlight production gaps while the shift is still running.
Better Shift Management
Managers can analyze performance across different shifts and investigate recurring variations.
Data-Driven Training
Performance trends can highlight processes that may require additional training or support.
Improved Productivity
Identifying and addressing workforce-related production losses can help improve overall manufacturing productivity.
Manual Workforce Analytics vs Digital Workforce Analytics
Traditional workforce analysis may rely on:
- Paper records
- Excel spreadsheets
- Manual calculations
- Supervisor observations
- End-of-shift reports
These approaches can become difficult to maintain as the factory grows.
Digital workforce analytics can automate data collection and provide centralized reporting.
| Manual Analytics | Digital Workforce Analytics |
|---|---|
| Manual data collection | Automated data collection |
| Delayed reporting | Real-time or near real-time visibility |
| Difficult historical analysis | Historical trend analysis |
| High reporting effort | Automated reports |
| Multiple data sources | Centralized dashboards |
| Manual calculations | Automated KPI calculations |
Digital analytics can reduce administrative work and provide faster access to production information.
How to Implement Workforce Analytics in a Manufacturing Plant
Step 1: Define Business Objectives
Identify what the plant wants to improve.
Possible objectives include:
- Labor productivity
- Operator utilization
- Shift performance
- Workforce allocation
- Production target achievement
Step 2: Identify Workforce Data
Determine which workforce information is required.
This may include:
- Operator identity
- Shift
- Machine assignment
- Working time
- Production activity
Step 3: Connect Production Data
Integrate production counts, machine status, sensors, PLCs, or manufacturing software.
Step 4: Define KPIs
Select a focused set of workforce KPIs.
Examples include:
- Production per operator
- Target achievement
- Utilization
- Idle time
- Production per hour
Step 5: Build Dashboards
Create dashboards for supervisors, production managers, and plant managers.
Step 6: Validate the Data
Make sure operator assignments, production counts, shifts, and machine information are accurate.
Step 7: Analyze Trends
Use historical data to identify recurring patterns.
Step 8: Implement Improvements
Use the insights to improve workforce allocation, training, production processes, and machine availability.
Best Practices for Manufacturing Workforce Analytics
Start With Clear Objectives
Do not collect workforce data without knowing how it will be used.
Keep KPIs Focused
Too many KPIs can make dashboards difficult to understand.
Combine Workforce and Machine Data
Operator performance should be analyzed alongside machine availability and downtime.
Use Real-Time Visibility
Real-time information allows supervisors to respond during production.
Analyze Historical Trends
Historical data provides better insight than a single shift or day's result.
Maintain Data Accuracy
Incorrect operator assignments or production counts can affect analytics.
Respect Operational Context
Production performance should always be interpreted according to actual working conditions.
Common Mistakes in Workforce Analytics
Measuring Only Production Output
Output alone does not explain the reason behind performance differences.
Ignoring Machine Downtime
Machine downtime can directly affect operator productivity.
Comparing Different Production Processes
Different products and operations may have different production standards.
Using Too Many KPIs
An overloaded dashboard can reduce clarity.
Relying Only on Historical Reports
Historical analysis is useful, but real-time visibility can help teams respond faster.
Treating Analytics as a Punishment System
Workforce analytics should support operational improvement and better resource planning rather than simply tracking employees.
Workforce Analytics and Industry 4.0
Industry 4.0 is creating connected manufacturing environments where machines, sensors, production systems, and workforce information can work together.
Workforce analytics can become part of this connected environment.
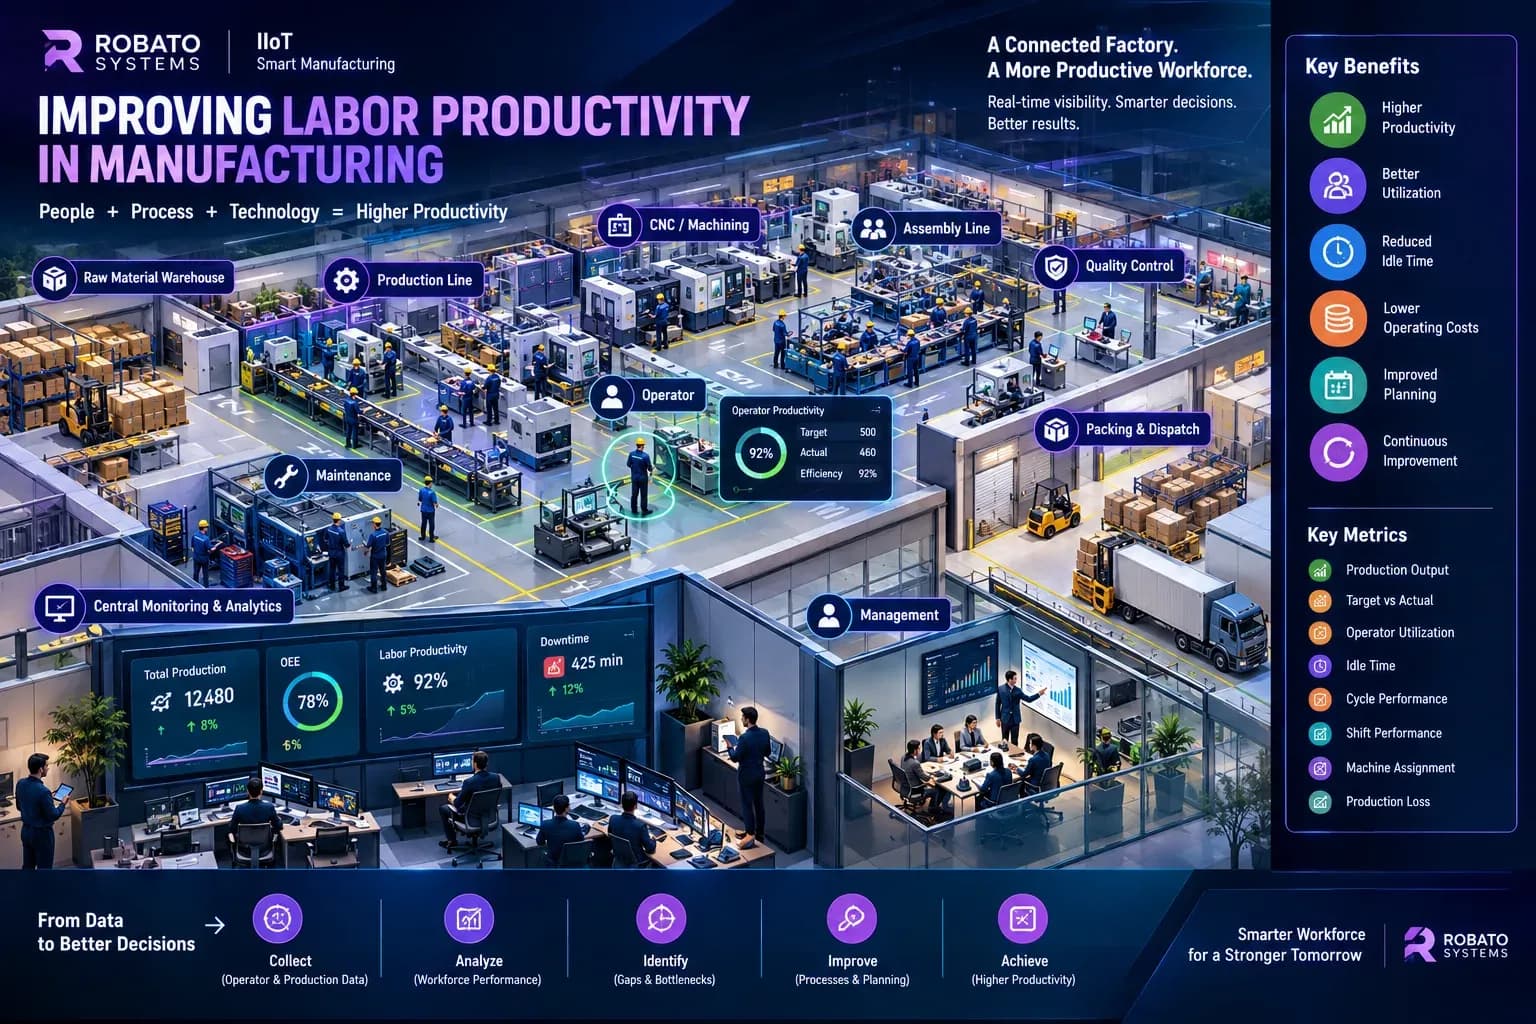
A modern manufacturing data architecture can connect:
Machines + Operators + Production + Downtime + Quality + OEE
This provides a broader view of factory performance.
Instead of analyzing workforce productivity in isolation, managers can understand how operators, machines, and production processes interact.
Workforce Analytics with Robato Systems
Robato Systems helps manufacturers build connected production monitoring environments that bring machine and production information into a centralized digital platform.
Workforce analytics can provide visibility into operator productivity, production targets, actual output, utilization, idle time, shift performance, production rates, and other manufacturing KPIs.
When workforce information is connected with machine status, downtime, production counts, and OEE data, production teams can gain better context around productivity and production losses.
The objective is to help manufacturers identify operational gaps, improve workforce utilization, support production planning, and make better decisions using real-time manufacturing data.
Conclusion
Workforce analytics for manufacturing provides a structured way to understand how workforce resources contribute to production.
By analyzing operator productivity, utilization, idle time, production rates, shift performance, and workforce allocation, manufacturers can identify areas where productive capacity may be lost.
The most effective workforce analytics systems do not look at employees in isolation.
They connect workforce information with machine status, production, downtime, quality, and other manufacturing data.
This provides a more complete picture of factory performance and helps managers investigate the actual causes of productivity gaps.
As manufacturing plants move toward Industry 4.0, workforce analytics can become an important part of connected production management and continuous improvement.
FAQs
What is workforce analytics in manufacturing?
Workforce analytics in manufacturing is the process of collecting and analyzing workforce-related production data to understand productivity, utilization, shift performance, labor efficiency, and workforce allocation.
Why is workforce analytics important for manufacturing plants?
It helps managers understand how workforce resources are being utilized and identify opportunities to improve production efficiency and workforce planning.
What KPIs are used in manufacturing workforce analytics?
Common KPIs include production per operator, production per labor hour, target achievement, operator utilization, idle time, shift productivity, and cycle time performance.
Can workforce analytics track operator productivity?
Yes. Workforce analytics can connect operator information with production data to monitor production output, utilization, target achievement, and other relevant KPIs.
Can workforce analytics be connected to machine data?
Yes. Connecting workforce information with machine status, production counts, and downtime provides better context for understanding productivity.
How does workforce analytics reduce idle time?
It helps identify where operators spend time waiting for machines, materials, instructions, or other production processes.
Can workforce analytics help with workforce planning?
Yes. Historical productivity and utilization data can support workforce scheduling, resource allocation, and production planning.
How does workforce analytics support Industry 4.0?
It connects workforce information with machines, production systems, sensors, downtime, quality, and OEE data to create a more connected manufacturing environment.